Overcoming Challenges of
|
|
|
- Wilfrid Watts
- 5 years ago
- Views:
Transcription

1 SESSION 6 Planning for Your Lane Pricing Project-Part Part 2
2 Overcoming Challenges of Political support and public acceptance Funding and financing Equity Technology Enforcement Integration with long-range planning process
3 Resource slides to use as needed

4 Political Support and Public Acceptance Start with a comprehensive public education program Most people will be unfamiliar with concept Gather perception data through market research methods Need clear message and communication Provide examples of successful projects How they operate Helps with public support Cultivate project champions
5 Public Supportfor Congestion Pricing Public Support for Pricing Project Implementation of Pricing Project Stockholm Referendum Edinburgh & Manchester Referendums Outreach and Education Period Time Demonstration Period Source: CURACAO State of the Art Interim Report, April 26, p. 94,
6 CitizensJury Minneapolis (1995) The University of Minnesota Humphrey Institute conducted a week-long Citizens Jury with 24-randomly selected citizens from the Twin Cities area. Although the Citizens Jury voted 17-7 against congestion pricing as a way to manage congestion and fund transportation, the exit survey was quite enlightening. While 16 opposed congestion pricing, 18 of the 24 were open to considering congestion pricing as an effective solution in the future. Their primary concerns were 1. Congestion not bad enough yet, 2. Congestion pricing not fair Lexus Lane concern, 3. Congestion pricing costs too much raise gas tax instead; and 4. Congestion pricing won t work.
7 Should Minnesota consider congestion pricing in the future? Citizens Jury Results 25% were solidly against congestion pricing 33% were in favor of congestion pricing 42% were opposed to congestion pricing but open to consideration if their concerns were addressed N=6 25% N=10 42% N=8 33% Yes Maybe No Source: Twin Cities Congestion Pricing Citizens Jury, May 1995
8 HOT Lanes Public Reaction Public acceptance has been high on early projects I-394 MnPass 95% satisfaction with all electronic tolling 85% satisfaction with traffic speed in lane 76% satisfaction with dynamic pricing Source: San Diego I-15 Approve 88% Disapprove 11% Don t Know 1% Source: fastrak.sandag.org


9 Public Response to HOT Lanes Negative Reactions Lexus lanes Double taxation Won t impact traffic congestion Band-Aid solution Positive Reactions Choice Encourages ride-sharing and/or transit use Provides funding
10 NYC Congestion Pricing Proposal (2008) Required approval of City Council and State Legislature Priced existing capacity No free driving alternative Everyone entering zone must pay; contrasts with HOT lanes MTA credibility issues affected public perception of transit as a viable alternative to driving
11 Summary of Views on Congestion Pricing From Bruce Schaller presentation; FHWA Webinar on Road Pricing and Public Outreach
12 NYC Lessons Learned Importance of vision and top-level leadership Pricing part of comprehensive plan that includes improved transit service, and served transportation, climate change and land use goals Public involvement shaped the final plan Extensive public outreach and education critical Leadership from civic, business, environmental and advocacy groups Availability of federal funding ($354m UPA)
13 NYC Lessons Learned Public engagement should shape program design Pricing must provide value proposition to those who will pay Particularly challenging when all drivers entering a cordon will pay Need clear rationale why some drivers pay and others do not Need to demonstrate delivery of benefits (reduced congestion, improved transit)
14 Themes in Public Opinion Results The public wants to see the value The public wants to react to tangible and specific examples The public cares about the use of the revenues The public learns from experience The public uses knowledge and information available The public believes in equity but wants fairness The public wants simplicity The public favors tolls over taxes
15 Discussion


16 Funding and Financing Available funding only covers a fraction of needed transportation projects Congestion pricing may offer innovative financing techniques Key to successful project is matching desires and needs of community with specific project goals
17 Terminology Funding Money available to implement a project in development Needed by all projects grants taxes special assessments toll revenues Financing Method used to secure funding Project can be developed to match financing type Innovative methods offer more flexibility can spur infusion of nontraditional funding can accelerate projects
18 How Much Revenue? Tolling and pricing concepts vary in revenue generation Concepts generating healthy revenues Traditional tolling with variable rate Traditional tolling with flat rate Cordon pricing Concepts generating less revenues Express lanes HOT lanes Cross-subsidizing multimodal investments Helps with public acceptance and equity issue
19 I-635 LBJ Managed Lanes I-25 HOV to HOT 91 Express Lanes I-15, I-394 HOV to HOT From TxDOT Managed Lanes Handbook, 2005
20 Gap Funding Options Toll Revenue Bonds TIFIA Loan GARVEE Bonds State Infrastructure Bank Private Activity Bonds (PABs) Build America Bonds Special Tax Districts Alternative Dedicated Revenue Streams Public-Private Partnership Private partner providing equity upfront Risk transfer Tradeoffs (pros and cons)
21 Four Managed Lane Projects Have Reached Financial Close in Last Three Years LBJ (IH-635TX) June 2010 ($ millions) North Tarrant Express (TX) December 2009 ($ millions) Public Funds $ % TIFIA $ % Public Funds $ % TIFIA $ % Toll Revenue Bonds $ % Interest Income $48.5 2% Equity $ % PABs $ % Interest Income $ % Equity $ % Toll Revenue Bonds $ % Capital Beltway June 2008 ($ millions) Public Funds $ % TIFIA $ % Interest Income $ % Equity $ % Bank Debt $ % I-595 (FL) March 2009 ($ millions) Equity $ % TIFIA $ % * Structured as Availability Payment
22 Financing Summary Most projects are traditional non-revenue ones Few are marketable revenue projects Sell sufficient debt to fully finance a project High-volume corridors User fees support maintenance and operations and debt service Managed lanes projects fall in the middle Require leveraging monies from all available sources Project costs and congestion level play critical roles Agency cooperation critical Trend toward funding mosaics using non-traditional gap funding options
23 Discussion
24 Equity Equity concerns in transportation policy are founded on the principles of environmental justice Types of equity concerns Income-based Modal Geographic Fairness (paying twice)
25 Income-Based Equity Social Justice Advocacy Groups concern: This will be a regressive tax on those who can least afford it.
26 New Priced Lanes: Equity Concerns Tolls require a larger share of the income of low-income commuters SR 91 Express lanes* 45% 40% So lower-income drivers 35% use priced facilities less 30% often This creates an equity issue ( Lexus lanes ) *Source: Edward Sullivan, Continuing Study to Evaluate the Impacts of the SR 91 Value-Priced Express Lanes, Final Report, December 2000 (p.87) 25% 20% 15% 10% 5% 0% High Low income income Rate of frequent use


27 *From SR 167 HOT Lane first annual performance summary (2009)
28 Addressing Equity Concerns Addressing income-based equity: Improved and/or lower cost transit service Toll credits or discounts for means-tested drivers Reimbursements of the amount of toll above the transit fare (NYC) Convenient ways for the unbanked to pay
29 Modal Equity Transit Advocacy Groups Concern: Congestion relief will encourage choice transit riders to abandon transit and go back to their cars.

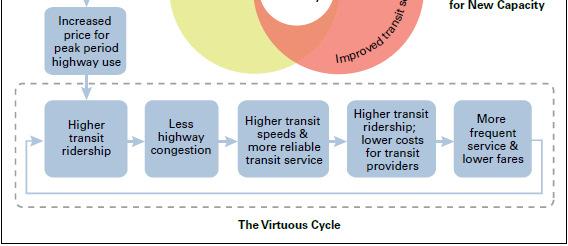
30 Transit and Congestion Pricing
31 Modal Equity 95 Express Miami The 95 Express Bus Service benefitted significantly from the conversion of the HOV lanes into HOT lanes Increased speeds and reduced travel times allowed Miami-Dade Transit to reduce the scheduled travel times for the 95 Express Bus Service I-95 Express buses were on-time 76.2% of the time in 2008, 75.5% in 2009, and 81.1% in 2010 Average weekday ridership on the 95 Express Bus Service increased 57% between 2008 and 2010 while the three control groups in the study experienced a ridership decrease
32 Modal Equity 95 Express Miami Between 2008 and 2010, person throughput from transit increased 23% in the a.m. peak period and 36% in the p.m. peak period Of riders that only began using the 95 Express Bus Service after the Express Lanes were opened in December 2008, 53% said the opening of the Express Lanes influenced their decision to use transit. Of these new riders, 38% said they used to drive alone, but 45% said they used to use some other transit service. Within that 45% figure are 34% who used to take Tri-Rail and Metrorail
33 Addressing Modal Equity Concerns Addressing Modal Equity: Dedicate some of toll revenue to transit (San Diego, Minneapolis) Provide free or discounted service for carpools (HOT lanes)
34 Geographic Equity Local residents concerns: Why do I have to pay for myroad, when my tax dollars went to pay for the other guy s road?
35 Addressing Geographic Equity Concerns Region-wide Approach Long-range planning Incorporate road pricing into LRP All regional residents share in the burden Affordability Lower tolls can be charged since financial burden is spread over more drivers
36 Fairness: Paying Twice Motorist Advocacy Groups Concern: Why impose tolls on existing free roads already paid for with taxes?
37 Construction Cost of New Lanes Providing free new capacity is financially unsustainable $7.00 $6.00 $5.00 Fuel tax receipts from $4.00 peak trips are less $3.00 than 6% of capital cost $2.00 for constructing a new $1.00 lane $ mile highway trip Public Cost per Trip Fuel Tax per Trip Peak period trip
38 Taxes vs. Tolls Trucking Advocacy Groups Concern: Why not just raise taxes they are less expensive to collect than tolls.
39 Taxes vs. Tolls: Congestion Delay Rush hour tolls reduce traffic 80% 70% A 10-14% reduction in 60% traffic results in an 50% 80% reduction in 40% travel delays 30% Source: The Louis Berger Group Inc. Examining the Speed-Flow-Delay Paradox in the Washington, DC Region: Potential Impacts of Reduced Traffic on Congestion Delay and Potential for Reductions in Discretionary Travel during Peak Periods, % 10% 0% Traffic Delay % Red.
40 Equity Observations Payment plans may be structured to be more convenient for low income travelers. High income travelers bear the payment of user costs associated with managed lanes facilities, as most facilities are located in high income areas. Managed lane facilities can provide for additional modal options that are more attractive to lower income commuters Low income customers often value time savings at higher than the prevailing toll, and managed lane facilities provide a reliable travel time saving option.
41 Discussion


42 Technology Tolling (traditional) Road Pricing (new) 42
43 Toll Technology Options Toll gates with cash collection where everyone stops Cash lanes with dedicated electronic toll collection lanes where electronic customers slow down but only cash users stop Open road tolling (ORT) where electronic tolls are collected at highway speeds and cash tolls are collected at pull-out locations All-electronic toll collection (AETC) All tolls are collected at highway speeds There is no provision for cash collection Toll tag transponders and video tolling provide toll collection
44 Technical Feasibility Toll collection Enforcement Occasional users Administrative costs

")
45 Enforcement Technologies Toll Violation Enforcement Systems (VES)

46 Traffic Management/Toll Integration Proactive management Setting variable tolls to control demand Life-cycle operations Other operations functions Traffic/performance monitoring Incident management Enforcement Maintenance

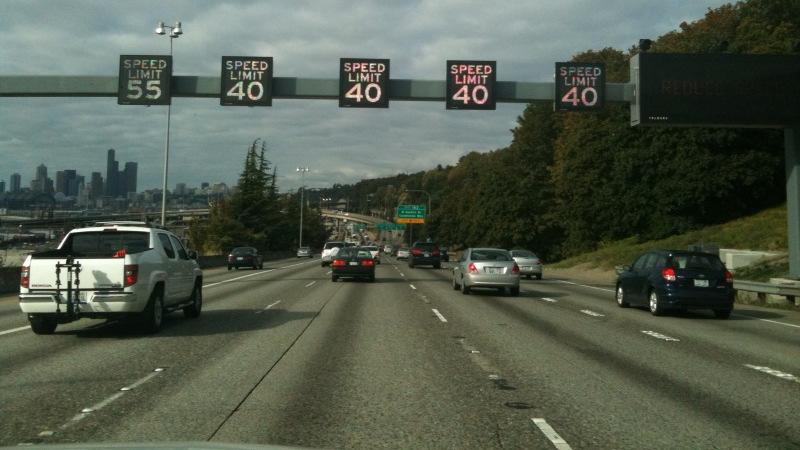
47 Active Traffic Management
48 Traffic Management/Toll Integration Concept of Operations that integrates Pricing Traffic management functions Signing/driver information Incident management Enforcement Toll operations
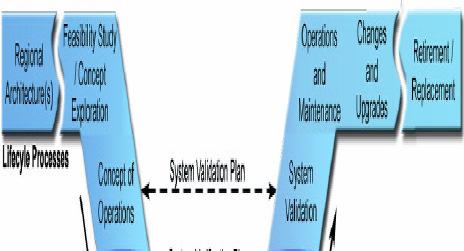
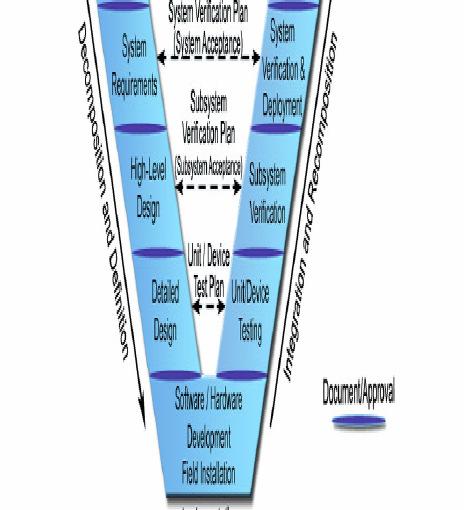
49 Systems Engineering V Diagram
50 Concept of Operations Current system/conditions Concept for proposed system Operational parameters (description from user perspective) Variable pricing system (congestion calculation) System architecture Central processing system Variable toll message sign (VTMS) system Electronic toll collection system Pricing system Communications system Enforcement Incident Management Central system (back office) Customer Service Center (CSC) Account management Revenue management Reporting, financial controls, processes Security Hardware configuration Marketing
51 Discussion
52 Enforcement One of the greatest challenges associated with HOT lane operations Multiple activities involved Enforcement continuum Field enforcement Violation processing Legislative and judicial considerations Fine levels Adjudication process

53 Enforcement Methods Geometric design methods to aid visual check Technology-assisted methods Policy and administrative approaches Supporting regulatory measures Future HOT enforcement considerations
54 Occupancy Verification Verification currently depends exclusively on manual methods Roving patrols Stationary verification Team patrols Designated enforcement areas (ideal conditions) Low speed Enough space to verify and cite violators Hidden from view
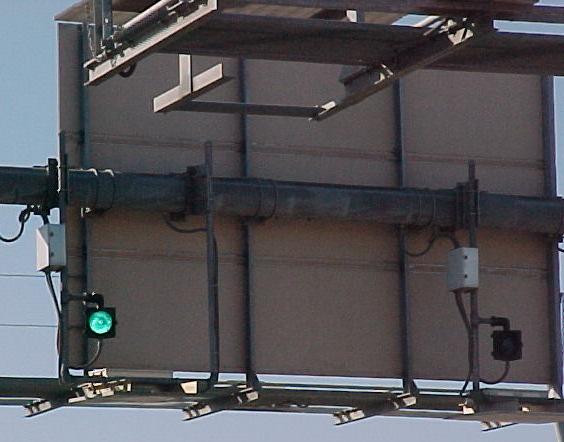


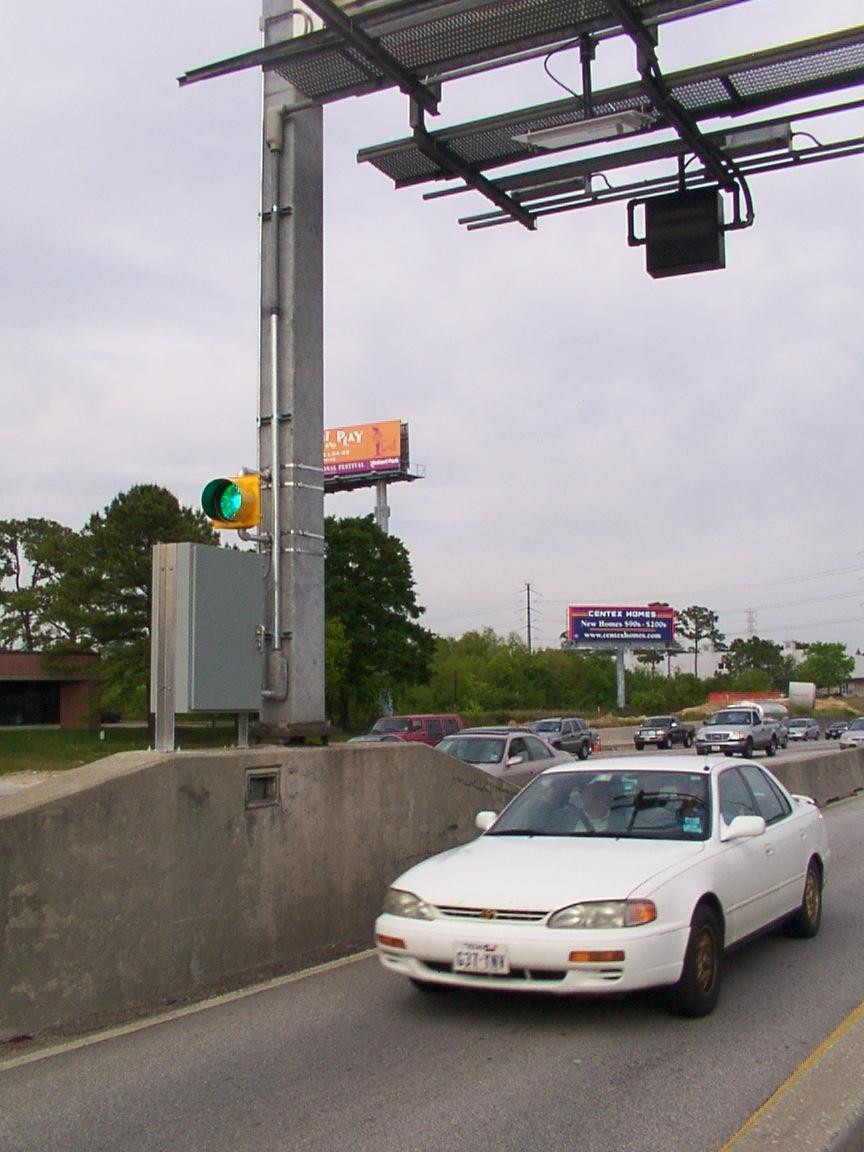
55 HOT Technologies Indicator Beacons Transponder-activated beacon Requires enforcement officers to be within visual range


56 HOT Technologies Handheld and Mobile Systems Transponder verification equipment in hand-held form or mounted to law enforcement vehicles Allows officers to remotely verify transponders from inside their car, alongside or behind vehicles in the HOT lane, or when violator apprehended Switchable transponders
57 Discussion
58 Integration with LR Planning Road pricing often has come about through pilot projects and demonstrations, separate from the traditional MPO process Case studies of four regions: Dallas/Ft. Worth, Texas Puget Sound Region, Washington Minneapolis/St. Paul, Minnesota San Francisco Bay Area, California Integrating Pricing into the Metropolitan Transportation Planning Process: Four Case Studies. Final Report. FHWA
59 Lessons Learned Regional road pricing policy grew from individual projects Puget Sound Regional Council (PSRC) Tacoma Narrows Bridge brought support for tolling for financing Route 167 HOT Lanes introduced congestion pricing Now have a 30-year vision to allow pricing to evolve and support revenue and demand management San Francisco Bay Area Early proposals for pricing Bay Bridge defeated Success of HOT lanes nationally, federal support ultimately led to Bay Bridge pricing, and opening of first HOT lane on I-680
60 Lessons Learned Regional road pricing policy grew from individual projects Once individual projects were committed or underway, and gaining favorable response, regions adopted them into long-range plans and developed supportive policies Need for consistency was a driver Project development Revenue allocation policy Design and technology policies
61 Lessons Learned Developing the right tools for the job Basic 4-step travel demand models not well suited to complexity of pricing Twin Cities emphasis on how many people would choose managed lanes at what price resulted in simple modifications to traffic assignment routines Bay Area use travel survey data for elasticities Puget Sound developed new travel demand modeling and benefit/cost analysis techniques, supported by wealth of data from Traffic Choices study (per-mile pricing demonstration)
62 Lessons Learned Communication of road pricing concepts is a challenge everywhere Especially difficult when concepts are unknown and untested D/FW logical outgrowth of history of toll roads Bay Area how HOT lanes benefit transit, address Lexus Lanes Twin Cities continued public communication for 10 years after failure of original HOT proposal PSRC pricing is one element of a larger plan; Pricing Task Force formed; project champion
63 Lessons Learned Pricing is one element of a cohesive transportation plan All four regions found that making road pricing one element among many was effective at gaining acceptance Integrating project lists, road pricing concepts and decisions about use of potential revenue Pricing as it supports regional goals Puget Sound revenue, GHG emission reduction goals D/FW highway expansion Bay Area revenue to support effective use of existing and planned HOV lanes Twin Cities mix of strategies: bus-only shoulder lanes, priced dynamic shoulder lanes
64 Questions?
65 SESSION 9 Facilitated Discussion Local Application
66 SESSION 10 Summary
67 Construction Cost per Peak Trip Costs in Major Urbanized Areas Normal Cost High Cost Highway construction cost/ lane mile* $13.4 M. $55.9 M. Daily traffic volume in peak periods (5-6 hours/day) 10,000 vehicles 10,000 vehicles Const. cost per vehicle per mile $1,340 $5,590 Const. cost for 20-mile round trip $26,800 $111,800 Annualized const. cost for 20-mile trip** $1,742 $7,267 Cost for 20-mile trip per working day $7.00 $29.00 Gas tax paid for 20-mile trip (2 cents/mile) $0.40 $0.40 *Source: FHWA, in 2006 dollars **Annualization factor assuming a 5.25% discount rate and 30-years
68 Costs for Reconstruction per Trip Costs in Major Urbanized Areas Average Cost Cost per lane mile* $6.7 M. Daily traffic volume (24 hours) 20,000 vehicles Reconstruction cost per vehicle per mile $335 Reconstruction cost for 20-mile round trip $6,700 Annualized cost for 20-mile trip** $436 Cost for 20-mile trip per day $1.20 Gas tax paid for 20-mile trip (2 cents/mile) $0.40 *Source: FHWA, in 2006 dollars **Annualization factor assuming a 5.25% discount rate and 30-years