Practical Application of Predictive Analytics Michael Porter
|
|
|
- Frederick Henderson
- 5 years ago
- Views:
Transcription

1 Practical Application of Predictive Analytics Michael Porter October 2013
2 Structure of a GLM Random Component observations Link Function combines observed factors linearly Systematic Component we solve for these model parameters by maximising the log-likelihood Prior Weight the credibility of the observation Offset Function allows for known effects 2
3 Agenda 1. Definition 2. Simple example to show you how it works 3. Six real-world examples 4. Concluding remarks 3
4 Definition 4

5 Predictive analytics From Predictive Analytics by Eric Siegel 5
6 RGA s version A process by which current or historical facts are used to create predictions about future events or behaviors 6
")
7 You need lots facts (data) 7
8 Predictive Modeling Process High Level View 1. Define Purpose of the Model 2. Collect & Prepare the Data 3. Develop Models 4. Interpret & Apply Models 5. Monitor Results & Update 8
9 Predictive Modeling Process Stage 1 1. Define Purpose of the Model 2. Collect & Prepare the Data 3. Develop Models 4. Interpret & Apply Models 5. Monitor Results & Update Identify Business Motivations Identify Goals of the Model What are we really trying to accomplish? What questions should model answer? What is the purpose of the model? What are the potential applications? 9
10 Predictive Modeling Process Stage 2 1. Define Purpose of the Model 2. Collect & Prepare the Data 3. Develop Models 4. Interpret & Apply Models 5. Monitor Results & Update Gather Data Understand Data Clean Data Transform Data? Split Data into Training Data& Validation Data Data must include predictor variables and outcomes to properly build model Data can come from many sources Quality & quantity of data are critical Important to feed the right variables into the model 10
11 Predictive Modeling Process Stage 3 1. Define Purpose of the Model 2. Collect & Prepare the Data 3. Develop Models 4. Interpret & Apply Models 5. Monitor Results & Update Process is iterative Model choice will depend on data structure and application Variable selection is important predictive, available, legal, and not controversial Test model fit Model Type Selection Identify Constraints Train Model Test Model Validate Model Meets Requirements? Model Examples Regression (linear, general linear, nonlinear) Generalized Linear Models (Binomial / Multinomial, Poisson, Logistic, Gaussian, Gamma, Inverse Gaussian, etc. Time series analysis Decision Tree Analysis (CART, MARS) Machine Learning Algorithm (neural networks, support vector machine, cluster analysis, K- nearest neighbor, genetic programming) 11
12 Predictive Modeling Process Stage 4 1. Define Purpose of the Model 2. Collect & Prepare the Data 3. Develop Models 4. Interpret & Apply Models 5. Monitor Results & Update Can be very difficult to interpret results Need support from the top (and possibly from the outside), since model could: go against conventional wisdom be a significant shift from traditional methods to doing business affect many in the process Interpret Results Communicate / Gain Acceptance Create Rules Train Staff Deploy Model 12
13 Predictive Modeling Process Stage 5 1. Define Purpose of the Model 2. Collect & Prepare the Data 3. Develop Models 4. Interpret & Apply Models 5. Monitor Results & Update Track performance to make sure model is working Refresh data and update the model Recalibrate to ensure accuracy Monitor Output & Performance Test Results Against Objectives Refresh Data Refine Model 13
14 big data searches on Google Trend 14
15 big data searches on Google Trend 15
16 Model choice Operational Research Simulation Optimisation Simulated Annealing Forecasting Fourier Transforms Wavelets Link Analysis Decision Trees Random Forest Support Vector Machines Data Mining Harmonic Analysis Neural Networks K-Means Clustering Linear, Logistic Regression, GLMs, MARS Genetic Algorithms Graph Theory Time-series Analysis Bayesian Networks BI Querying OLAP Cross-tabs Visualisation SQL Modified from a version presented by John Elder, Monte Carlo Principle Components Reliability/Survival Analysis ANOVA MANOVA Correlation Factor Analysis Statistics 16
17 A simple examples to illustrate how it works 17
18 Traditional marketing Spam Hit or miss one size fits all Source: Jay Walker-Smith, Consumer Research Group 18 18
 Source: Empire Research")
19 Recall rates 1965 (34%) 1990 (8%) 2007 (2) Source: Empire Research Group 19
20 How do we fix this? Use data about the customer Demographics age, gender, income, location Past buying behaviour The right offer for the right customer which is delivered in the right way Predictive Analytics 20
21 Predictive analytics vs. Traditional marketing 40,000 People Who Buy 20, ,000 1,000,000 People Targeted 21
22 Predictive analytics vs. Traditional marketing 40,000 People Who Buy 20,000 Predictive Analytics Lift ,000 1,000,000 People Targeted 22
23 Why not go after everyone? You don t want to annoy your customers Limited resources Communication frequency 23
24 Examples 24
25 Example 1: Large bank in Asia Lots(!) of customers Low penetration of life product Objective: Create a predictive underwriting model to pre-select existing customers: Increase sales Reduce underwriting costs 25
26 Likelihood to buy Modeling goal High Guaranteed issue Simplified issue Full underwriting Low Low Do not make an offer Likelihood to be sub-standard High 26
27 Data required Started with lots of bank customer data Age Branch (proxy for location) AUM Used a GLM to identify about a dozen predictor variables Customer segment Etc Underwriting outcome for each customer Based on full uw About 8,000 (minimum!) 27
28 non-std Rate non-std Rate Results In-sample data Model may over-fit the data 0.5% non-std in top 3 deciles Validation data Better test of model performance 0.6% non-std in top 3 deciles 5x lift 18.0% 16.0% Lift Plot for In-Sample Results 16.0% 14.0% Lift Plot for Validation Results 14.0% 12.0% 12.0% 10.0% 8.0% 6.0% 4.0% Declined Rated Average nonstd Rate 3.0% 10.0% 8.0% 6.0% 4.0% Declined Rated Average nonstd Rate 3.0% 2.0% 0.6% 0.5% 0.2% 2.0% 0.4% 0.8% 0.5% 0.0% Sorted Model Output 0.0% Sorted Model Output 28
29 non-std % A better illustration of the results Cumulative non-std proportion Best 30% of model outputs contains about 5% of non-std Lowest 30% captures about 75% of bad risks Model Gain Curve Model implementation Results delivered to the client Final implementation stage In-sample results Validation results Random Sorted Model Output 29

30 Example 2: Amazon.com 30
31 The Secret Race why recommended? 31
32 Recommendation Algorithm Create a personalised shopping experience Generates a list of recommended items using: Previous purchases Shopping cart Items viewed Items rated Demographic data Subject interests The result? 20-30% increase in sales 32
33 Key challenges Lots of data Continuous interaction Recommendations in real-time 33

34 The answer? Would think that they group people with similar profiles But they match items based on gets bought together 34
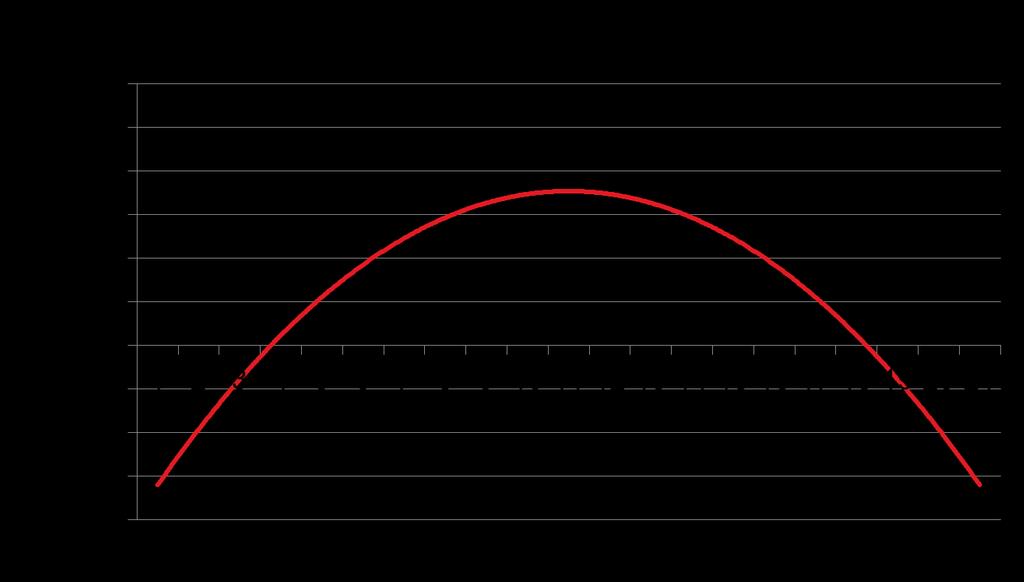
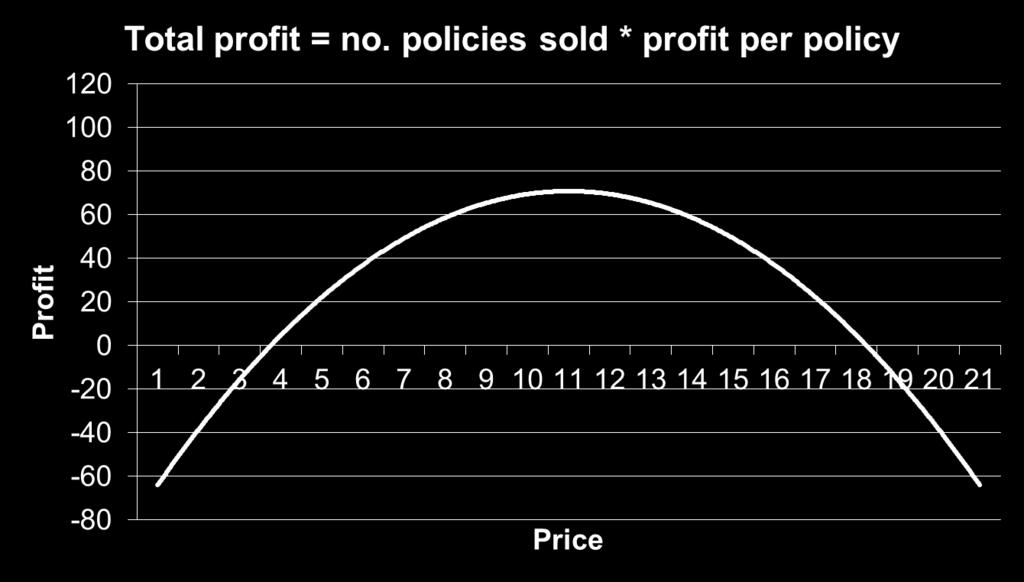
35 Example 3 Demand-based pricing 35
36 For a sample of new quotes How to derive the curve Price elasticity of demand = % change quantity demanded % change in price Proportion of customers Premium adjustment First 10% -2.5% Next 10% -2.0% Next 10% -1.5% Next 10% -1.0% Next 10% -0.5% Next 10% +0.5% Next 10% +1.0% Next 10% +1.5% Next 10% +2.0% Next 10% +2.5% 36
37 Price elasticity varies by different factors Gender Age Income Time of sales call Etc. 37


38 Time of sales call Source: Right thumb 38
39 Other thoughts Need to consider impact on lapses Other applications? Initial policy fee 39

40 Example 4: Google Ads Interest: Finance - Banking Bicycles & Accessories Autos & Vehicles - Bicycles & Accessories Books & Literature Arts & Entertainment - Celebrities & Entertainment News Computer & Video Games Games - Computer & Video Games Computers & Electronics Contests, Awards & Prizes Hobbies & Leisure - Contests, Awards & Prizes East Asian Music Arts & Entertainment - Music & Audio - World Music Jobs & Education - Education Beauty & Fitness - Fashion & Style Fitness 40
41 Example 5: Claims management Short Term Insurance Suspicious Claim Factors Time and day of claim Claim notification period Previously rejected claims Time on risk since inception or policy amendment Police case number or not Vehicle wasn t towed when you expected this Etc. 41
42 Example 5: Claims management Disability Income Claims To what extent an income disability claims should be case managed Funeral Claims Systems such as Veritas are used to determine the likelihood that a funeral claim is fraudulent 42
43 Example 6: Smoker non-disclosure Idea is still being born we re busy doing the maths Assume that you randomly test non-smokers for cotinine And the testing shows that 10% lie (are actually smokers) Lie rate for all non-smokers perhaps a little higher 43

44 Possible outcome of a predictive model Test everyone Source: Left thumb 44

45 Illustrated differently Source: Left thumb 45
46 Cost: Benefit analysis Depends what you currently do Randomly test 20% No saving on cots test About 4% of smokers will non-disclose (instead of 10%) Test everyone Save 80% of cots tests About 4% of smokers will non-disclose (instead of 0%) 46
47 Concluding remarks It s a process, not a product Collaboration with other teams is crucial You don t have to be 100% accurate Try to get maximum lift with minimum cost If you re serious about predictive then we re serious about helping you! And we re pretty good at this stuff 47
48 Thank you for your attention 48