BRAND MANAGEMENT. Session 1 & 2 Marketing Revisited. Brand Management and Brand Equity. Don O Sullivan
|
|
|
- Ernest Merritt
- 5 years ago
- Views:
Transcription


1 1
2 BRAND MANAGEMENT Session 1 & 2 Marketing Revisited. Brand Management and Brand Equity Don O Sullivan d.osullivan@mbs.edu
3 Assessment Assessment Weighting Due Date Class Participation 20% Ongoing Syndicate Assignment 30% 14 th May 2016 Final 90-minute Examination (Hurdle Requirement) 50% 15 th May 2016
4 Constraint On Growth Has Shifted From Supply To Demand Australian GDP over the last 20 years 6

5

6
7 Market Orientation Focus on a competency to serve a customer and outperform a competitor Company Inter-functional coordination: Processes and routines to recognise and respond to changes in the market Competitor Competitor Orientation: Detailed understanding of the strengths, weaknesses, capabilities and strategies of competitors Customer Customer Orientation: Understanding target customers needs and creating superior value for them 9
8 Choices.. Most leaders do not like to make choices. They d rather keep their options open. Choices force their hands, pin them down, and generate an uncomfortable degree of personal risk A.G. Lafley


9 Making Choices: P&G divest, discontinue or consolidate 100 brands
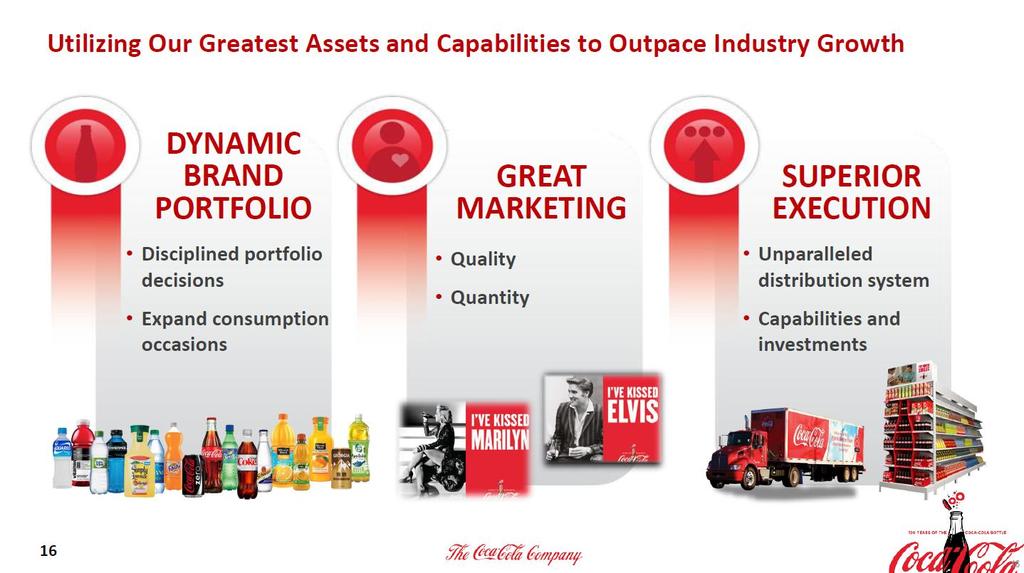
10 Growth decisions at the portfolio & brand level Goals & Expectations? 1. What is our competitive advantage? 2. Where can we grow? 3. Where should we grow? 4. What is our strategy? 5. How will we execute? Revenue Valuable Retention/ Referral Brand Profit Rare Market Share/ Customer Share Visibility Capital Efficiency Difficult to Imitate Price Premium Delivery Market Leadership Organized to Capture Value Addressable Market Leverage 12
11 Growth decisions at the portfolio & brand level Goals & Expectations? Revenue 1. What is our competitive advantage? 2. Where can we grow? 3. Where should we grow? 4. What is our strategy? 5. How will we execute? Valuable Retention/ Referral Brand Profit Rare Market Share/ Customer Share Visibility Capital Efficiency Difficult to Imitate Price Premium Delivery Market Leadership Organized to capture value Addressable Market Leverage
12

13

14

15

16
17 Growth decisions at the portfolio & brand level Goals & Expectations? 1. What is our competitive advantage? 2. Where can we grow? 3. Where should we grow? 4. What is our strategy? 5. How will we execute? Valuable Revenue Retention/ Referral Brand Profit Rare Market Share/ Customer Share Visibility Capital Efficiency Difficult to Imitate Price Premium Delivery Market Leadership Organized to capture value Addressable Market Leverage
18 Assets and Competitive Advantage Valuable, Rare, costly to Inimitable, Organized (VRIO) The assets are.. and is the firm. Valuable? Yes Rare? Yes Yes Costly to imitate? Yes Organized to capture value? Yes Sustainable growth model No No No No Competitive disadvantage Competitive parity Temporary competitive advantage Unused competitive advantage 21


19 180 o shift in firm value over 30 years Market to Book Value S&P % 90% 80% 70% 60% 50% 40% 30% 20% 10% 0% 20% 20% 80% 80% 45% 45% 55% 55% 85% 85% 15% 75% 75% 80% 80% 25% 20% 15% 25% 20% 95% 100% Facebook 5% Tangible Book Value Remaining Market Value
20 23

21 Most Valuable Brands

22 Brand Finance Methodology * 25


23
24 A.G. Lafley 28

25 P&G: A decade of double digit growth 29

26 Target s mind blowingly stupid rebates What is so disappointing about this is that people have made the decision, probably through an implied pressure, to do something that was mind-blowingly stupid, If we reported Target s performance as $53 million rather than $74 million, we would have said `this is a disappointing financial outcome... but we still think there has been progress in terms of the quality of the business. Wesfarmers MD Richard Goyer April
27 Growth decisions at the portfolio & brand level Goals & Expectations? 1. What is our competitive advantage? 2. Where can we grow? 3. Where should we grow? 4. What is our strategy? 5. How will we execute? Revenue Valuable Retention/ Referral Brand Profit Rare Market Share/ Customer Share Visibility Capital Efficiency Difficult to Imitate Price Premium Delivery Market Leadership Organized to capture value Addressable Market Leverage
28 Leveraging Brand Assets: Key Indicators 1. Retention Our customers buying for longer 2. Share of Customer Our customers buying more from us 3. Referral Our customers advocating our product/ service 4. Margin Our customers paying a higher price 5. Share of market / Organic Growth Winning customers / business from competitors 6. Addressable Market Expanding the size of the potential market 38

29 Evaluate fit between current capabilities and future opportunities 41


30

31 The decline in coffee-drinking was due to the fact that most of the coffee people bought was stale and they weren't enjoying it. Once they tasted ours and experienced what we call "the third place".. a gathering place between home and work where they were treated with respect.. they found we were filling a need they didn't know they had. Howard Schultz CEO Starbucks
32 Growth decisions at the portfolio & brand level Goals & Expectations? 1. What is our competitive advantage? 2. Where can we grow? 3. Where should we grow? 4. What is our strategy? 5. How will we execute? Revenue Valuable Retention/ Referral Brand Profit Rare Market Share/ Customer Share Visibility Capital Efficiency Difficult to Imitate Price Premium Delivery Market Leadership Organized to capture value Addressable Market Leverage
33 Four elements of brand management Brand Visibility Delivery Leverage
34 (positioning) Points of parity Brand Company Competitor Visibility Points of differentiation Customer Points of differentiation Points of differentiation potential advantages within the category Delivery Leverage Points-of-difference Attributes or benefits consumers strongly associate with a brand, positively evaluate, and believe they could not find to the same extent with a competitive brand Points-of-parity Associations that are not necessarily unique to the brand but may be shared with other brands. Associations that other brands develop as points of difference
35 Four elements of brand management Brand Visibility Delivery Leverage
 benefits offered? Frame of reference and points of parity What category does it compete in & what common benefits does it provide? Target Who is the brand for?")
36 Marketing Tasks Across the brand Pyramid Delivery (post purchase) Points of difference and support What are the reasons to believe in the brand promise What are the Unique (functional, emotional, social) benefits offered? Frame of reference and points of parity What category does it compete in & what common benefits does it provide? Target Who is the brand for? Visibility Bonding Advantage Performance Relevance Awareness 60
37 Inflation in advertising as a % of sales Brand Visibility Delivery Almost 50% increase in advertising / sales ratio Leverage Global adspend 2015: = $540bn - Carat 63
38 Four elements of brand management Brand Visibility Delivery Leverage

39 Brand Visibility The restaurant manager trumps the brand manager every time in terms of our ability to deliver the brand promise. Russ Klein, CMO Burger King Delivery Leverage
40 To what extent do you agree with the following statement (0= strongly disagree, 10 = strongly agree) Brand Visibility We have a customer oriented organizational culture Delivery Leverage

41 Brand A company's culture and a company's brand are really just two sides of the same coin. The brand is just a lagging indicator of the culture. Tony Hsieh CEO Zappos Your b Visibility Delivery Leverage


42 Revenue Growth 72
 $38325.00 Avg. extra comp. (for hourly employee) $7489.")
43 Brand Visibility Delivery Zappos 2015 rank 86 Avg. base pay (for hourly employee) $ Avg. extra comp. (for hourly employee) $ Leverage Mars 2015 Rank 85 Avg. base pay (for hourly employee) $ Avg. extra comp. (for hourly employee) $ Over 30% difference in average pay 73

44 Brand Visibility The best customer service is if the customer doesn t need to call you, doesn t need to talk to. Jeff Bezos founder and CEO of Amazon Delivery Leverage


45 Four elements of brand management Brand Visibility Delivery Leverage 76
46 Leveraging Brand Assets: Key Indicators 1. Retention Our customers buying for longer 2. Share of Customer Our customers buying more from us 3. Referral Our customers advocating our product/ service 4. Margin Our customers paying a higher price 5. Share of market / Organic Growth Winning customers / business from competitors 6. Addressable Market Expanding the size of the potential market Brand Visibility Delivery Leverage 77

47 #1 Retention Customer Effort Score Brand Visibility Delivery Leverage 78


48 # 2 Share of Customer Brand Visibility Delivery Leverage
 % Detractors (0 to")


49 # 3 Referral NPS % Promoters = - (9 & 10) % Detractors (0 to 6) Brand Detracto rs Passives Promote rs Visibility Not Likely Extremely Likely Delivery Leverage

50 # 4 Margin The single most important decision in evaluating a business is pricing power. If you ve got the power to raise prices without losing business to a competitor, you ve got a very good business. Brand Visibility Delivery Leverage And if you have to have a prayer session before raising the price by 10 percent, then you ve got a terrible business.
 Price increase of 1%")


51 # 4 Margin Mean Impact of Price Change on S&P 1500 Company (%) Price increase of 1% Profit increase of 8% Brand Visibility Delivery Leverage 19.2 Revenues Fixed Costs Variable Costs Operating Profits Source: Compustat; Mckinesy Analysis

52 # 5 Market Share Brand Visibility Delivery Leverage 85


53 # 6 Size of Addressable Market Brand Visibility Delivery Leverage Salesforce Analyst Day
54 From market to brand element to tactical activity Market Dynamics Category Performance Volume market size ( ) Volume share ( ) Value market size ( ) Value share ( ) Brand Visibility Buying Behaviour How many people Penetration How much they buy Loyalty & Consumption Delivery Brand Element Brand Visibility Delivery Leverage Tactical Activity Innovate offer Broaden offer (SOC / TAM) Enhance proposition Owned, earned & paid media Mental & physical availability Quality Service /Culture Support for brand promise 87

55 Contextual attributes of the brand: heritage, values & mission Heritage Values Brand Values Mission Heritage Values Visibility Values Mission Heritage Values Delivery Values Mission Heritage Values Leverage Values Mission 88
56 Four elements of brand management 8 questions Evaluate your brand on a scale of 1 to 10 (1 poor, 10 excellent) Brand Clear, compelling promise of unique value: Strong, positive brand associations: Visibility High levels of awareness of promise in target market: Awareness achieved through paid, earned and owned media: Delivery High awareness and alignment on promise internally: Strong promise delivery across all touch-points: Leverage Leveraged to grow in customer retention/ share/ referral or margin Leveraged to grow market share or addressable market:


57 Management of a Brand Portfolio Brand Visibility Delivery Leverage 98
58 Lifecycle assumptions and their implications Sales Profit Introduction / Growth Maturity / Decline Time


59 Lifecycle assumptions and brand management implications DON T ASK ME TO TAKE RISKS WHEN YOU ARE SQUEEZING ME FOR CASH TODAY JUST BECAUSE I WANT CASH TODAY DON T CALL ME RISK AVERSE
60 BRAND MANAGEMENT Session 1 & 2 Marketing Revisited. Brand Management and Brand Equity Don O Sullivan d.osullivan@mbs.edu
61 Syndicate Assignment (syndicate # and firm) 1. Nike 2. GE 3. Procter and Gamble 4. IBM 5. Unilever 6. SAP 7. Qantas 8. Salesforce 9. Nestle 10. Wesfarmers 103
62 Syndicate Assignment (30%) Each syndicate will have the opportunity to analyse brand management in one publicly listed company. This is a task that shareholders face and more particularly a task faced by the analyst community whose role is to advise shareholders. As the balance sheet is typically uninformative as a means of communicating brand health (and the health of other intangible assets), boards and top management have had to address the information asymmetry with investors by providing additional information. Thus, the Investor Relations sections of corporate websites have become the repository of important information. The information comes in many forms in addition to traditional financial reporting web casts, shareholder presentations and commentaries by the board and members of the top management team. In this exercise, we are going to engage with the data provided to investors through corporate web sites to develop a clearer understanding of performance, challenges and prospects for each firm s brands. Task Your syndicate will analyse the brands of a specific company identified at the start of the course. Your task is to review of the company s recent corporate reports / investor presentations available on the Investor Relations section of the company s web site. 1. Summarize the management of the company s brands to-date 2. Identify current challenges 3. Discuss the key initiatives the firm is implementing to address these challenges 4. Evaluate the medium term prospects for the brand(s) Deliverable A seven minute presentation to shareholders/potential shareholders (i.e., your peers followed by Q&A) on May 14 th. PowerPoint Presentation 7 slides max to be ed to emba@mbs.edu prior to class. Written summary of the key points in your presentation (1,000 words max) due prior to class.