FACT BOOK - OCTOBER 2005
|
|
|
- Maud Hardy
- 5 years ago
- Views:
Transcription

1 FACT BOOK - OCTOBER 2005


2 Coca-Cola Amatil becoming... a broader based Beverage and Food Company H Revenue $1.9bn EBIT $267m Capital Employed $3.4bn 8% 6% 10% 4% 13% 17% 12% 0% 23% 6% 18% 55% 77% 10% 42% Australia South Korea SPCA Pacific Indonesia & PNG Market Cap.: ~A$6 billion (ASX Top 50)

3 OUR COMMITMENT TO INCREASING SHAREHOLDER RETURNS Our commitment has been to materially increase shareholder returns. In August 2005 CCA delivered its ninth consecutive half year of double-digit earnings growth. Since 2001, the market capitalisation of CCA has increased by over 40% (or approximately $1.7 billion) to approximately $6 billion and shareholder returns have grown at a compound annual growth rate of 17% per annum. Earnings per share (cents) Dividends per share (cents) ROCE* 19.9% H2 H % 8.4% 9.5% 10.6% 11.0% H H H H On the basis of a continuation of current trading conditions, CCA expects to deliver low double digit net profit growth for the second half of *Pre IFRS equivalent for H = 11.0% Post IFRS ROCE = 19.9% 1

4 KEY BUSINESS DRIVERS Our overall strategy is to drive our customers and CCA s profitability through CCA s five pillars of growth. These are: 1. Product and package innovation 2. Non-carbonated beverage and food expansion 3. Growing product availability through cold drink equipment placement and outlet expansion 4. Improved customer service and in-market activation 5. Revenue management and cost discipline 2


5 1. PRODUCT AND PACKAGE INNOVATION Deep Spring Natural Mineral Water with real fruit juice was relaunched in October 2005 in a new proprietary bottle. Sprite Zero, launched in January 2005 is already the number 1 lemonade in the diet carbonated soft drink market. Fruitopia Alive is CCA s new juice smoothie offering. Alive comes in a new 450ml size bottle and has no added sugar and is available in 3 new rich tasting flavours. Alive provides the meal replacement option consumers have been asking for. Squeezable Powerade pack has resulted in an immediate increase in consumption. Lighter pack with 10% less resin = $2 million savings in
6 2. NON CARBONATED BEVERAGE AND FOOD EXPANSION 4 CCA s share of the Australian water segment has increased from 15% to 35% in the last two years and significant opportunity to grow still exists. Packaged Water Market The world s largest juice brand, Minute Maid, was launched in South Korea in June The range includes 100% juice, Bone PLUS, Heart PLUS and Kids PLUS. CCA The acquisition of SPC Ardmona in February 2005 provides CCA with opportunity for expansion into the high growth health and well being segment. SPC Ardmona revenue growth will be driven by: improved customer and field force capability delivering category leadership through brand differentiation developing new products and line extensions expanding SPCA brands into new channels and categories In August 2005, CCA acquired the premium coffee company, Grinders Coffee. The business generates around $11 million in revenue and will enhance our product offering in the HORECA channel.
7 3. GROWING PRODUCT AVAILABILITY THROUGH COLD DRINK EQUIPMENT PLACEMENT AND OUTLET EXPANSION Cold Drink Placement The placement of coolers continues to be a priority and CCA is partnering with key suppliers to develop unique and innovative solutions to build sales volume. An example of this is the introduction of retro coolers in the HORECA (Hotel, Restaurants and Cafés) channel which has increased our penetration of this profitable channel. Cold Drink Facts In 2005, we invested $100 million in cold drink equipment which is approximately 40% of annual capital expenditure At the end of the first half of 2005, CCA had 120,000 coolers in the Australian market Outlet Expansion In Australia and New Zealand CCA has been targeting non-traditional outlets such as newsagencies and pharmacies, resulting in retail customer growth in 2004 in Australia by over 5%. Potential CCA s 2004 Customer Universe Coverage Growth Australia 0.3m outlets 35% >5% New Zealand 0.1m outlets 30% 2% Indonesia 1.4m outlets 30% 15% South Korea 0.5m outlets 20% 30% Targeting nontraditional outlets Targeting expanded availability in traditional outlets 5
8 4. IMPROVED CUSTOMER SERVICE AND IN-MARKET ACTIVATION Customer Service Focus CCA has centralised its Australian and New Zealand customer order taking, channelling orders and campaign management through its customer service centres. This enables the sales force to focus on more conceptual selling. In-Market Activation - HORECA Strategy The licensed channel has grown revenue by over 7% in the first 6 months of 2005 as a result of CCA s HORECA strategy. 6


9 5. REVENUE MANAGEMENT AND COST DISCIPLINE CCA s first automated distribution centre in Mentone, Victoria is generating approximately $7 million in annual cost savings on an investment of $30 million. As a result, CCA has improved its service levels by: reducing the turn around time for trucks by half to approximately 15 minutes; and increasing the pick accuracy of customers orders from 96.0% to 99.5%. By early 2008, automated distribution facilities will be operating in Sydney and Auckland. Construction will be at a total combined cost of $200 million to $250 million. 7
 Warehouses 14 Stock Keeping Units (approx) 256 Cross Dock Locations 75 Number of Customers (approx) (excluding Neverfail) 74,100 Sports Drinks RTD Tea/Coffee Energy")
10 AUSTRALIA NARTD MARKET (200 litres per capita) Water Juice CSD 58% CCA S KEY FACTS (as at 30 June 2005) Production Facilities 14 Employees 3,446 Production Lines 35 Number of Coolers (approx) 120,000 (excluding Quirks and Neverfail) Warehouses 14 Stock Keeping Units (approx) 256 Cross Dock Locations 75 Number of Customers (approx) (excluding Neverfail) 74,100 Sports Drinks RTD Tea/Coffee Energy Other KEY COMPETITORS - CSDs Grocery C&L CCA 62% 80% Pepsi/Schweppes 23% 7% *Based on YTD AC Neilsen value data FINANCIALS CAGR H Revenue ($ million) 1, , , , % 1,023.0 Volume (million unit cases) % Revenue per Unit Case ($) % 6.60 EBIT ($ million) % EBIT margin (%) Capex to Revenue (%) CCA s Category Mix (UC) CCA s Package Mix (UC) CCA s Channel Mix (UC) 55% 46% 45% Other 1% RTD Tea/Coffee 0% Ene r gy Sports Juice 0% 3% 1% 23% 12% 10% 9% Water 16% CSD 79% PET Cans Fountain Other Supermarkets C&L Other 8 1. These numbers have been prepared based on Australian Equivalents to International Financial Reporting Standards. 2. Excludes significant items.
11 Australia s Leading Beverage Brands CARBONATED SOFT DRINKS KEY FACTORS Coca-Cola diet Coke CCA s CSD Market Share 60% (approx.) Coca-Cola is the number 1 selling NARTD brand Diet Coke is the number 2 selling NARTD brand Fanta Sprite Zero NON-CARBONATED BEVERAGES CCA s Market Share (approx.) Juice - 1%, Water - 35%, Sports - 50% KEY FACTORS CCA sells the number 1 and 2 selling water brands CCA sells the top 3 Sports Drink SKUs in Foodstores Mount Franklin Pump Powerade Fruitopia J 9
12 PACIFIC (NEW ZEALAND AND FIJI) NZ NARTD MARKET (150 litres per capita) Sports Lifestyle Flavoured Milk Energy Juice Water NZ KEY COMPETITORS - CSDs CCA 76% Frucor 7% *Based on YTD AC Neilsen volume data CSD 58% CCA S KEY FACTS (as at 30 June 2005) New Zealand Fiji Production Facilities 5 1 Production Lines 12 4 Warehouses 7 5 Employees Number of Coolers (approx) 20,200 3,150 Stock Keeping Units (approx) Number of Customers (approx) 16,200 2,665 FINANCIALS CAGR H Revenue ($ million) % Volume (million unit cases) % 33.0 Revenue per Unit Case ($) % 6.66 EBIT ($ million) % 37.5 EBIT margin (%) Capex to Revenue (%) CCA s Category Mix (UC) Other 5% RTD Tea 0% CCA s Package Mix (UC) 77% CCA s Channel Mix (UC) 56% 40% Ene r gy 1% Sports Juice 2% 13% 9% 11% 3% 4% Water 7% CSD 72% PET Cans Fountain Other Supermarkets C&L Other These numbers have been prepared based on Australian Equivalents to International Financial Reporting Standards. 2. Excludes significant items.
13 New Zealand s Leading Beverage Brands CARBONATED SOFT DRINKS KEY FACTORS Coca-Cola diet Coke CCA s CSD Market Share 76% (approx.) Coca-Cola - number 1 selling NARTD brand CCA sells the top 4 CSD brands - Coca-Cola, diet Coke, Sprite and Schweppes Raspberry Coke Sprite NON-CARBONATED BEVERAGES CCA s Market Share (approx.) Juice - 31%, Water - 35%, Sports - 94% KEY FACTORS Water - Pump is number 1 brand and Kiwi Blue is the fastest growing major brand Powerade - number 1 sports drink brand Keri - brand leader in supermarkets Pump Keri Kiwi Blue Powerade 11
14 SOUTH KOREA NARTD MARKET (80.2 litres per capita) Water Sports RTD Tea/Coffee Juice Other KEY COMPETITORS - CSDs CCA 40% Lotte 27% Pepsi 16% CSD 40% CCA S KEY FACTS (as at 30 June 2005) Production Facilities 3 Employees 2,492 Production Lines 17 Number of Coolers (approx) 75,000 Warehouses 19 Stock Keeping Units (approx) 200 Cross Dock Locations 12 Number of Customers (approx) 113,000 FINANCIALS CAGR H Revenue ($ million) % Volume (million unit cases) % 63.0 Revenue per Unit Case ($) % 4.93 EBIT ($ million) % 0.9 EBIT margin (%) Capex to Revenue (%) CCA s Category Mix (UC) CCA s Package Mix (UC) CCA s Channel Mix (UC) Other RTD Tea Ene r gy 0% 3% 0% 59% 24% 42% 34% Sports Juice 5% 4% 15% 16% 10% Water 10% CSD 78% PET Cans Fountain Other Supermarkets C&L Other These numbers have been prepared based on Australian Equivalents to International Financial Reporting Standards. 2. The 2004 A-GAAP comparatives were restated to include returnable containers as plant and equipment, therefore additions to returnable containers were included in capex for this and subsequent financial years. This change only effected CCA's South Korean and Indonesian operations. 3. Excludes significant items.
15 South Korea s Leading Beverage Brands CARBONATED SOFT DRINKS KEY FACTORS Coca-Cola Coca-Cola Light CCA s CSD Market Share 40% (approx.) Coca-Cola - number 1 selling NARTD brand Fanta - number 1 selling flavoured CSD brand Kin - number 2 clear CSD brand Fanta NON-CARBONATED BEVERAGES Minute Maid Kin Soonsoo 100 CCA s Market Share (approx.) Juice - 3%, Water - 9%, Sports - 16% KEY FACTORS Powerade - number 3 selling Sports brand The world s largest juice brand, Minute Maid was launched in June 2005 Powerade Nescafe 13
 Indonesia Papua New Guinea Production Facilities 10 1 Production Lines 29 5 Warehouses 115 10 Employees 8,983 501 Number of Coolers (approx) 92,000 7,400 Stock Keeping Units (approx) 149 68")
16 INDONESIA AND PAPUA NEW GUINEA INDONESIA NARTD MARKET (27 litres per capita) Water CSD 9% Other RTD Tea KEY COMPETITORS Sosro >70% RTD Tea Share Pepsi < 4% CSD Share CCA S KEY FACTS (as at 30 June 2005) Indonesia Papua New Guinea Production Facilities 10 1 Production Lines 29 5 Warehouses Employees 8, Number of Coolers (approx) 92,000 7,400 Stock Keeping Units (approx) Number of Customers (approx) 410,000 6,400 FINANCIALS CAGR H Revenue ($ million) % Volume (million unit cases) % 52.5 Revenue per Unit Case ($) % 3.39 EBIT ($ million) % 11.3 EBIT margin (%) Capex to Revenue (%) CCA s Category Mix (UC) CCA s Package Mix (UC) CCA s Channel Mix (UC) 61% RTD Tea 12% 76% Syrup 0% Sports Water 0% 8% 21% 14% 4% 24% CSD 80% PET Cans RGB Other Modern Traditional These numbers have been prepared based on Australian Equivalents to International Financial Reporting Standards. 2. The 2004 A-GAAP comparatives were restated to include returnable containers as plant and equipment, therefore additions to returnable containers were included in capex for this and subsequent financial years. This change only effected CCA's South Korean and Indonesian operations. 3. Excludes significant items.

 More than 70% of sales in returnable glass")
 Ready-to-Drink Tea - 15% KEY FACTORS Frestea launched June 2002 and number 2 selling RTD")
17 Indonesia s Leading Beverage Brands CARBONATED SOFT DRINKS KEY FACTORS CCA s CSD Market Share 90% (approx.) Fanta - number 1 selling CSD brand, with 70% of volume being Strawberry CCA sells top three CSD brands (Fanta, Sprite and Coca-Cola) More than 70% of sales in returnable glass bottles Coca-Cola Fanta Sprite NON-CARBONATED BEVERAGES CCA s Market Share (approx.) Ready-to-Drink Tea - 15% KEY FACTORS Frestea launched June 2002 and number 2 selling RTD tea brand Frestea is the fastest growing RTD tea in Indonesia Frestea Frestea Wedge 15
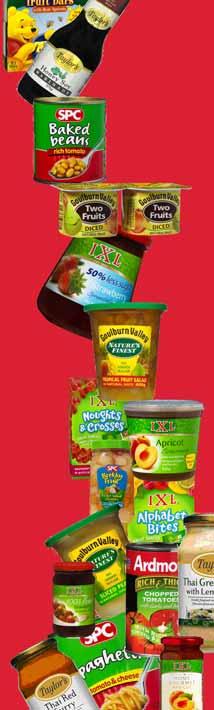
18 SPC ARDMONA SPC ARDMONA MARKET POSITION Rank Packaged Fruit 1 Henry Jones Spreads 1 Tinned Tomatoes 1 Baked Beans & Spaghetti 2 Source: AC Nielsen Scan Track. (Excludes food service) SPC ARDMONA KEY FACTS (as at 30 June 2005) Production Facilities 5 Production Lines 54 Warehouses 16 Employees 820 (rising to over 3,000 during the season) Domestic Stock Keeping Units (approx) 1,600 International Stock Keeping Units (approx) 1,050 FINANCIALS H Revenue from sales of food ($ million) EBIT ($ million) 17.2 EBIT margin (%) 12.1 Capex to Revenue (%) 2.9 SPCA s Category Mix ($) SPCA s Package Mix ($) SPCA s Channel Mix ($) 1 Other 17.7% 58.0% 50% Spreads 7.0% 2 BBSG Tomatoes 10.8% 11.2% 32.4% 10.3% 23% 8% 3.4% 12.2% 3.2% Fruit Snacks Canned Fruit 17.9% 35.4% Cans Plastic Glass Export Private Label Food Service Retail Branded Industrial Other Sauces and marinades, fruit sauces, bulk juices and purees. 2. Baked beans and spaghetti


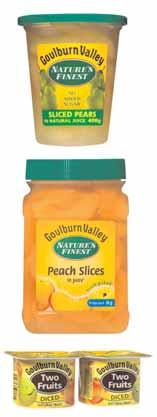
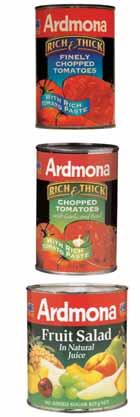
19 SPC Ardmona s Leading Brands SPC Ardmona Goulburn Valley IXL Taylors 17
20 FIVE-YEAR SUMMARY CAGR H Since 2000 Ongoing Business Beverage Sales Volume (unit cases) million % Revenue from Beverages & Food $ million 3, , , , , % 1,873.3 EBIT* $ million % EBIT Margin* 11.8% 11.4% 12.3% 14.0% 15.0% 14.3% Capital Spend to Revenue 5.4% 4.7% 2.8% 4.8% 5.5% 4.4% Return on Average Capital Employed* 7.3% 7.6% 8.8% 10.2% 11.3% 19.9% 1 Free Cash Flow * $ million CCA Reported Net Profit, before Significant Items - Ongoing Business $ million % Philippines $ million Net Profit, before Significant Items $ million Significant Items (net of tax) $ million (44.6) Net Profit - CCA Shareholders $ million Performance Ratios EBIT Interest Cover* times Net Debt to Book Equity 50.7% 62.6% 46.0% 54.1% % *before Significant Items 18
21 FIVE-YEAR SUMMARY CAGR H Since 2000 Balance Sheet Net Debt $ million 2, , , , , ,089.2 Equity $ million 4, , , , , ,272.4 Capital Employed - Ongoing Business $ million 4, , , , , , Philippines $ million 1, Total Capital Employed 6, , , , , ,361.6 Share Information Earnings per Share, before Significant Items 19.7c 25.3c 29.8c 34.3c 39.5c 19.0% 19.8c Earnings per Share 19.7c 56.2c 30.4c 27.9c 39.8c 19.2% 19.8c Dividends per Share 12.0c 14.0c 18.5c 23.0c c 23.6% 14.0c Dividend Payout Ratio 61.3% 47.4% 62.3% 67.3% 72% 72% Capital Return per Share c Post IFRS ROCE 2. The Philippines operation was sold effective 27 April 2001, resulting in cancellation of $1,773.1 million of contributed equity. 3. Free cash flow was down $48.2 million from last year due mainly to the seasonal influence of SPC Ardmona s first half operating cashflow. CCA beverages cash flow remained very strong at $137.8 million up $24.9 million from first half The 2003 final dividend of 13.0 cents per share is franked to 75% (up from 50% for the 2003 interim and 1999 to 2002 dividends). 19
22 SHAREHOLDER INFORMATION Registered Office Coca-Cola Amatil 71 Macquarie Street Sydney NSW 2000 Mr David Wylie Company Secretary Ph: (61) Investor Relations Coca-Cola Amatil Ms Kristina Devon Investor Relations Manager Ph: (02) Fax: (02) Share Registry Link Market Services Locked Bag A14 Sydney South NSW 1235 Ph: (02) Fax: (02) American Depository Receipts (ADR) The Bank of New York Investor Services PO Box 11258, Church Street Station New York NY USA Toll Free Ph: Int l Ph: (1 212) shareowners@bankofny.com 20 For more information about Coca-Cola Amatil please visit our website at
23 2006 Thursday 9 February 2005 Full Year Results Announcement Monday 20 February Ex-Dividend Date KEY DATES Friday 24 February Monday 3 April Wednesday 3 May Thursday 10 August Monday 21 August Friday 25 August Monday 2 October Record Date for Dividend Entitlements Final 2005 Ordinary Dividend Paid 2006 Annual General Meeting 2006 Half Year Results Announcement Ex-Dividend Date Record Date for Dividend Entitlements 2006 Interim Ordinary Dividend Paid
24 Coca-Cola Amatil Limited A.B.N COCA-COLA, DIET COKE, COCA-COLA LIGHT, FANTA, SPRITE, SPRITE ZERO, FRUITOPIA, MINUTE MAID, FRESTEA, PUMP, POWERADE, SOONSOO 100, e2, KERI, LIFT PLUS AND NESTEA ARE REGISTERED TRADE MARKS OF THE COCA-COLA COMPANY. Produced by M.D.P. Milward Desktop Publishing Ph: (02)