Environmental Economics Lecture on topics in valuation of environmental goods. Jon Strand February 15, 2017
|
|
|
- Randolf West
- 5 years ago
- Views:
Transcription
1 Environmental Economics Lecture on topics in valuation of environmental goods Jon Strand February 15, 2017
2 Types of methods for environmental valuation Explicit methods: Values are found from those individuals who are affected by the environment, and by environmental changes Implicit methods: Values are found from experts, policy makers, or others who represent those individuals Direct methods: Asking individuals (and experts) about the respective values (also called Stated-Preference methods) Indirect methods: Inferring environmental values from observations of economic behavior (by individuals and policy makers).
3 Overview of methods for environmental valuation: Method type Direct methods Indirect methods Explicit methods Contingent valuation Referenda Choice experiments, simulated markets Household production methods (travel costs, averting behavior, etc.) Hedonic price methods (property prices, hedonic Implicit methods Expert panel methods Expert opinion Opinion of political representatives wages) Implicit valuation from political processes
4 Main motivations for valuing the environment Use value: The value an individual s use of the environmental and resource object, and the change in such value when object characteristics change. This value category corresponds most directly ordinary market goods. Option value: The value attached to the option or possibility of using the good, even if one currently does not use it. Non-use (or passive-use) value: Derived from other motivations than one s own (current or future) use of the good.
5 Types of non-use value Existence value, i.e. the value to the individual, from simply knowing that the good is presently available and/or of a particular quality. Preservation value, i.e. value associated with the good being preserved for the future, for the enjoyment of future generations. Altruistic motivations, implying that individuals attach value to others use (or valuation) of the good.
6 Types of altruistic motivations Altruism exhibited toward ones near family Altruism exhibited toward other (more anonymous) persons today Altruism exhibited toward future, perhaps not yet born, generations (and thus also anonymous persons) Altruism exhibited toward other objects (including animals) Altruism, can be either paternalistic, which implies that it is other individuals use of the environmental good that is valued by the altruistic individual, or nonpaternalistic (often also called pure ), where one incorporates others utilities in ones own utility function. It turns out that only paternalistic altruism has practical consequences, in terms of increasing the value of the good.
7 How much does altruism matter? Relationships between preferred public projects for mortality reduction, in terms of type of life saved, and payment according to different motivations, as averages across respondents. Million USD per VSL. (Based on a choice experiment in 1995.) Death cause Heart disease (612 respondents) Environmental causes (162 respondents) Traffic accidents (221 respondents) Total average (995 respondents) Concern for own Life Concern for other family members Other altruistic concerns Total 1.6 (31 %) 2.8 (54 %) 0.8 (14 %) (30 %) 3.4 (37 %) 3.0 (33 %) (26 %) 4.7 (62 %) 0.9 (12 %) (29 %) 3.1 (53 %) 1.0 (18 %) 6.0
8 Willingness to pay, or willingness to accept? Consider environmental improvements, and how to value these. Consider two alternatives: Willingness to pay (WTP): What is your maximum willingness to pay to obtain this environmental improvement? Willingness to accept (WTA): What is the minimum compensation you will need, to forsake this environmental improvement? Usually, WTP will be used as the measure of welfare in SP studies. What is correct may however depend on property rights situation.
9 Methods of payment with CVM a) Sequence of questions: Not advised. Can lead to various biases, including starting-point bias. b) Payment card which indicates possible values. Respondents often drawn to middle of card. c) Open-ended question: Turns out to often give low degree of precision Advice today: Requested payment should be part of a referendum situation. a)-c) are often not. d) Closed-ended single-bounded question (Do you want to pay X, or do you not, given that everyone else pays this amount or share of income?): Considered incentive compatible. (X varied among respondents.) e) Closed-ended double-bounded: First question followed up with a question about maximum WTP. Can provide additional information
10 Possible/common «payment vehicles» a) Sum of money to be paid: Often unrealistic in terms of actual collection. Also problem in terms of incentive compatibility. b) Additional income tax: Question how realistic this is. But usually better than a) in terms of incentive compatibility. c) Fee, tax or charge on particular goods: This has sometimes turned out to work well, if the additional tax is considered realistic to implement and enforce. Also, depends on how widespread is the use of the taxed good.
11 Truthful or inaccurate answering in stated-preference surveys: Is this a problem? A common objection against CVM has been that answers can easily be exaggerated by respondents, since there is no duty to actually pay. Incentives can however depend on circumstances (discussed on the next slide). Another problem with CDM can be lack of familiarity with the good to be valued and the process by which it is valued. Most people are not used to paying for environmental goods.
12 Incentives for truthful or not truthful answering in statedpreference surveys Type of payment mechanism Actual payment by interviewee independent of expressed bid Actual payment depends positively on expressed bid Provision of environmental good indpenendent of bid Indifferent. Perhaps overstatement if interviewee attaches some probability that the interview will be used Understatement Provision of environmental good depends positively on bid Overstatement Depends: Possibly incentive compatible
13 Some common problems or issues with CDM WTP versus WTA: In many empirical applications the latter is often (much) larger than the former. This may be related to «moral» or «positional goods»: what you have is viewed as more valuable. Insensitivity to scope: In many applications of CDM, an increase in «scope» of an environmental good (how much of the good you get; how many animals are saved; etc.) does not lead to an equivalent increase in WTP. Tests for sensitivity to scope have been developed, but these are often (in my view) too weak.
14 Contingent valuation (CV) versus choice experiments (CE) as stated preference method The lack of a direct valuation questions in CE: both a strength and a weakness, relative to CV. A weakness of CE relative to CVM is just that it is less direct. When people have a good sense of the value of a particular environmental good, it can be better to ask them directly to state this value, instead of asking in a roundabout way which happens with CE. CE also puts cognitive strains on respondents, by requiring more complex comparisons and trade-offs.
15 Contingent valuation (CV) versus choice experiments (CE) as stated preference method (cont.) CE can sometimes reduce WTP/WTA differences, and sensitivity to scope. A strength of CE relative to CV is that people often have trouble attaching direct monetary values to environmental goods. It may be easier to choose between attribute combinations. The choice situations constructed in CE studies often correspond more closely to real-life choices and thus perhaps be more familiar. In contrast, the scenarios described in CV studies are often unfamiliar, and sometimes unrealistic. Easier/cheaper to collect more data points with CE, as each respondent can be faced with a sequence of choices each of which can be treated as an observation.
16 Example of CE survey mechanism The following table shows a CE with three choices and three attributes : payment; environmental quality; and bus comfort. Ranking the combinations can tell much about the values of env quality and comfort. In many cases there will be only two choices, but each person faced with a sequence of choices. The choices will reveal the relative value of other attributes, in terms of price/cost. Choice number Bus ticket price Envir. quality along route Other attribute 1 10 Bad No seat 2 20 Good Seat 3 15 Good No seat
17 Estimation of WTP on the basis of CE answers The value of a combination of (cost and other) attributes would usually be specified as follows (for respondent i, choice j): V ij = β 1 Cost ij + β 2 Env ij + β 3 Seat ij + ε ij where εij = a random term (with specified distribution) -β2/β1 = marginal WTP for improved environment -β3/β1 = (marginal) WTP for seat. The respondent is then assumed to prefer the choice which gives the highest utility among the alternatives.
18 «Surrogate methods» for environmental valuation What do you do when you don t have value estimates for an environmental good, at a particular site, or in a particular country? Two («surrogate») tools can then be useful: 1. Meta-analysis, which represents a systematic summary of available studies, for the same or similar good, from «elsewhere». Benefit transfer, which means that we use valuation from «elsewhere» to predict value at a particular site where it is needed. Often, meta-analysis can be useful for transferring benefits. See otherwise my lecture notes.
19 Two important examples of environmental goods and their valuation, discussed in this lecture 1. Protection of the Amazon rainforest: A canonical example of a global public good, with important regional aspects. 2. The Norwegian Master Plan for Water Resources ( Samlet plan for vassdrag ). This represented the largest natural resource management plan in Norwegian history.
20 Values of the Amazon rainforest include Local and regional values Global values: Carbon sequestration Other global climate impacts Biodiversity and biological resources
21 World Bank project has attempted to deal with both global and regional aspects of protection value for the Amazon The Delphi paper, discussed below, deals with an expert survey, of more than 200 environmental valuation experts globally, who predict Amazon preservation values for their own countries. There is also a larger regional project for valuing the Amazon, where results can be accessed on two websites. I will say less about the latter. This project will be presented at a separate lecture later in the course, when there will be more discussion of rainforest protection.
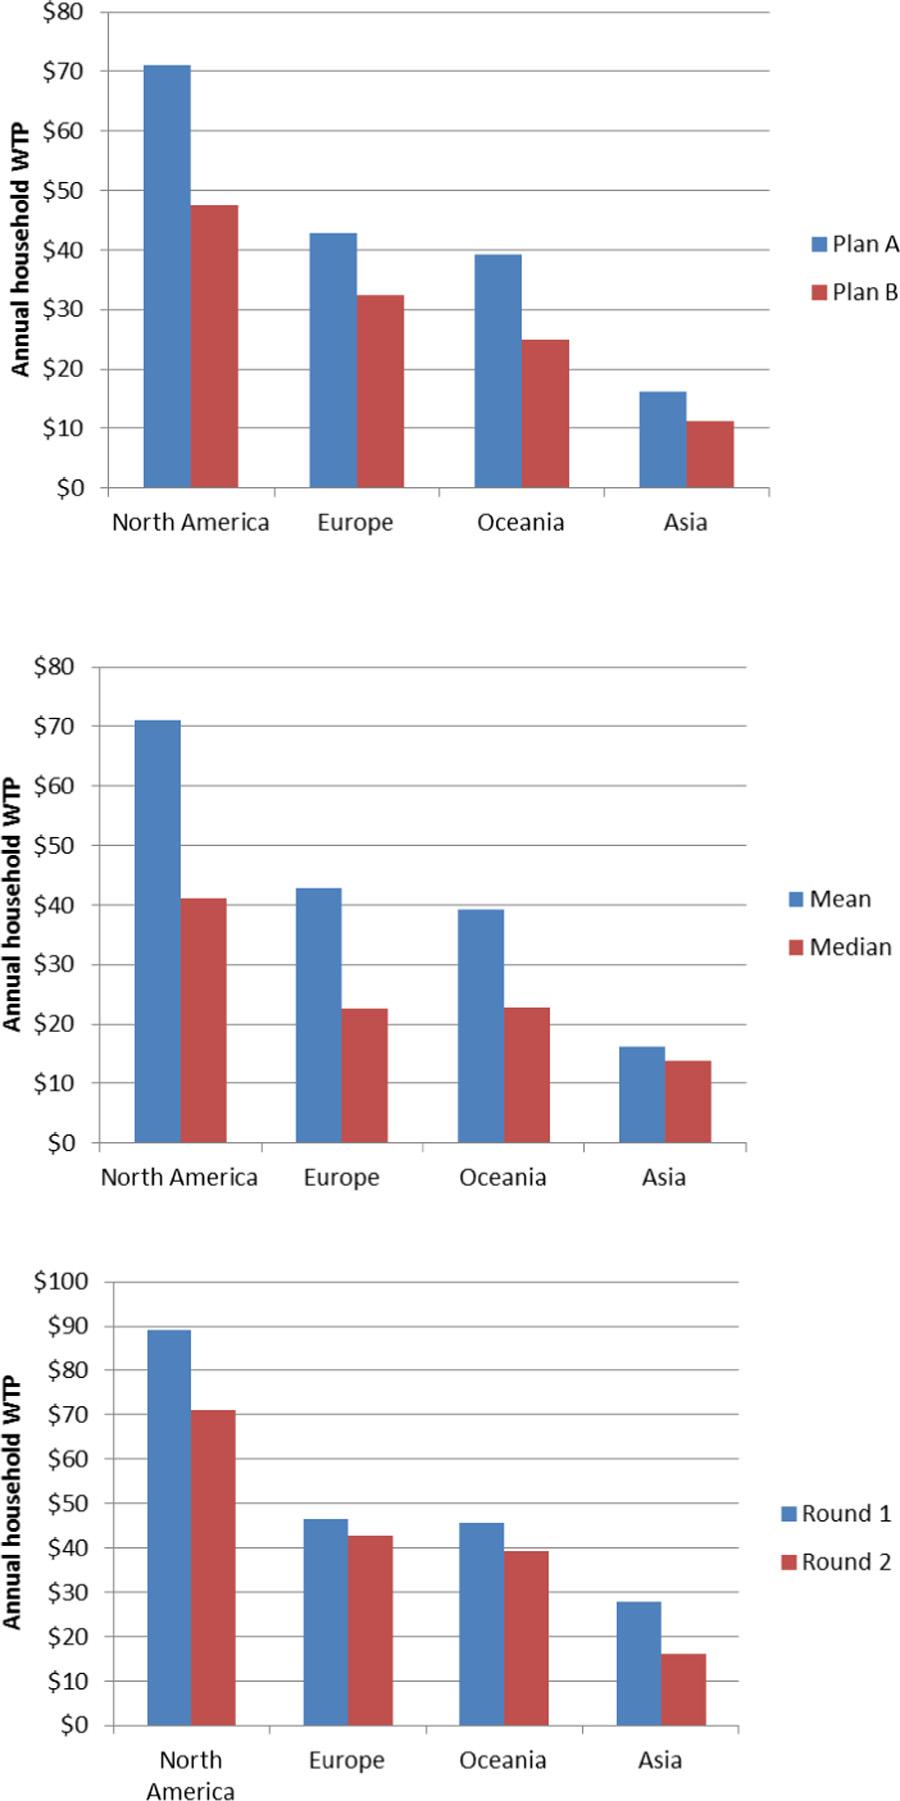
22 Delphi paper: Experts try to predict answers to a CVM survey in their own country, for protecting the Amazon 216 experts from 37 countries, in North America, Europe, Oceanaia and Asia were involved. Countries include all income classes. Each expert is asked: What do you think would be the outcome in your own country of a CVM survey for WTP to avoid deforestation in the Amazon, in terms of average/median WTP among households in your country? Was done in two rounds, and for two different plans: After round 1, average answers are given to experts, who could then adjust their initial answers. Typically, adjustments are in the direction of averages. This study is an example of expert valuation.
23 Delphi survey for protecting the Amazon (cont.) Status quo (business-as-usual) situation: 30% of Amazon lost by About 20% of species of mammals, birds and amphibians also lost or highly engangered. Plan A: No loss of rainforest or species by Plan B: 12% of rainforest lost, 10% of species lost or highly endangered. We here show results only for Plan A, in Round 2.
24 Average WTP figures for Plan A, Round 2, by region (Predicted WTP per household per year)
25
26 Some key results from the Delphi survey: Predicted WTP was almost exactly proportional to per-capita PPP adjusted GDP. If this corresponds to true WTP, global WTP can be found simply by scaling up values by global GDP. One key objective of a Delphi survey is to attempt to seek consensus among experts, who were allowed to adjust their valuations between rounds 1 and 2. About half of experts adjusted their answers from round 1 to round 2, with more adjusting downwards, and by more. WTP predictions for (the less ambitious) plan B were lower than for plan A, as seen on the previous slide.
27 Norwegian Master Plan for Water Resources (MP) Much of Norway s hydroelectric resources have already been built out. The remaining rivers were in the 1980s subject to a ranking procedure, in terms of suitability for additional hydropower development (low ranking) or protection (high ranking). A number of attributes related to each river were given scores 1 to 4, where 4 indicated most impact. The ranking of rivers was done on the basis of the scores given to the attributes, and the economic value of the hydro project. A final ranking was done by the Norwegian Parliament (Stortinget), where Parliament members could change ranking of particular rivers.
28 Norwegian Master Plan for Water Resources (cont.) The rankings implicitly traded off the economic costs of developing potential hydropower projects, against the environmental and other impacts of developing the projects, represented by the scores given to each attribute for each project. These trade-offs were calculated by us in the article announced for the lecture. This is an example of implicit and indirect valuation: Where policy makers and bureaucrats, through their decisions (here, their ranking of water courses not yet developed), reveal their weights given to the various attributes or aspects. These weights are calculated in terms of US cents (or NOK) per kwh.
29 Norwegian Master Plan for Water Resources (cont.) The decision makers total economic costs per unit of electricity capacity: TC / P C / P E / P q ( P) q ( R) Priority of project i can be specified as a function of indexes D Rj and D kj in addition to project size P and unit cost C/P: 0 P R Pr( i) b b P( i) b ( C / P)( i) b D ( i) b D ( i) e( i) P C Rj Rj kj kj j 1 k 1 j 1
30 Norwegian Master Plan for Water Resources (cont.) The ratio -b kj /b C can be interpreted as a cost associated with user interest k taking the value k = -1 to -4 (the last being the worst possible negative impact). We can then also calculate total net cost for each project by summing the values ascribed to each attribute score for the project. We then find that total implicit cost (net of hydropower productivity) is nicely upward sloping. We however found that the noise in this process increased by the final political process (politicians moved project up and down the scale). These calculations represent an illustration of the principle that political decisions with environmental consequences imply that the environment is valued (or, given a maximum or minimum value).
31
32
33 Some important results from our analysis of the MP There seemed to be a high degree of rationality in the ranking process, as the attribute-score combinations overall produced a high explanatory power in explaining the rankings. The scores -4 overall had by far the greatest explanatory power for rankings, as ought to be the case. The final political process, by which the ranking was finally approved by the Norwegian Parliament, led to some changes in the final ranking of projects. This change in ranking introduced noise into the system, as the overall explanatory power of attributes fell. (This indicated that politicians moved project rankings not mainly based on rational criteria, but more based on pure political preferences.)