Consumer Analyst Group of New York Conference. February 23, 2018
|
|
|
- Caren Fields
- 5 years ago
- Views:
Transcription


1 Consumer Analyst Group of New York Conference February 23, 2018
2 February 2018 Notice for Investor Presentation Our presentation and the related webcast contain non-gaap financial measures, which differ from our reported results prepared in accordance with U.S. generally accepted accounting principles (GAAP). These non-gaap financial measures of operating results, such as gross profit margin and operating profit, exclude items that, either by their nature or amount, management would not expect to occur as part of the Company s normal business on a regular basis, such as restructuring charges, charges for certain litigation and tax matters, gains and losses from certain divestitures and certain unusual, non-recurring items. We may also refer to organic sales growth, which is Net sales growth excluding the impact of foreign exchange, acquisitions and divestments, or to free cash flow before dividends, which we define as Net cash provided by operations less Capital expenditures. A complete, quantitative reconciliation between our reported results and these non-gaap financial measures is available in the Investor Center section of our website at Our presentation and the related webcast are integrally related and are intended to be presented and understood together. In addition, they may contain forward-looking statements (as that term is defined in the U.S. Private Securities Litigation Reform Act of 1995 or by the Securities and Exchange Commission (the SEC) in its rules, regulations and releases) that set forth anticipated results based on management s current plans and assumptions. These statements are made on the basis of our views and assumptions as of this time and we undertake no obligation to update these statements whether as a result of new information, future events or otherwise, except as required by law or by the rules and regulations of the SEC. Moreover, we do not, nor does any other person, assume responsibility for the accuracy and completeness of those statements. We caution investors that forward-looking statements are not guarantees of future performance and that actual events or results may differ materially from those statements. For information about factors that could impact the Company s business and cause actual results to differ materially from forward-looking statements, refer to the Company s filings with the SEC (including, but not limited to, the information set forth under the captions Risk Factors and Cautionary Statement on Forward-Looking Statement in the Company s Annual Report on Form 10-K for the year ended December 31, 2016 and subsequent Quarterly Reports on Form 10-Q). Copies of these filings are available in the Investor Center section of our website at or may be obtained by request from the Company s Investor Relations Department.
3 Today Our Focused Strategy


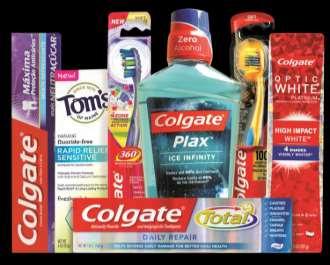


4 Home Care Pet Nutrition Oral Care Personal Care
5 The Market Environment 2017 A difficult year
6 The Market Environment 2018 Improving, but still challenging
7 Our Priorities Driving Organic Sales Growth Maximizing Productivity across the P&L Growing Cash Flow and Increasing Returns Leading to Win
8 Our Priorities Driving Organic Sales Growth Maximizing Productivity across the P&L Growing Cash Flow and Increasing Returns Leading to Win
9 Driving Organic Sales Growth Growing market share through superior marketing and brand engagement Innovating across the business Maximizing growth in e-commerce Working with our retail partners for profitable growth Investing to drive penetration in growing populations

10 Driving Organic Sales Growth Growing market share through superior marketing and brand engagement Innovating across the business Maximizing growth in e-commerce Working with our retail partners for profitable growth Investing to drive penetration in growing populations

11 With Me Today Julie Dillon Vice President and General Manager South Pacific Hub
12 Global Journey Sydney
13 Global Journey New York Sydney
14 Global Journey New York Geneva Sydney
15 Global Journey New York Geneva Rome Sydney
16 Global Journey New York London Geneva Rome Sydney
17 Global Journey New York London Geneva Rome Sydney
18 Global Journey New York London Geneva Rome Sydney

19 Build Purpose-Driven Brands that Enrich the Lives of People, and Drive Growth for Colgate BRAND SUMMIT 2017
20 The Purpose of Purpose Give people not just something to buy, but something to buy into
21 Impactful brand experiences Meaningful brands drive growth Innovation To deliver short- and long-term growth


22

23 Australia


24 Equity Advertising Is More Effective And Efficient $5.00 $4.50 $ X more efficient 4X more Volume Short-Term Long Term Component $3.50 $3.00 $2.50 $2.00 $1.50 $1.00 $0.50 $0.00 C-P TV ROI C-P Equity ROI Market Mix Modeling, Analytic Partners, 2017` C-P TV Lift C-P Equity Lift

25 Gives people solutions for their lives Wisdom Teeth Tooth Whitening How to Brush


26 Gives people solutions for their lives Mobile Colgate content on 1 st page of results for >40K oral health search terms Same number of searches as WebMD


27 Europe Meaningful Innovation Russia India Naturals Positioning

28 Meaningful Innovation Whitening


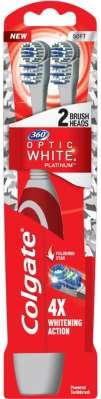
29 Meaningful Innovation Artificial Intelligence Powered Toothbrush
30 Improved Brushing Habits Users brushing longer and more frequently Average surface coverage increased by 27%* Awareness of missed areas **after brushing for 4 weeks


31 IT S OUR DUTY TO GIVE EVERY ANIMAL THE BEST CARE HUMANLY POSSIBLE

32 Meaningful Innovation Cats with chronic kidney disease have a suppressed appetite Hill's Prescription Diet k/d with E.A.T. Technology Prescription Diet k/d food is formulated with breakthrough appetite technology targeted specifically at cats with kidney disease"


33 Keeps Skin Healthy


34 Meaningful Innovation Sanex Zero% Relaunch New: Anti-Pollution BW New: Compressed UAP

35 Effective and Impactful Advertising
36 Delivering on Advertising Commitment Increased advertising spend and consistency Digital: 25% of global media spend
37 Driving Organic Sales Growth Growing market share through superior marketing and brand engagement Innovating across the business Maximizing growth in e-commerce Working with our retail partners for profitable growth Investing to drive penetration in growing populations
38 e-commerce Sales Have nearly tripled since 2014 U.S e-commerce sales doubled in 2017 alone
39 Winning in Key Markets #1 Market Share in Toothpaste U.S. Pure Play and omnichannel Source: 10/10


40 U.S. Designed and developed specifically for e-commerce
41 Winning in Key Markets #1 Market Share in Toothpaste U.S. Pure Play and omnichannel China Social/e-Commerce integrated marketplace Source: 10/10, Nielsen

42 China Heart shape strip Transparent tube Express Yourself. Dare to Love. Personal comments


43 Dare to Love Personalized Pack Type personalized message on the card Record voice message on QR code Gift recipient listens to the voice message by scanning QR code
44 Dare to Love Performance Update #1 selling SKU in the Colgate store for this e-tailer on 11/11 Helping to drive our total sales up 55% for this important event
45 Winning in Key Markets #1 Market Share in Toothpaste U.S. Pure Play and omnichannel China Social/e-Commerce integrated marketplace UK Brick and Mortar e-commerce sites Source: 10/10, Nielsen, Kantar

46 U.K. 123 Smile health partnership with Tesco Educate shoppers on the importance of regimen Delivered highest Colgate market share in Tesco online in 2017

47 Hill s Hill s Global e-commerce Net Sales >+300%* Hill s U.S. Subscription >50% *2017 vs PurePlay e-commerce only


48 Hill s On site search Digital advertising

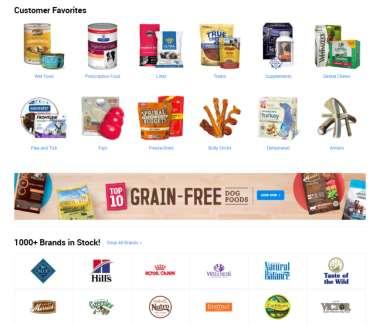
49 Hill s Increased home page placements


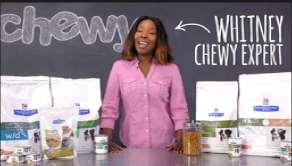
50 In Chewy TV Commercials Hill s
51 Hill s Therapeutic Share e-commerce share pts
52 Driving Organic Sales Growth Growing market share through superior marketing and brand engagement Innovating across the business Maximizing growth in e-commerce Working with our retail partners for profitable growth Investing to drive penetration in growing populations
53 Profitable Growth Customer engagement Pricing Revenue Growth Management
54 Profitable Growth Customer engagement Pricing Revenue Growth Management
55 Increased Customer Engagement Customers are seeking partners to help them profitably grow their businesses Investment in their strategies and shoppers Insight-based actions Innovation Increasingly important to engage all levels of customer management collaboratively

56 Customer Engagement Center High-tech, collaborative environment

57 Customer Engagement Center Joint business planning Share merchandising/ marketing expertise Virtual store capabilities
58 Profitable Growth Customer engagement Pricing Revenue Growth Management
59 Pricing Planning for pricing to increase in 2018 Consistent with our long-term commitment to pricing
60 Commitment to Pricing 8.0% 6.0% 5.4% 6.0% 4.0% 2.0% 0.0% 3.1% 3.1% 2.4% 1.9% 1.5% 1.2% 1.3% 0.8% 0.5% 0.5% 0.0% '05 '06 '07 '08 '09 '10 '11 '12 '13 '14 '15 '16 '17
61 Pricing Planning for pricing to increase in 2018 Consistent with our our long-term commitment to pricing Aided by return to volume growth in developed markets Inflation in emerging markets provides support Raw materials inflation historically leads to pricing
62 Profitable Growth Customer engagement Pricing Revenue Growth Management
63 Revenue Growth Management More than just about pricing Driving improved profitability for ourselves and our retail partners Closing price gap versus the category Build brand equity Drive premium innovation Tiering our base business
64 Tiering Our Base Business Example: South Africa Re-launched two entry-level products: Herbal and Maximum Cavity Protection To differentiate and separate our offerings within this end of our portfolio Called out new ingredients on the pack Slightly increased prices Created a new mid-tier price point
65 C-P South Africa Toothpaste Base Business 1H 2015
66 Created New Mid-Tier Price Point 1H 2015 Base
67 Created New Mid-Tier Price Point 1H H 2015 Base
68 Created New Mid-Tier Price Point 1H H 2015 Mid-Tier Base Base
69 Created New Mid-Tier Price Point 1H H H 2017 Mid-Tier Base Base
70 Created New Mid-Tier Price Point 1H H H 2017 Base Mid-Tier Base Mid-Tier Base
71 Tiering Our Base Business Example: South Africa Results Double-digit, profitable net sales growth for South Africa in 2017 South Africa reached its highest toothpaste market share in a decade Base: > than 65% in 2015 to < 20% in 2017 Mid-Tier: From 0% in 2015 to >55% in 2017
72 Driving Organic Sales Growth Growing market share through superior marketing and brand engagement Innovating across the business Maximizing growth in e-commerce Working with our retail partners for profitable growth Investing to drive penetration in growing populations

73 Significant Population Growth Emerging Markets Developed Markets 8.4B by 2030 With 7.6B in Emerging Markets 0.0 Source: Euromonitor % of population growth from Emerging Markets

74 Emerging Middle Class EUROPE 664 NORTH AMERICA MIDDLE EAST & NORTH AFRICA 1.8 billion CENTRAL & SOUTH AMERICA Middle Class population SUB-SAHARAN AFRICA ASIA-PACIFIC Source: OECD
75 Emerging Middle Class EUROPE NORTH AMERICA billion CENTRAL & SOUTH AMERICA MIDDLE EAST & NORTH AFRICA Middle Class population SUB-SAHARAN AFRICA Middle Class population ASIA-PACIFIC 4.9 billion Source: OECD
76 Toothpaste Growth Opportunity Significant consumption growth potential
77 Toothpaste Growth Opportunity Less than 1x per day Between 1x 2x per day Colgate Share *Markets where we do business Grams


78 Toothpaste Growth Opportunity Less than 1x per day Between 1x 2x per day Colgate Share 68% of population* 32% of population* *Markets where we do business Grams

79 Bright Smiles, Bright Futures Worldwide Community Health Initiative Provides children world-wide with free dental screenings and oral health education 900MM kids reached to date Goal: 1.3 billion kids by 2020

80 BSBF Investment Drives Growth Relative ROI 318% 100% 121% Media Professional BSBF Brazil, Mexico, Malaysia and Thailand ( )
81 Availability and Affordability
82 Our Priorities Driving Organic Sales Growth Maximizing Productivity across the P&L Growing Cash Flow and Increasing Returns Leading to Win
83 Maximizing Productivity Across the P&L Global Growth and Efficiency Program Funding the Growth
84 Maximizing Productivity Across the P&L Global Growth and Efficiency Program Funding the Growth
85 Global Growth and Efficiency Program Focus Areas Expand commercial hubs Extend shared business services and streamline global functions Optimize Global Supply Chain and Facilities
86 Global Growth and Efficiency Program Savings are projected to be in the range of $ MM after-tax, once all projects are approved and implemented Rate of return greater than 30% Payback averaging 3 4 years
87 Global Growth and Efficiency With Hubs and Colgate Business Services (CBS) in place, now a platform to help us drive growth
88 Platform to Drive Global Growth Analytics/Insights
89 Platform to Drive Global Growth Analytics/Insights out of Colgate Business Services (CBS) Mumbai
90 Analytics CBS Mumbai Driving Cost Savings, Speed, Agility Cost-effective access to top analytic talent Lower cost compared to external partners Direct access to data on Colgate systems Ability to leverage co-located IT solutions seamlessly
91 Platform to Drive Global Growth Analytics/Insights SKU productivity
92 Platform to Drive Global Growth SKU productivity Grow the Head, Cut the Tail
93 Portfolio SKU Productivity (Hypothetical Case ) Rate of Sales M/WD point per month Head SKUs: Higher Productivity 0.3 Tail SKUs: Lower Productivity % Weighted Distribution
94 Portfolio SKU Productivity Rate of Sales M/WD point per month Grow the Head % Weighted Distribution
95 Portfolio SKU Productivity Rate of Sales M/WD point per month Grow the Head 24 SKUs 60% of sales Average 85% distribution % Weighted Distribution
96 Portfolio SKU Productivity Rate of Sales M/WD point per month Grow the Head Product AA % Weighted Distribution
97 Portfolio SKU Productivity Rate of Sales M/WD point per month Grow the Head Product AA Target 65% % Weighted Distribution
98 Portfolio SKU Productivity Rate of Sales M/WD point per month Grow the Head +10% distribution % Weighted Distribution
99 Portfolio SKU Productivity Rate of Sales M/WD point per month Grow the Head +10% distribution % Weighted Distribution
100 Portfolio SKU Productivity Rate of Sales M/WD point per month Grow the Head Improve promotions and support % Weighted Distribution

101 Portfolio SKU Productivity Rate of Sales M/WD point per month Grow the Head Improve promotions and support % Weighted Distribution
102 Portfolio SKU Productivity Rate of Sales M/WD point per month Starve the Tail Cut unproductive SKUs Tail SKUs: 0.2 Lower Productivity % Weighted Distribution
103 Portfolio SKU Productivity Rate of Sales M/WD point per month Starve the Tail Cut unproductive SKUs % Weighted Distribution
104 Europe Q4 Net Sales $608.8MM Organic Sales Growth +4.0% SKU % change -8.0% Sales/SKU % change +22.5%
105 Platform to Drive Global Growth Analytics/Insights SKU productivity Faster speed to market
106 Platform to Drive Global Growth Hubs allowing faster speed to market


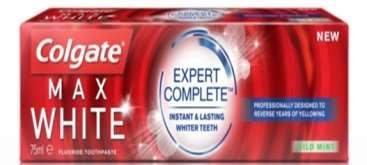
107 Faster Speed to Market in Europe Roll-out of Colgate Max White Expert Complete across all 6 hubs in 6 months

108 Maximizing Productivity Across the P&L Global Growth and Efficiency Program Funding the Growth
109 Funding the Growth Overview Key component of Colgate s financial strategy Sustained global process with systematic tracking of savings initiatives Generates funds to reinvest in the business for growth Deeply ingrained way of working that gives Colgate a competitive advantage

110 Funding the Growth Excl. Venezuela
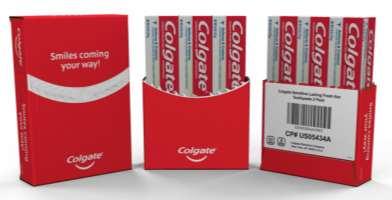
111 Funding the Growth: Digitized Procurement Total spend globally of POS and Co-packing materials >$300MM
112 Funding the Growth: Digitized Procurement Company-wide project to digitize procurement Global Catalog Development workflow Library of executions Creation of a standardization and workflow tool for POS/co-packing management
113 Funding the Growth: Digitized Procurement Standardization leads to greater efficiencies Consistency of imagery improves brand-building

114 Funding the Growth: Digitized Procurement
115 Our Priorities Driving Organic Sales Growth Maximizing Productivity across the P&L Growing Cash Flow and Increasing Returns Leading to Win
116 Growing Cash Flow and Increasing Returns Capital Expenditure for Growth

117 Capital Expenditure % to Sales 5% 4.4% 4.3% 3.2% 3.3% 3.8% 3.9% 3.6% 0% , exclude restructuring charges and/or other items
118 Cost-Saving Capital Spending ($MM) Cash Capital Spending % of Savings Projects $583 $684 $575 $550 $537 $565 $670 $757 $691 $593 $553 62% 63% 69% 64% 50% 49% 53% 58% 61% 51% 50%
119 Cost-Saving Capital Spending ($MM) Cash Capital Spending % of Savings Projects After-Tax IRR $583 $684 $575 $550 $537 $565 $670 $757 $691 $593 $553 62% 63% 69% 64% 50% 49% 53% 58% 61% 51% 50% 40% 40% 58% 63% 69% 56% 71% 70% 52% 45% 64%
120 Growing Cash Flow and Increasing Returns Capital Expenditure for Growth Mergers and Acquisitions GABA (2004) Tom s of Maine (2006) Sanex (2011)
121 GABA Market Share Nielsen: Includes TP, MTB and MW '06 '07 '08 '09 '10 '11 '12 '13 '14 '15 '16 '17
122 Tom s Toothpaste Market Share '11 '12 '13 '14 '15 '16 '17 Nielsen Total U.S. All Outlets XAOC
123 Sanex Market Shares Bodywash Underarm Protection Nielsen EU, Sanex Countries


124

125
126 Growing Cash Flow and Increasing Returns Capital Expenditure for Growth Mergers and Acquisitions Dividends

127 Dividends Paid $1.60 $1.40 $1.20 Per Common Share Increased for 55 consecutive years $1.14 $1.22 $1.33 $1.42 $1.50 $1.55 $1.59 $1.00 $1.02 $0.86 $0.80 $0.60 $0.45 $0.48 $0.56 $0.63 $0.70 $0.78 $0.40 $0.20 $0.24 $0.27 $0.28 $0.30 $0.32 $0.34 $0.36 $0.00 '96 '97 '98 '99 '00 '01 '02 '03 '04 '05 '06 '07 '08 '09 '10 '11 '12 '13 '14 '15 '16 '17 Amounts adjusted for two-for-one stock split in 1997, 1999 and 2013
128 Growing Cash Flow and Increasing Returns Capital Expenditure for Growth Mergers and Acquisitions Dividends Shareholder Return
129 Total Return 20 Years 12/31/97 12/29/ % +301% +309% S&P Peer Group Colgate
130 Total Return 10 Years 12/31/07 12/29/ % +125% +145% S&P Peer Group Colgate S&P Peer Group Colgate

131 Total Return 5 Years +108% 12/31/12 12/29/17 +81% +61% S&P Peer Group Colgate S&P Peer Group Colgate
132 Total Return % +14.8% +17.9% S&P Peer Group Colgate S&P Peer Group Colgate
133 Our Priorities Driving Organic Sales Growth Maximizing Productivity across the P&L Growing Cash Flow and Increasing Returns Leading to Win
134 Colgate Values Caring Global Teamwork Continuous Improvement


135 Colgate s Sustainability Commitments People Performance Planet Helping Colgate People and Their Families Live Better Contributing to the Communities Where We Live and Work Brands that Delight Consumers and Sustain Our World Making Every Drop of Water Count Reducing Our Impact on Climate and the Environment
136 Consumers Care 72% of Generation Z is willing to pay more for brands that are committed to positive social and environmental impact 59% of Millennials are willing to pay more for a brand that portrays the right self-image

137 CDP A List WATER Only U.S. Company to score A on both Water and Climate
138 Making Every Drop of Water Count 2020 Goal Promote water conservation awareness to all of our global consumers

139 MICHAEL PHELPS

140 2018 Plans Save Water activation to change people s behavior

141
142 Join Us! By taking a SIMPLE step to turn off the faucet while brushing we can have a BIG impact
143 Our Priorities Driving Organic Sales Growth Maximizing Productivity across the P&L Growing Cash Flow and Increasing Returns Leading to Win

144