Hindustan Unilever Limited
|
|
|
- Donald Peters
- 5 years ago
- Views:
Transcription

1 Hindustan Unilever Limited Investor Presentation UBS Securities India Conference Srini Srinivasan VP treasury M&A and Investor Relations Hindustan Unilever Ltd. 2nd November, 2007
2 Safe harbour statement This Release / Communication, except for the historical information, may contain statements, including the words or phrases such as expects, anticipates, intends, will, would, undertakes, aims, estimates, contemplates, seeks to, objective, goal, projects, should and similar expressions or variations of these expressions or negatives of these terms indicating future performance or results, financial or otherwise, which are forward looking statements. These forward looking statements are based on certain expectations, assumptions, anticipated developments and other factors which are not limited to, risk and uncertainties regarding fluctuations in earnings, market growth, intense competition and the pricing environment in the market, consumption level, ability to maintain and manage key customer relationship and supply chain sources and those factors which may affect our ability to implement business strategies successfully, namely changes in regulatory environments, political instability, change in international oil prices and input costs and new or changed priorities of the trade. The Company, therefore, cannot guarantee that the forward looking statements made herein shall be realized. The Company, based on changes as stated above, may alter, amend, modify or make necessary corrective changes in any manner to any such forward looking statement contained herein or make written or oral forward looking statements as may be required from time to time on the basis of subsequent developments and events. The Company does not undertake any obligation to update forward looking statements that may be made from time to time by or on behalf of the Company to reflect the events or circumstances after the date hereof. 2
3 Agenda Overview India Opportunity HUL - Uniquely Placed Financials Strategy and Markets 3
4 Agenda Overview India Opportunity HUL - Uniquely Placed Financials Strategy and Markets 4
5 HUL - India s largest FMCG company ~ 15,000 employees ~ 1,200 managers ~ 2,000 suppliers & associates ~ 75 Manufacturing Locations ~ 45 C&FAs, 4,000 Stockists Population 1027 Mln 5,545 Towns 2.5 Mln outlets 6,38,000 Villages 5.0 Mln outlets * Source: (1) Statistics on India, Total Coverage : AC Nielsen, Census of India 2001 (2) Statistics on Market reach : MRUC, Hansa Research - Guide to Indian Markets
 377 Reported Profit 455 EPS 21c Operating Cash Flow 365 Market Capitalisation (update) ~11000 Mn $ Soaps and Detergents 46% Others 1% Exports 11% Icecreams 1% Processed Foods 3%")
6 Financial Overview 2006 Turnover 2966 EBIT 419 EBIT % 14.1% PAT (bei) 377 Reported Profit 455 EPS 21c Operating Cash Flow 365 Market Capitalisation (update) ~11000 Mn $ Soaps and Detergents 46% Others 1% Exports 11% Icecreams 1% Processed Foods 3% Breverages 11% Personal Products 27% * Figures based on FY2006 Audited Results ++ Market Capitalization as per NSE as on 19 th Oct
7 Leadership across Diverse FMCG Categories Market Leader Strong No Fabric Wash Personal Wash Dishwash Skin Shampoo Talcum Powder Packet Tea Coffee Jams Toothpaste Ketchups HUL Market Share (%) Competition Market Share (%) Source : A.C Nielsen - Quarter Ended Sept 2007 Value shares 7
8 HUL Largest FMCG Company 2961 Turnover Mln. $ HUL Nestle Britannia Dabur Marico PG Combined Colgate GSK Tata Tea Godrej CP 11.1 Mrkt Capitalisation Bln $ HUL Nestle Dabur Colgate Marico Tata Tea Godrej Britannia P&G GSK 2006 TTM Turnover Mln $ Source: Audited Reports and Company Press release P&G Turnover is the combined Turnover of its listed entity together with its estimated turnover of its unlisted entity Market Capitalisation as on 19 th Oct
9 HUL Shareholding Pattern HUL Equity Capital 50 Mln $ Others % Domestic FIs, M utual Funds 18.1% FIIs 13.2 % Unilever 51.4 % Market Capitalization ~11 Bln $ * Shareholding pattern as on 30th Sept Market Capitalization as on 19th Oct
10 Agenda Overview India Opportunity HUL - Uniquely Placed Financials Strategy and Markets 10
11 Opportunities & Challenges A buoyant & growing economy Increasing per capita income drives FMCG growth Current FMCG market Growth A changing profile of a differentiated set of consumers Opportunity to grow consumption and penetration Large scale potential to grow Foods Evolving trade structure 11
12 % Sustained 8% + Growth 3-4% Growth 5-6% Growth 7-9% Growth Rising GDP and Per Capita Income GDP ($ Bln) Per Capita Income ($) Growth trend line has significant upward bias Per capita Income has doubled in 4 years India embarking on an accelerated growth cycle Source: IMF Website 12
13 Increasing per capita income drives FMCG growth Disposable income per capita vs HPC spend per capita HPC Spend Per Capita (USD) India R 2 = Per Capita disposable Income (USD) Per capita incomes drive consumption Source: Euromonitor, Morgan Stanley Research
14 FMCG Market Growth Particulars Personal Wash Laundry Shampoo Skin Toothpaste HPC Tea Coffee Foods FMCG YTD Source: AC Nielsen Retail Panel 14
15 India mn hhlds 3 Rich mn hhlds Aspirers Strivers 96 The shape of India is going to change from a pyramid to a diamond Source : National Council of Agriculture & Economic Research 15
16 Opportunity to grow consumption Per Capita Consumption (US $ ) Personal Wash (Bars) Oral Care Mkt Size Mln.$ 1496 Mkt Size Mln.$ China Indonesia India Germany USA Brazil Coffee India China Indonesia Brazil Germany USA Tea 47.8 Mkt Size Mln.$ 153 Mkt Size Mln.$ India China Indonesia Brazil USA Germany Source : Euromonitor, 2006 China India Brazil Indonesia USA Germany 16
17 Opportunity to grow consumption Per Capita Consumption (US $ ) Detergents Mkt Size Mln. $ Shampoo Mkt Size Mln. $ India China Indonesia Brazil Germany USA India China Indonesia Brazil USA Germany Ice Creams Skin care Mkt Size Mln. $ India Indonesia China Brazil Germany USA Source : Euromonitor, India China Indonesia Brazil USA Germany 17
18 Opportunity to grow penetration Penetration %* Category All India % Urban % Rural % Deodorants Toothpaste Skin Cream Shampoo Utensil Cleaner Instant Coffee Washing Powder Detergent Bar Toilet Soap Source : MRUC, Hansa Research - Guide to Indian Markets 2006 *Penetration numbers based on study conducted by Indian Readership Survey, on a sample size of ~250,000 based on usage in 6 months 18
 and Rs 0.")
19 Opportunity from Increased Penetration Unique innovations & promotions to drive category penetration Rural shampoo penetration : % households bought once/quarter SSK Black 8m Rural plan Rollout of Rs 1 (2 cents) and Rs 0.50 (1 cent) sachets MQ 04 JQ 04 SQ 04 DQ 04 MQ 05 JQ 05 SQ 05 DQ 05 MQ 06 JQ 06 SQ 06 Low price shampoo sachets have helped drive category penetration 19
20 Foods Oppurtunity. Packaged Food Market $14 Billion Largely Urban (80%), rapid historical growth: 13% Poised to accelerate: Income Elasticity of HPC Market Size Food Market Ratio of Food Market to HPMC Market Eastern Europe Latin America Africa and West Asia India $ 275 Billion Packaged 5% But bulk of food in India is still consumed fresh unpackaged Source: Euromonitor Unpackaged 95% 20


21 Modern Trade Customers Local Retailers MNC Retailers Prospective Entrants 21
22 Agenda Overview India Opportunity HUL - Uniquely Placed Financials Strategy and Markets 22
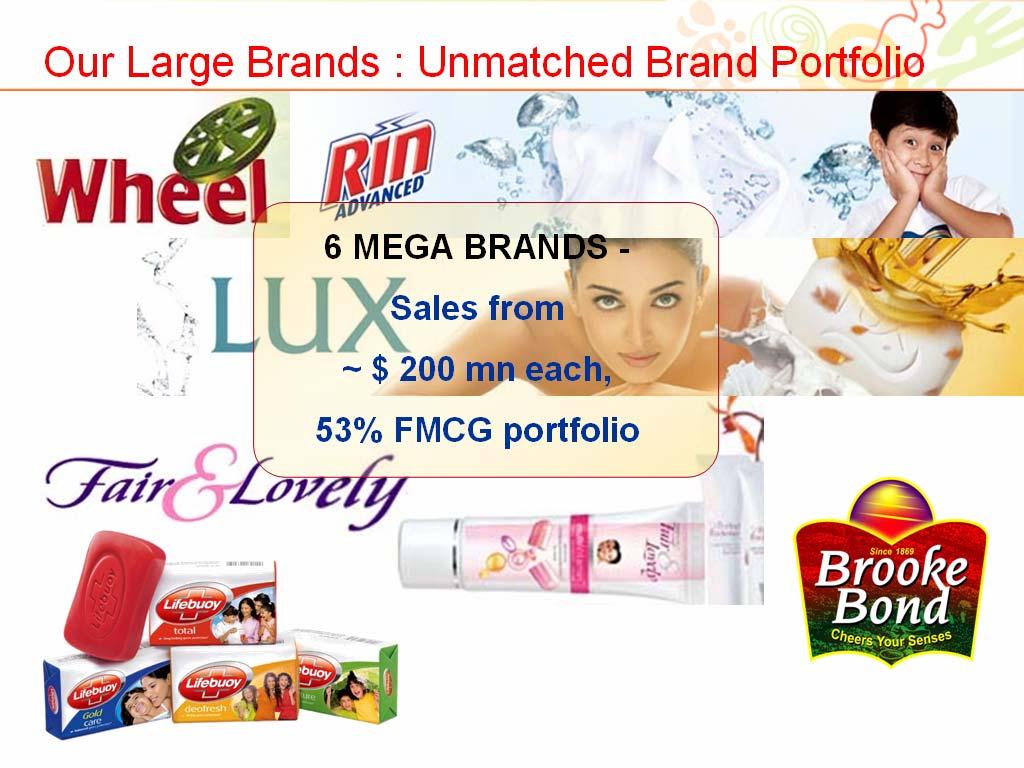
23 HUL Uniquely Positioned to Create Value Evolving Strategic Focus Track record of building large brands: Unmatched Brand Portfolio Innovation and R&D capabilities to straddle the pyramid Versatile distribution network Strong Corporate Responsibility and Governance Strong Local talent base 23


24 Evolving Strategic Focus Industries Categories Brands Non Core Busine ss DIVESTED One Company One Top Team AFS Quest Adhesives Nickel Catalyst Seeds Diversey Lever Oils & Fats 110 Brands 35 Powerful Brands Leading positions High growth spaces Global Innovation; Local Activation One Sales Force Non Core Processes Outsourced Mushrooms
25 25


26 Innovation and R&D capabilities Over 500 Unilever scientists,engineers,specialists working on R&D for Developing & Emerging markets, over 250 within India : India R&D key part of Unilever global R&D set-up India R&D supports category development plans for Skin Cleansing & Care, Fabric Cleaning & Conditioning, Household Care, Oral,Hair, Ice Cream, Beverages, Culinary Products, Staple Food Focus: Breakthrough product, processes & packaging Integrated with category business priorities, rooted in local consumer insights Continuously challenge current cost, product form & functionality, and innovation delivery time paradigms 26
27 Distribution Strength Direct coverage - 1 mln. outlets; Brands reach mln. outlets in a country with the highest store density Strong IT capability, ability to track sales up to the retail point Unique channel based initiatives to target the consumer more effectively Portfolio of category and Brands give unique reach in Modern Trade Project Shakti, a competitive advantage in Rural India 27


28 New Channel Initiatives Channels HLL Programs Family Grocers SVS/ FLO Chemist Unicare Fancy Beauty zone Kiosk K- LINE Rural Superstar & Shakti Wholesale Vijeta/ Sambandh 28
29 Organized Retail - A source of Competitive Advantage HLL Market Shares in MT GT MT NSD Bars NSD Powders Shampoo Skin Cleansing Skin Care Tooth Paste Tea Coffee Overall HLL MT Market Shares are higher than its GT shares in most categories Source : Retailer POS Data & AC Nielson Comparison with Top 6 Metros in GT 29
30 What sets us apart - Reaching Shoppers 30 DAIRY MEAT Ice cream WINE DELI Cosmetics Toothpaste Tooth brush Dish Wash Jams, Squashes Soap Custards and jelly LAUNDRY Sanitary napkins Skin Hair DIAPERS DEO Paper pdts Coffee Tea SOUP SEASONINGS SAUCE OIL PASTA SAUCE DRESSINGS SNACKS BAKERY CHECKOUTS


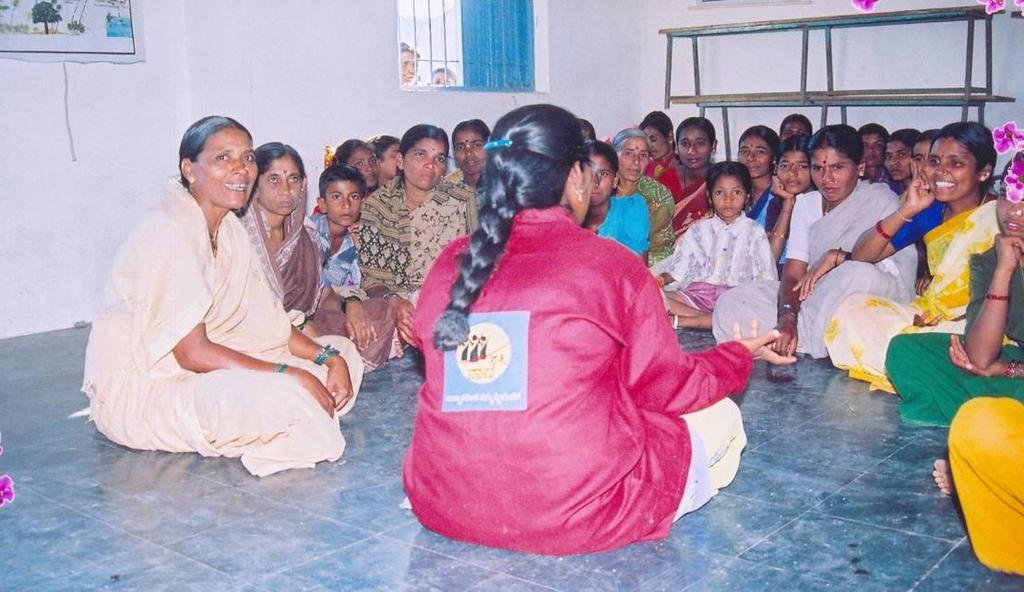
31 Project Shakti- Enabling Direct Rural Reach To Reach: Small, scattered settlements and poor infrastructure make distribution difficult Over 500,000 villages not reached directly by Unilever To Communicate: Low literacy hampers effectiveness of print media Poor media-reach: 500 million Indians lack TV and radio To Influence: Low category penetration, consumption, brand awareness Per capita consumption in Unilever categories is 33% of urban levels 31
32 Shakti Shakti builds Unilever s business where the opportunity is brightest and the challenges toughest A win-win business that accelerates community development Three Shakti interventions: Shakti entrepreneur; currently ~ women cover 1,10,000 villages Shakti Vani: one-to-many communication for category growth ishakti: customized interaction with remote consumers Impact on community Business and social impact can go together Partnerships with diverse stakeholders 32


33 33


34 Corporate Responsibility Aiding in the Development of the Country Project Shakti Empowerment of women through micro-enterprise Opportunity Relief and Reconstruction Yashodadham in Gujarat's Kutch district Health & Hygiene Lifebouy Swasthya Chetana Happy Homes Support through Asha Daan, Ankur, Kappagam Combining corporate responsibility and business strategies to aid development of rural India 34
35 Agenda Overview India Opportunity HUL - Uniquely Placed Financials Strategy and Markets 35
36 Key Financials Cum 07 Cum Reported Growth % 11.4% Continuing sales growth* % 11.5% EBIT/ Sales % % 13.3% EBIT Growth % 1.1% Operating cash flow* $365 Mn $489 Mn * Before restructuring, disposal As per audited financial statements of the company; accounting as per Indian GAAP 36
37 Robust FMCG growth HUL FMCG Sales growth % Cum'07 ++ HUL has January - December financial year. As per audited financial statements of the company; accounting as per Indian GAAP; Sales growth is worked out on a continuing basis i.e. after adjusting the base for disposals etc. 37
38 EBIT Margins EBIT Margins 19.3% 20.1% 13.2% 15.5% 14.7% 13.3% 14.1% 13.3% Cum'07 As per audited financial statements of the company; accounting as per Indian GAAP. Sales for the above calculations is Net sales (Gross Sales- Excise Duty) 38
39 Earnings per Share Figures in US $ cents HUL Earnings per Share As per audited financial statements of the company; accounting as per Indian GAAP Earnings per Share= Net Profit (aei) /No. of Shares 39
40 Dividend per Share HUL Dividend per Share Figures in US $ cents As per audited financial statements of the company; accounting as per Indian GAAP 40
41 Return On Capital Employed As per audited financial statements of the company; accounting as per Indian GAAP ROCE= EBIT/Closing Capital Employed 41
42 Return On Net Worth As per audited financial statements of the company; accounting as per Indian GAAP ROCE= Net Profit (aei) / Closing Net Worth 42
43 Agenda Overview India Opportunity HUL - Uniquely Placed Financials Strategy and Markets 43
44 Strategy Grow the Core ahead of Market Build on competitive advantage across the supply chain Implement new business strategy for Foods & Water Acquire and Retain Talent 44


45 Personal Wash Context Category penetration - 92% ; per capita consumption - $ 0.6 p.a. Market growth - 8 % ; Large market, low consumption levels (~1/7 th of Brazil), a high potential for up-trading Toilet Soaps Market Size HUL Share No.2 Share Current $ 1496 Mln. 54.0% 10.0% Affluent Aspiring Striving Our Strategy To straddle the pyramid and move consumers up to more aspirational brands. Grow share by growing ahead of the Market Source: AC Nielsen retail panel; Euromonitor 45
 Laundry Market Size HUL Share No.2 Share Current $ 1773 Mln.")

46 Laundry Context Category penetration - 87% ; per capita consumption -$ 1.4 p.a. Market growth - 8 % Well penetrated market; Low consumption levels (~1/10th that of Brazil) Laundry Market Size HUL Share No.2 Share Current $ 1773 Mln. 37.8% 13.5% Affluent Aspiring Striving Our Strategy Work the pyramid; Grow profitably ahead of the market; Regain profitability through judicious price increases and cost effectiveness programmes Source: AC Nielsen retail panel; Euromonitor 46


47 Hair care Context Category penetration - 38%; per capita consumption - $ 0.3 p.a. Market growth - 13 % Largely untapped market unmet consumer needs Shampoo Market Size HUL Share No.2 Share Current $ 463 Mln. 47.5% 24.8% Affluent Aspiring Striving Our Strategy Work the Pyramid; convert non users & increase penetration; upgrade the existing users to aspirational brands Source: AC Nielsen retail panel; Euromonitor 47
48 Skin care Context Category penetration -22%; per capita consumption - $ 0.3 p.a. Market growth - 16 % Category with potential for accelerated growth Skin Market Size HUL Share No.2 Share Current $ 575 Mln. 55.1% 7.5% Affluent Aspiring Striving Our Strategy Grow the Top End market using Unilever s International Expertise; build Ponds as a Face care brand and Vaseline as a H & B brand; drive penetration and consumption using Fair & Lovely Source: AC Nielsen retail panel; Euromonitor 48

49 Toothpaste Context Category penetration- 49% ; per capita consumption - $ 0.6 p.a. ; Market growth - 12% Toothpaste Market Size HUL Share No.1 Share Current $ 592 Mln. 30.0% 48.2% Affluent Aspiring Striving Our Strategy Grow with market with the our brands Close Up on freshness platform and Pepsodent on family & health platform Source: AC Nielsen retail panel; Euromonitor 49

50 Tea Context Well penetrated category, 2/3rd of Tea consumed is Loose Tea/local form; Market growth 17% Packet Tea Market Size HUL Share No.2 Share Current $ 896 Mln. 24.3% 20.7% Affluent Aspiring Striving Our Strategy Presence across the pyramid; drive up-trading of consumers; Convert loose tea drinkers to packet tea consumers; Source: AC Nielsen retail panel; Euromonitor 50


51 Coffee Context Coffee is emerging as a lifestyle beverage in the country with proliferation of Cafes and premium value add coffee formats Market Growth 4% Toothpaste Market Size HUL Share No.2 Share Current $ 153 Mln. 46.9% 37.7% Affluent Aspiring Striving Our Strategy Format led innovation to drive penetration & consumption. Introduction of Low unit packs to drive penetration and adoption by the masses Source: AC Nielsen retail panel; Euromonitor 51


52 Processed Foods Context Highly under-penetrated category; bulk of the consumption is still unpackaged Processed Foods Market Size HUL Presence Market Share Current $ 14 Bln. Ketchups, Soups. Squash, Jams, Atta and Salt No. 1 or 2 Our Strategy Implement the foods strategy; Use of Unilever know how to cater to local tastes; Enter new exciting markets within the processed foods space Source: AC Nielsen retail panel; Euromonitor 52


53 Water Context ~ 220 Mln Households, where safe drinking water in short supply Proposition: as safe as boiled water without hassles of boiling no harmful virus, bacteria, parasites, pesticides Works without electricity & piped water Business model based on sale of consumables Affordable price: Cost of Unit - ~$ 40; Cost of battery - $ 7 Being Rolled out across key towns and urban areas strong sales force by 2008 COST 220 liters of pure water for $ 1 Our Strategy Build brand image leadership & strong consumer relationship through effective communication; secure ongoing sale of consumables 53
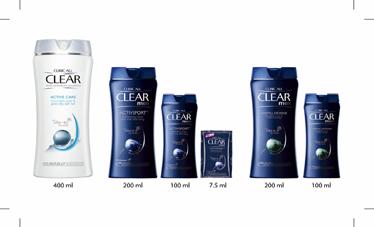
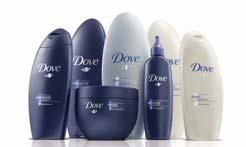


54 Key Innovations/Activations Cum SQ 07 Deos and mail Toiletries Personal wash Laundry AXE Deo Relaunch and After Shave LUX Pinkful, Crystal Shine, Breeze Herbal and Lifebouy Skin gaurd Rin Advanced, Sunlight Shampoos Toothpaste Clinic All Relaunch and Mens Range; Dove Launch Pepsodent Centre Fresh 54
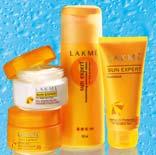


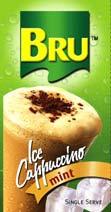

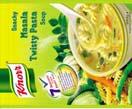

55 Key Innovations/Activations Cum- 07 Skin Creams Talc Colour Cosmetics Lakme Sun Expert, Ponds White Beauty range, FAL Relaunch Pond s Talc Relaunch Lakme Freespirit Summer Range Tea Coffee CPD Ice creams Red Label relaunch Bru Ice Cappuccino Knorr Chinese Mixes, Soups Relaunch Moo Range 55
56 Summary Focus on growing the core ahead of the Market Leverage the impact on the consumer from the growing Indian Economy Successfully implement the Foods strategy Build momentum to the Water Business Build on competitive capabilities across business system Manage Cost pressure effectively to improve margins Strong commitment to governance and CSR 56

57 Thank you