Microeconomics. first semester 2017/2018. Maciej Szczepankiewicz Chair of Economic Sciences
|
|
|
- Marilynn Lane
- 5 years ago
- Views:
Transcription
1 Microeconomics first semester 2017/2018 Maciej Szczepankiewicz Chair of Economic Sciences
2 Contacts E: Hearing hours: Tu Th Chair of Economic Sciences 307 IIIrd floor WIZ Strzelecka 11 St.
3 Motto I hear things, and I forget them. I see things, and I remember them. I do things, and I understand them. Confucius (551 B.C. 479 B.C.)
4 About course Hours List of attandance Absences The activity of students during classes. Homework How to pass..
5 Literature Basic literature: 1. P. Krugman, R. Wells, Microeconomics, Princeton Univeristy, Worth Publishers, R. Pindyck, D. Rubinfeld, Microeconomics (8th Edition), Pearson Publisher, N.G. Mankiw, Principles of Microeconomics, 9th Edition, Gengage Learning, Standford, 2014.
6 List of issues 1. Economics and its division. The main theories of economics 2. The basic concept of economics. The main principles of management 3. Rationality - full and limited. Model of homo economicus and homo sociologicus 4. Market in the modern world
7 5. Demand and supply 6. Market balance 7. The public sector in the economy 8. Elasticity of demand and supply 9. The costs in the short and long term 11. Market behaviour of enterprises 12. The theory of consumer choice 13. Perfect competition
8 Everyday Economics 10 economic terms At home, at work, school, news... What does it mean?
9 Microeconomics Demand & Supply Maciej Szczepankiewicz Chair of Economic Sciences
10 Good or Service a good is a material that satisfies human wants and provides utility, for example, to a consumer making a purchase while getting an enough-satisfying product. Commodities may be used as a synonym for economic goods but often refer to marketable raw materials and primary products. A common distinction is made between 'goods' that are tangible property, and services, which are non-physical. A service is an economic activity where an immaterial exchange of value occurs. When a service such as labor is performed the buyer does not take exclusive ownership of that which is purchased, unless agreed upon by buyer and seller. The benefits of such a service, if priced, are held to be self-evident in the buyer's willingness to pay for it.
11 Types of Goods A complement (complementary good) is a good that is used with the primary good. Usually, the complementary good has little to no value when consumed alone, but when combined with another good or service, it adds to the overall value of the offering. Examples include hotdogs and mustard, beer and pretzels, automobiles and gasoline. (Perfect complements behave as a single good.) Substitutes are goods that can be used in place of the primary good. Substitute goods are products that a consumer perceives as similar or comparable, so that having more of one product makes them desire less of the other product. Potatoes from different farms are an example: if the price of one farm's potatoes goes up, then it can be presumed that fewer people will buy potatoes from that farm and source them from another farm instead. There are different degrees of substitutability. For example, a car and a bicycle may substitute to some extent: if the price of motor fuel increases considerably, it may be expect that some people will switch to bicycles. Independent goods are goods without any direct relation. It is hard to predict the impact to primary good.
12 Complement vs Substitute vs Indpenedent Pair of goods Complementary Substitute Independent Apple and orange Peanaut butter and jam Boots and shoelace Pease and beans Pen and ink Chicken and fish Cornflakes and radio Tea and sugar Car and tires Bulb and enectricity Lamp and bleach Bread and roll Computer and software Washing machine and detergend Cake and freezer Camera and smartphone Vine and beer Beer and glasses
13 Demand (definition) Demand is an economic principle that describes a consumer's desire and willingness to pay a price for a specific good or service. Think of demand as your willingness to go out and buy a certain product. For example, market demand is the total of what everybody in the market wants.
14 Factors of demand Price of related goods: The principal related goods are complements and substitutes. If the price of the complement goes up the quantity demanded of the other good goes down. Personal Disposable Income: income after tax and receipt of benefits. If the PDI goes up the value of demand goes up. Tastes or preferences: The greater the desire to own a good the more likely people are to buy the good. There is a basic distinction between desire and demand. Desire is a measure of the willingness to buy a good based on its intrinsic qualities. Demand is the willingness and ability to put desires into effect. It is assumed that tastes and preferences are relatively constant. Consumer expectations about future prices, income and availability: If a consumer believes that the price of the good will be higher in the future, he/she is more likely to purchase the good now. Population: If the population grows this means that demand will also increase. Nature of the good: If the good is a basic commodity, it will lead to a higher demand
15 Law of Demand The law of demand is a law that states, all other factors being equal, as the price of a good or service increases, consumer demand for the good or service will decrease, and vice versa. The law of demand says that the higher the price, the lower the quantity demanded, because consumers opportunity cost to acquire that good or service increases, and they must make more tradeoffs to acquire the more expensive product.
16 Ceteris Paribus Ceteris Paribus = all other factors being equal (or constant) In microeconomics we use MODELS A model is a theoretical construct representing economic processes by a set of variables and a set of logical and quantitative relationships between them. The economic model is a simplified framework designed to illustrate complex processes, often but not always using mathematical techniques.
17 Demand Curve In economics, the demand curve is the graph depicting the relationship between the price of a certain commodity and the amount of it that consumers are willing and able to purchase at that given price
18
19 Demand function and equation The demand equation is the mathematical expression of the relationship between the quantity of a good demanded and those factors that affect the willingness and ability of a consumer to buy the good. For example, Q d = f(p; P rg, Y) is a demand equation where Q d is the quantity of a good demanded, P is the price of the good, P rg is the price of a related good, and Y is income; the function on the right side of the equation is called the demand function. The semi-colon in the list of arguments in the demand function means that the variables to the right are being held constant as one plots the demand curve in (quantity, price) space. A simple example of a demand equation is Q d = P - 30P rg + 1.4Y. Here 325 is the repository of all relevant nonspecified factors that affect demand for the product. P is the price of the good. The coefficient is negative in accordance with the law of demand.
20 Supply Supply is defined as the willingness and ability of enterprises to produce (or sell) a given quantity of output in a given period of time, or at a given point in time, and take it to market. Not all output is taken to market, and some output may be stored and released onto the market in the future. Supply can be measured for a single factor of production, for a single firm, for an industry and for the whole economy.
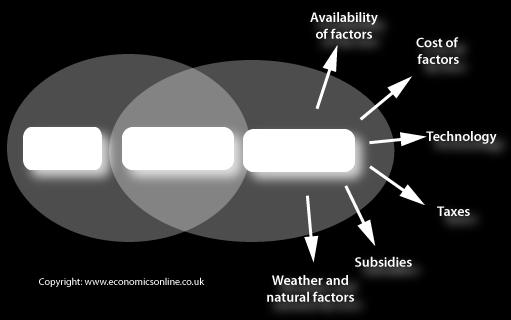
21 Determinants of supply
22 The price of the product is the starting point in building a model of supply. The supply model assumes that price and quantity supplied are directly related. The availability of factors of production The availability of factors of production, such as labour or raw materials, can affect the amount that can be produced and supplied. For example, if a firm producing motor vehicles experiences a shortage of steel for its body panels, then its ability to produce vehicles will be reduced.
23 Cost of factors Changes in costs will alter a firm s calculation of how much to supply at a given price. For example, if the same motor manufacturer experiences an increase in labour costs due to an increase in the wage rate, the cost of producing each vehicle will rise. This means that the price the manufacturer expects to receive will increase. If the price does not increase, less will be produced, ceteris paribus.
24 New firms entering the market In terms of total supply to a market, the number of firms in the market will affect the total supply. New firms in a market will increase market supply and firms leaving will reduce supply. New firms may be attracted into a market because of the expectation of profits and existing firms may leave because they cannot cover their costs, and make losses.
25 Weather and other natural factors Changes in the weather can have a considerable impact on the ability to produce certain products, like farm produce and commodities. This tends to affect the primary sector more than manufacturing. Taxes on products Taxes on products, such as Value Added Tax (VAT), have a direct effect on supply. Increased taxes affect a producer s decision to supply, and how much to supply. Subsidies Subsidies are funds given to firms to enable them to increase their supply or to reduce the price of their product to the consumer. Subsidies can alter the firm s willingness and ability to produce and supply.
26 The law of supply The law of supply states that, when all other factors being equal, as the price of a good or service increases, the quantity of goods or services that suppliers offer will increase, and vice versa. The law of supply says that as the price of an item goes up, suppliers will attempt to maximize their profits by increasing the quantity offered for sale.
27 The supply curve The supply curve is a graphical representation of the relationship between the price of a good or service and the quantity supplied for a given period of time. In a typical representation, the price will appear on the left vertical axis, the quantity supplied on the horizontal axis.
28

29 Supply function and equation

30 Equilibrium People do not lose equilibrium by the facts themselves, but the way people see them.
31 We have two ears and one mouth so that we can listen twice as much as we speak.
32 Movements versus shifts Movements along the curve occur only if there is a change in quantity supplied/demanded caused by a change in the good's own price. A shift in the supply/demand curve, referred to as a change in supply/demand, occurs only if a non-price determinant of Supply/demand changes. For example, if the price of an ingredient used to produce the good, a related good, were to increase, the supply curve would shift left.

33 Supply + demand
34 Equilibrium Equilibrium may be defined as the point at which supply equals demand for a product, with the equilibrium price existing where the hypothetical supply and demand curves intersect.
35 Ex. 1
36 Ex. 2
37 Walras s Law This economics law suggests that the existence of excess supply in one market must be matched by excess demand in another market so that it balances out. So when examining a specific market, if all other markets are in equilibrium, Walras' Law asserts that the examined market is also in equilibrium.
38 Ex. 3
39 Ex. 4
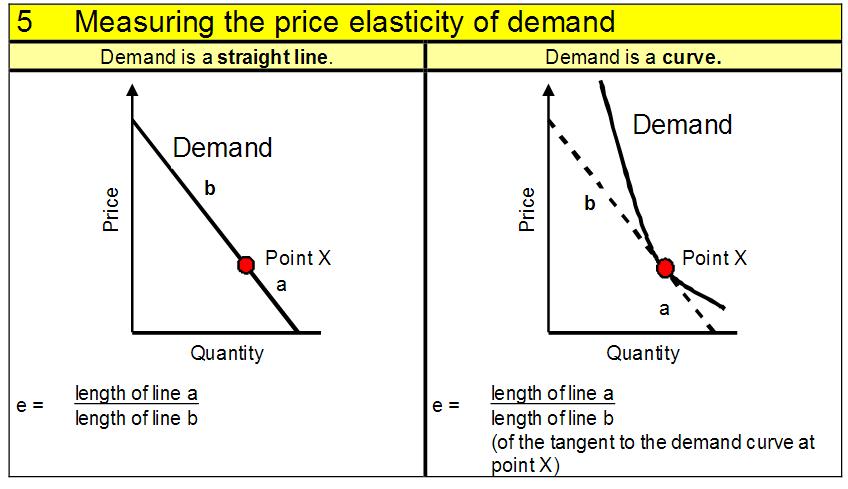
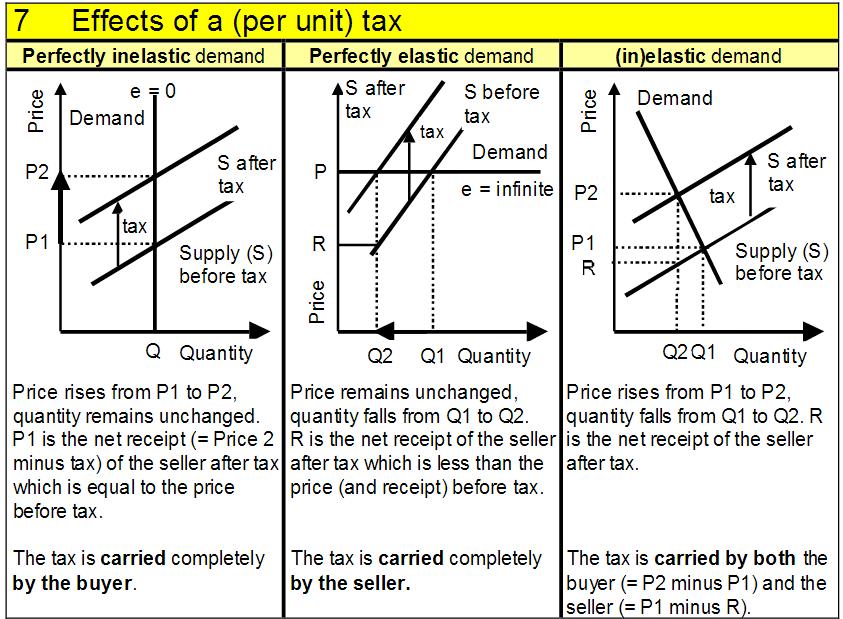
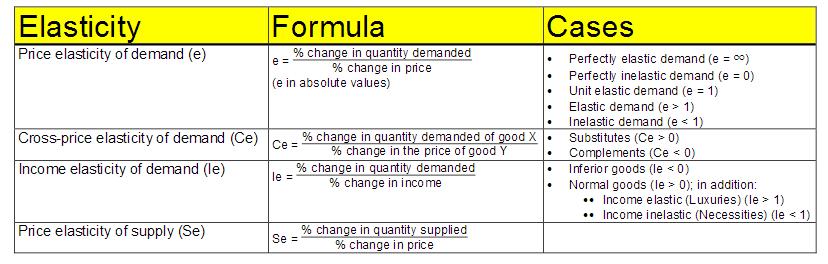
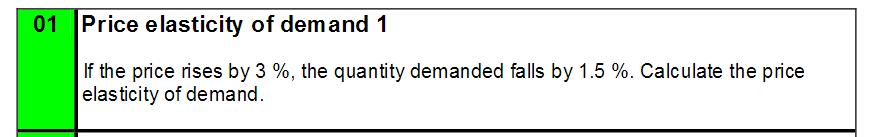
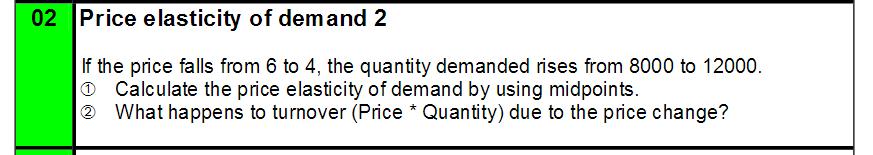
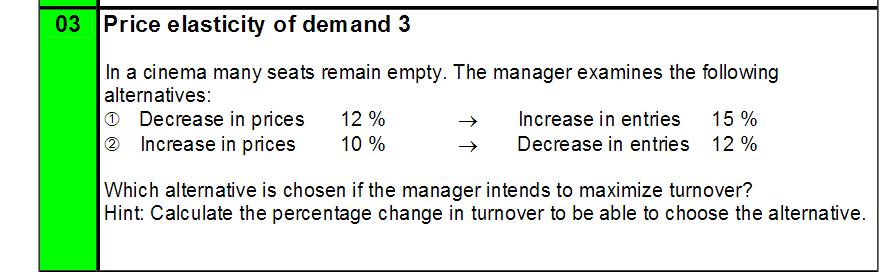
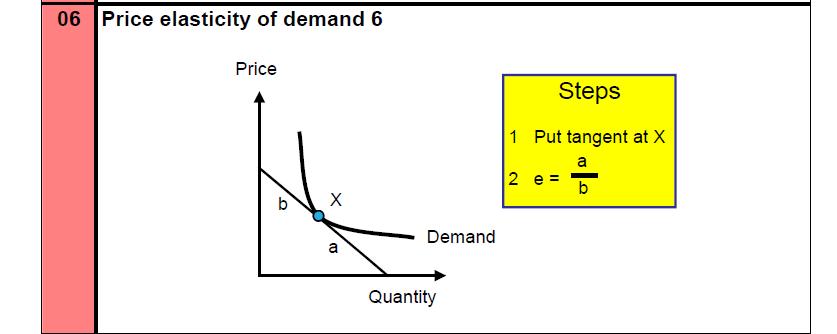
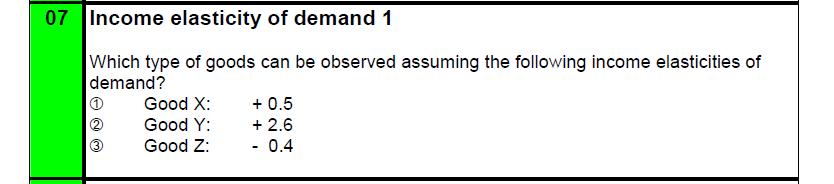
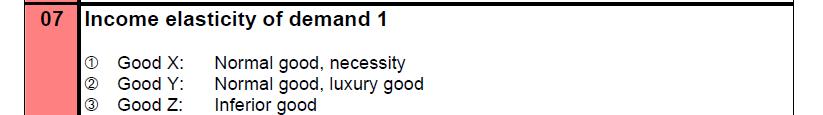
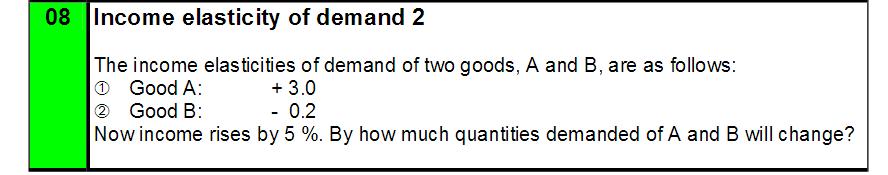
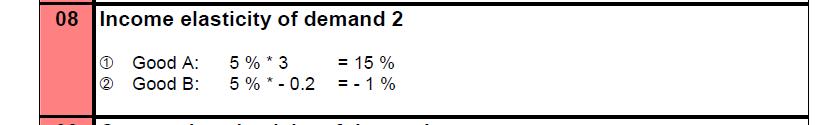
40 Elasticity Exercises
41
42
43
44
45
46
47
48
49
50
51
52
53
54
55
56
57
58
59
60
61
62