The Sharing Economy. Jeffrey Brown, FAIA, Powers Brown Architecture Jamie Lane, CBRE Andrea Foertsch, Disruptive Space
|
|
|
- Collin Glenn
- 5 years ago
- Views:
Transcription
1 The Sharing Economy Jeffrey Brown, FAIA, Powers Brown Architecture Jamie Lane, CBRE Andrea Foertsch, Disruptive Space


2 Jeffrey Brown, FAIA Founding Principal, Powers Brown Architecture Holds a Master s in Architecture from the Harvard Graduate School of Design Founded Powers Brown Architecture with partner, Joe Powers in 1999 Was elevated to the prestigious AIA College of Fellows in 2016 Is the author of several books including, Tiltwallism: A Treatise on the Architectural Potential of Tilt Wall Construction
3 Give Us Your Feedback for this Session! Session evaluations are available on your chair. Please take a moment at the end of this session to provide your feedback on the content and speakers. Evaluations can be handed in to a NAIOP staff member at the back of the room. Thank you!
4 The Sharing Economy Jeffrey Brown, FAIA, Powers Brown Architecture Jamie Lane, CBRE Andrea Foertsch, Disruptive Space
 since 2010 Author of numbers articles on Airbnb and its impact on the U.S.")
5 Jamie Lane Senior Economist, CBRE Hotels Americas Research Masters in Business Economics from Georgia State University Economist at CBRE Hotels Americas Research (formerly PKF) since 2010 Author of numbers articles on Airbnb and its impact on the U.S. Hotel Industry

6 Andrea Foertsch Founder, Disruptive Space Founder of Disruptive Space, advising on the work culture and workplace of the Shared Economy since 2012 Author of Innovation in Manufacturing: Makerspaces, for MassDevelopment and Workplace Innovation Today: The Coworking Center for NAIOP Principal of Melrose Real Estate Strategies, a real estate development consulting practice specializing in the opportunistic application of emerging trends and best practices since 1994 Innovation Thought Leadership and Futurist conference speaker and university lecturer
7 THE SHARING ECONOMY just what is it? Uber killed the taxi business AirBnB killed the hotel business it s a matter of time before technology kills the CRE business Change isn t always progress This new app from OMA and Bengler wants to disrupt the sharing economy They explain that while Silicon Valley optimism sells itself as democratic and empowering an alternative to centralized commercial and social structures they are actually detrimental to the working classes that support these networks with their labor. The Silicon Valley approach fragments and atomizes the labor force by leveraging workers private property while keeping them in a constant state of freelance contract work.

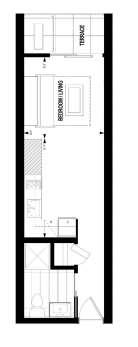
8 Ivy Lofts acre site 825,389 GSF 24 stories 550 units 10 unit types 859 parking spaces Condo size SF 1000 SF


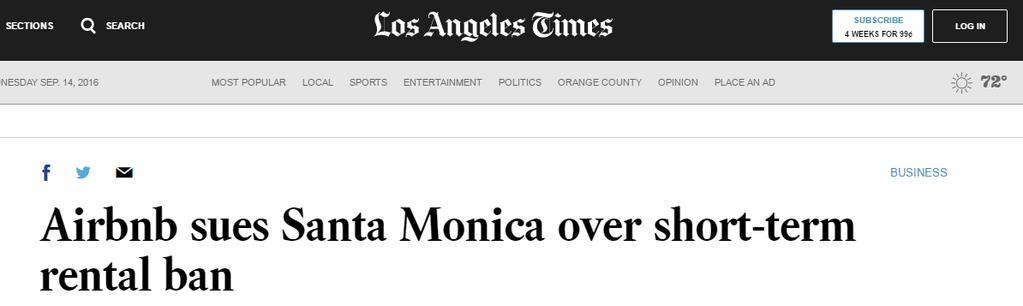
9 AirBnB Effect
10 AirBnB and Hotels Jamie Lane Senior Economist, CBRE Hotels
11 Changing Landscape of the U.S. Hotel Industry Average size of a new hotel in New York (by Decade) Rooms Sources: CBRE Hotels Americas Research, STR, Q


12 Boutique Brands and Experiences
13 Santa Monica, CA - Prices AVERAGE HOME PRICE: $1,250,000 AVERAGE RENT PER APARTMENT UNIT: $3,685 ($122 PER NIGHT) AVERAGE HOTEL NIGHTLY RATE: $298 AVERAGE AIRBNB NIGHTLY RATE: $215 Sources: CBRE Hotels Americas Research, STR, AIRDNA, Axiometrics, Trulia, Q
14 Santa Monica Average Daily Rates Airbnb Hotels ROOMS 1 HOUSE APT, CONDO, LOFT OTHER Average Tier Average 1 $136 $134 $122 $134 All $298 2 $231 $219 $204 $221 Upper $324 3 $385 $308 $270 $365 Lower $ $666 $488 $517 $655 Sources: CBRE Hotels Americas Research, Airdna, Q Rates are for Entire Units.
15 Santa Monica Airbnb demand = ½ Hotel Demand Average Daily Units 2,500 DEMAND SUPPLY 2,000 1,500 1, Sep Oct Nov Dec Jan Feb Mar Apr May Jun Jul Aug Sep Oct Nov Dec Jan Feb Mar Apr May Jun Sources: CBRE Hotels Americas Research, Airdna, Q
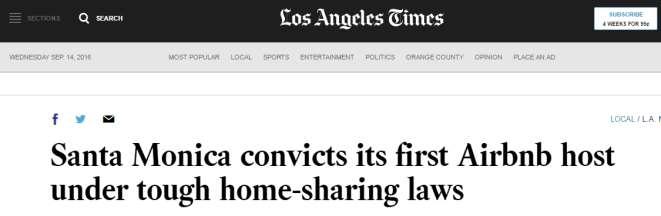
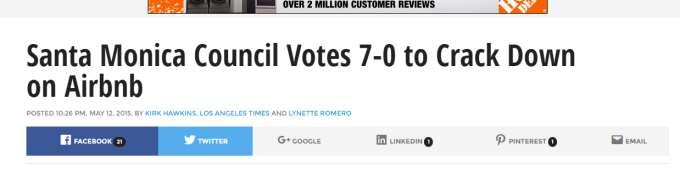
16 Regulation

17 What do these new travelers mean for the City?
18 Google Trends Short Term Rental Sites Airbnb: (United States) VRBO: (United States) Airbnb: (Worldwide) VRBO: (Worldwide) 100 HomeAway: (United States) Flipkey: (United States) 100 HomeAway: (Worldwide) Flipkey: (Worldwide) Sources: Google Trends, Q
19 Google Trends Major Hospitality Companies Airbnb: (United States) Marriott: (United States) Hilton: (United States) Hyatt: (United States) Airbnb: (Worldwide) Hilton: (Worldwide) Marriott: (Worldwide) Hyatt: (Worldwide) Sources: Google Trends, Q
20 Revenue Generated on Airbnb (July 2015 June 2016) $700,000,000 $600,000,000 $500,000,000 $400,000,000 $300,000,000 $200,000,000 $100,000,000 $- Sources: CBRE Hotels Americas Research, Airdna, Q
21 Airbnb Volume as a Percent of the Traditional Hotel Industry Supply Demand Revenue 5.0% 4.5% 4.0% 3.5% 3.0% 2.5% 2.0% 1.5% 1.0% 0.5% 0.0% Sources: CBRE Hotels Americas Research, Airdna, STR, Q
22 Airbnb Competition Index AIRBNB COMP. RANK MKT SUPPLY INDEX ADR PREMIUM INDEX AIRBNB COMPETITION INDEX MARKET MKT SUPPLY (%) ADR PREMIUM (DISC) ACTIVE UNIT GROWTH ACTIVE UNIT GROWTH INDEX 1 New York 15.5% (33.7%) % Miami 10.3% 66.4 (21.9%) % Los Angeles 11.5% 74.1 (19.3%) % Oahu 7.0% 45.0 (32.5%) % San Francisco 9.9% 63.8 (17.9%) % Oakland 9.8% 63.2 (15.4%) % Orlando 2.8% 18.3 (16.3%) % Portland 8.3% 53.7 (13.5%) % Seattle 7.2% 46.4 (14.5%) % West Palm Beach 3.0% 19.3 (23.9%) % San Jose/Santa Cruz 6.7% 42.9 (10.8%) % Fort Lauderdale 4.7% 30.2 (13.1%) % Boston 6.3% 40.7 (12.4%) % Sacramento 6.6% % % Austin 8.5% % % Sources: CBRE Hotels Americas Research, Airdna, STR, Q
23 Changing Growth Patterns for Airbnb Percent of Total Supply Outside Top 25 Markets Top 25 Markets 100% 90% 80% 70% 57.5% 60% 50% 40% 44.5% 30% 20% 10% 0% Sources: CBRE Hotels Americas Research, Airdna, Q
24 January February March April May June July August September October November December January February March April May June Resorts Units at in the Colorado Ski Areas Average Daily Active Units 6,000 Percent of Total Supply 5,000 Private Room 10% Shared Room 1% 4,000 3,000 2,000 1,000 Entire Home/apt 89%
25 Takeaways Airbnb will continue to grow at a high rate, which will lead to more friction between hotels & Residents. As consumer preference for lodging changes, the supply will continue to react. Its not just the major cities anymore that need to pay attention!
26 SHARED/CREATIVE/INNOVATION ECONOMY REAL ESTATE CONSIDERATIONS Andrea Foertsch Founder, Disruptive Space
27 Market Forces Mobile Workforce = Less Office Demand Densifying the Workplace = Less Office Demand Less Office Demand = Balance of Power Shifts to Users, not just for the cycle, for the long term Understanding What Drives High Growth Users, and Facilitating That, Attracts Users 2016 Disruptive Space. All rights reserved.

28 CHOICE Today s mobile workforce has a choice where to work, and when they choose to work together, they definitely don t want their father s workplace
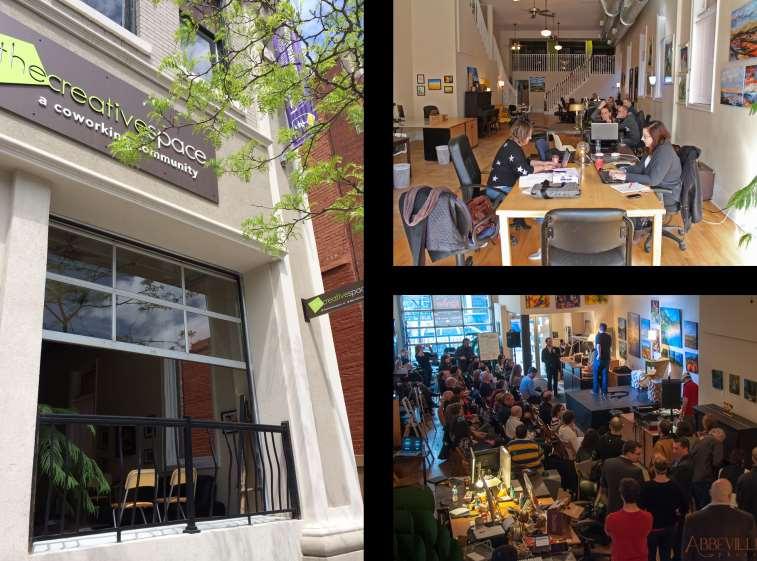
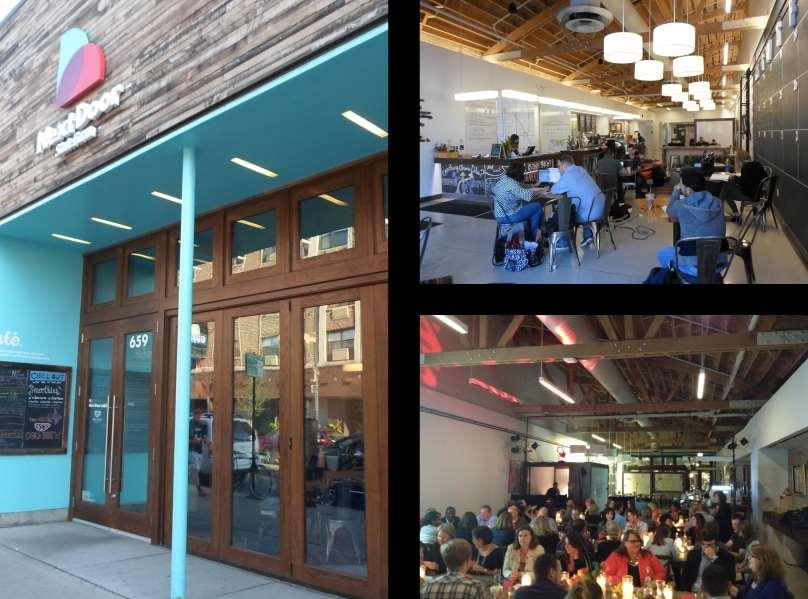
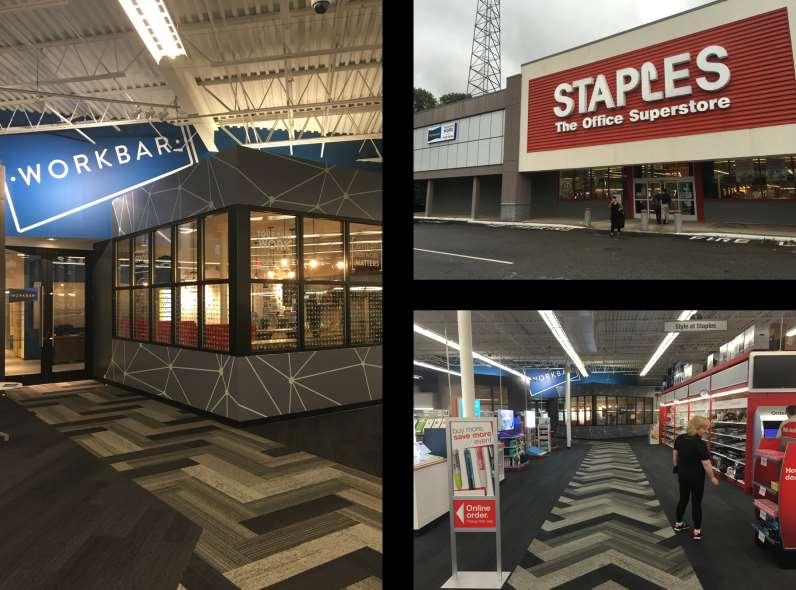
29 Revolutionary Innovation Workplaces Coworking club for working, socializing and learning Makerspace members share workshop and equipment Accelerator academic model, education, mentorship Incubator next stage space and services for small businesses (predates the revolution) Hybrids mixes and varying degrees of any of the above 2016 Disruptive Space. All rights reserved.
30 Benefits of Shared Workplace Accelerated Serendipity Engagement Immersive Experience Choice Flexibility Freedom 2016 Disruptive Space. All rights reserved.
31 Core Coworking Model member-based club, often curated Multifunctional work, education, socializing Programming events, classes, parties Interdisciplinary collaboration not competition Open Design casually promotes interaction Public/Private Interaction internal and externally generated events Distinct from: hot desking, flex space, Flex Leases (MTM) 2016 Disruptive Space. All rights reserved.
32
33


34
35 Motivations for Innovating the Traditional Workplace Research & Development Employee for Attraction & Retention Cost Reduction by Densifying the Workplace Brand Identity & Public Relations Consumer Engagement 2016 Disruptive Space. All rights reserved.

36
37

38
39

40
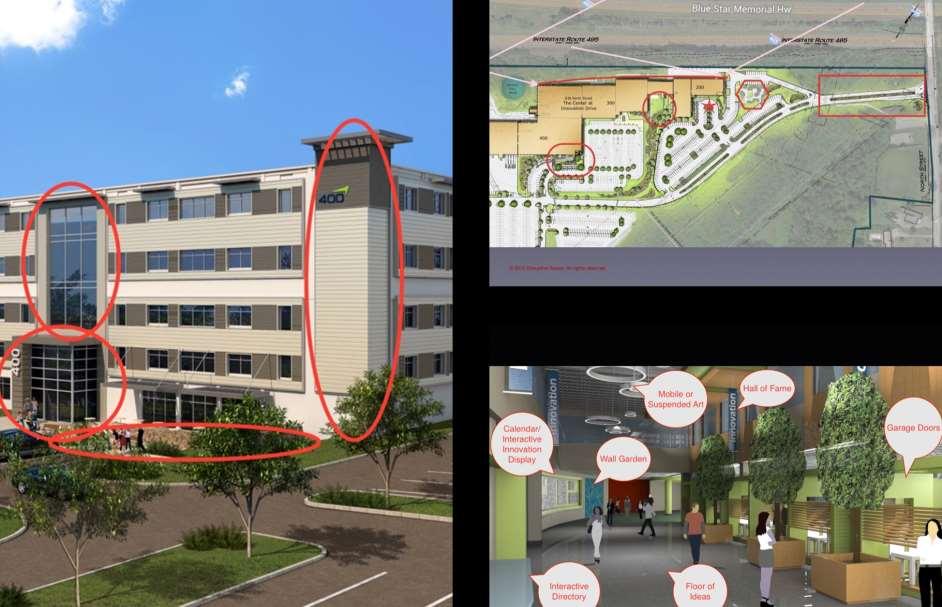
41 Innovative Property (Re)Development What is/could be your property s public interface? How can your property facilitate engagement by your tenants both internally and publicly? How can your property support the blending of the work/learn/social environment? What is your plan to target high growth tenants, for: design, marketing and operations? 2016 Disruptive Space. All rights reserved.
42
43 Questions?
44 Give Us Your Feedback for this Session! Session evaluations are available on your chair. Please take a moment at the end of this session to provide your feedback on the content and speakers. Evaluations can be handed in to a NAIOP staff member at the back of the room. Thank you!