You Know What to Measure - But How Do You Actually Measure It?
|
|
|
- Basil Dixon
- 5 years ago
- Views:
Transcription
1 etrak Online Session APRIL 13, PM ET, 1PM CT, Noon MT, 11AM PT SESSION 114 You Know What to Measure - But How Do You Actually Measure It? JOE FEDERBUSH All Materials Copyrighted by EXHIBITOR Magazine / Joe Federbush 2017 Rochester, MN PRODUCED BY EXHIBITOR MEDIA GROUP
2 R114 You Know What to Measure But How Do You Actually Measure It? Presented by Joe Federbush, President For over 20 years, Joe Federbush's primary current responsibilities are to market, consult on, and design strategic research and measurement programs that help companies, show organizers/associations, and event producers measure their return on investment (ROI) and objectives (ROO) for their trade show and event programs in a highly cost-effective way. R114 You Know What to Measure - But How Do You Actually Measure It? Agenda ECL 1: Develop measureable & actionable goals and objectives ECL 2: Know your measurement options & benefits ECL 3: Qualitative versus quantitative research ECL 4: Chose the right measurement approach ECL 5: Learn the difference between an audit & measurement ECL 6: Standardize your lead qualification ECL 7: Get your staff involved ECL 8: Understand sample sources & sizes, response rates, and confidence intervals ECL 9: Use digital & social media ECL 10: Pull it all together to measure BONUS: Sample Observation Form, Sample Survey 1


3 1. Develop measureable and actionable goals and objectives Measurement is an integral part of many companies event marketing endeavors. There is no one size fits all approach Your measurement approach should vary: Booth size Investment-level Industry Event-type 4 2
4 1. Develop measureable and actionable goals and objectives Management is telling you to measure, but not how to measure it. I m telling you: If you don t measure it, you can t really manage it 5 1. Develop measureable and actionable goals and objectives Do you measure? 6 3
5 1. Develop measureable and actionable goals and objectives Do you measure? What do you measure? 7 1. Develop measureable and actionable goals and objectives Do you measure? What do you measure? How do you measure? 8 4
 Lead Quantity Lead Quality Purchase Intent Sales Meetings Cost-per-Visitor & Cost-per-Lead Actual Orders Sales Conversion 10")
6 1. Develop measureable and actionable goals and objectives Marketing (ROO) Product Relevancy Brand Awareness Message Communication Perception of Company/Products Effectiveness of Booth & Tactics Booth Staff Create a Buzz Sales (ROI) Lead Quantity Lead Quality Purchase Intent Sales Meetings Cost-per-Visitor & Cost-per-Lead Actual Orders Sales Conversion 10 5


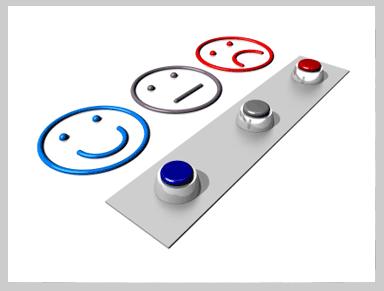
7 2. Know your measurement SIMPLE COMMON QUANTITATIVE BEHAVIORAL SOCIAL Observations Leads Surveys RFID Social Media Know your measurement Observations 12 6


8 OBSERVE 2. Know your measurement Get a birds eye view when possible Multiple times per day over multiple days Visitors: Where are they going? and not going? What are they doing? and not doing? Staff: Are they attentive? Knowledgeable? Qualifying? Are there enough? Too many? 14 7


9 OBSERVE 2. Know your measurement Know your measurement Sales Leads 16 8


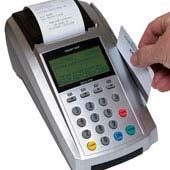
10 LEADS 2. Know your measurement Develop a lead strategy Lead Quality Simple standardized qualification questions Ask those questions Make notes to refer to later Import into CRM, tie back to a campaign, and track 18 9


11 LEADS 2. Know your measurement Tracking Sales Account for leads after events Go beyond an blast Actually nurture leads Track progress and sales Identify other sources that aided the sale 19 LEADS 2. Know your measurement Feed the Pipeline with Quality Leads SIMPLE LESS-SIMPLE 20 10


12 2. Know your measurement Surveys 21 11


13 2. Know your measurement SURVEYS 2. Know your measurement SURVEYS Develop Measurement Strategy and Plan PLAN! Give yourself enough time before event At least 3-4 weeks Start with defining objectives Then think about the questions around your objectives Create survey - align questions to objectives in logical order 24 12
14 2. Know your measurement SURVEYS Determine best methodology and sample source On-site booth exit survey Visitors Pre/Post attendee survey Attendee registration database Post-show lead survey Leads/Badge swipes Sales conversion survey Leads/Badge swipes Determine reporting and analysis options How will results be used? 25 SURVEYS 2. Know your measurement TACTICAL VERSUS STRATEGIC THINKING STRATEGY Enhance Brand; Increase Product Interest Align & Communicate with Targets Accelerate Sales/Feed Pipeline Create a Buzz Selective Attraction of Target Audience Educational and Entertaining TACTIC Demos/Theater Effectiveness Graphics & Messaging Leads Collection & Qualification Giveaways/Coffee Bar/Entertainer Booth Traffic Crowd Gatherer; Entertainer; Interactives 26 13
15 SURVEYS 2. Know your measurement Pre-event Survey PLAN! Give yourself enough time before the event. At least 3 to 4 weeks. Obtain pre-show attendee registration list Develop short questionnaire; Questions are designed to benchmark and measure change Mail survey or link to online survey Report and analyze results 27 SURVEYS 2. Know your measurement Pre-event Survey Metrics Reasons for attending Issues/challenges your organization is facing Products interested in seeing Likelihood to purchase Awareness and association of products, brands, and messages Demographics (job title, industry, buying role) 28 14
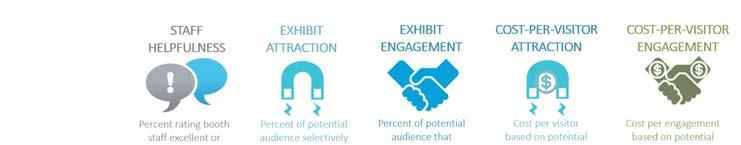
16 SURVEYS 2. Know your measurement Post-event Survey Similar plan as the Pre- survey (plan, obtain sample source, think through developing a great survey) Survey attendees? Leads? Ask same questions as on pre-event survey (if doing pre/post) Ask about event and exhibit experience 29 SURVEYS 2. Know your measurement Post-event Survey Metrics Exhibit Performance Staff helpfulness, knowledge, accessibility Quality and usefulness of information obtained What s new/different Will help visitors do their job better Differentiated from the competition Buy more? Buy sooner? Net Promoter Score Effectiveness of promotion 30 15
17 SURVEYS 2. Know your measurement Post-event Survey Metrics Attendee Activity and Profile Time spent on show floor Other shows attended Other exhibit visited and actions taken Social media usage Media readership & viewership 31 SURVEYS 2. Know your measurement On-site Survey Focus on booth experience & marketing communications (messaging, areas visited, satisfaction, perception) Kiosk (self-administered) Personal interview (use professional interviewers) Paper, tablet, Web-based, mobile 32 16

 Behavioral analysis of")


18 2. Know your measurement RFID, NFC, ibeacon Know your measurement Non-traditional measurement tools -- RFID Radio Frequency Identification (RFID) Behavioral analysis of visitors Virtually follow visitors throughout exhibit Where they are going Amount of time spent at booth areas Identify who they are Requires partnering with RFID company or developing your own system 17


19 2. Know your measurement Non-traditional measurement tools -- RFID Area A 8% visited 32.7 mins each Area B3% visited 6.0 mins each Area D 19% visited 9.4 mins each Area C 4% visited 9.5 mins each IR 12% visited 14.8 mins each Area U 16% visited 12.7 mins each Area V 36% visited 17.5 mins each Area W 26% visited 12.7 mins each 2. Know your measurement Non-traditional measurement tools -- RFID 18


 Beacons are small wireless transmitter devices that use")

20 2. Know your measurement Non-traditional measurement tools -- NFC Near Field Communications Touching smartphones together to establish radio communication Social aspects: sharing music, pictures, contact info Event aspects: checking in to sessions, requesting info at your booth 2. Know your measurement Non-traditional measurement tools ibeacon and geofencing (proximity marketing) Beacons are small wireless transmitter devices that use BLE, also known as Bluetooth Smart, to interact with nearby devices running Apple ios 7 or Android. Apple (ibeacon) and PayPal have been two of the biggest-name advocates of the technology. 19
21 ELC 3: Estimate appropriate event budgets, staff and exhibit sizes 39 ELC 3: Estimate appropriate event budgets, staff and exhibit sizes 40 20


22 ELC 3: Estimate appropriate event budgets, staff and exhibit sizes Scenario 1 41 ELC 3: Estimate appropriate event budgets, staff and exhibit sizes Scenario

. Quantitative research involves analysis of numerical data.")
23 ELC 3: Estimate appropriate event budgets, staff and exhibit sizes Quantitative versus Qualitative Measurement Qualitative research involves analysis of data such as words (e.g., from interviews), pictures (e.g., video), or objects (e.g., an artifact). Quantitative research involves analysis of numerical data
24 4. Choose the Right Measurement Approach There is no one-size fits all approach Determine what s most important to you What will your budget allow? What resources and bandwidth do you have available? Audit versus Survey Audit: An objective review by an independent (and certified) auditor of registration data to objectively confirm the number of Exhibit Only and paid Conference Delegates who actually attended an event or trade show. The report by the auditor summarizes the data. Source: The Exhibition and Event Industry Audit Commission (EEIAC)
25 5. Audit versus Survey Survey: Method used to collect in a systematic way information from a sample of individuals. A survey may focus on different topics such as preferences, behavior, or factual information, depending on its purpose. Since survey research is always based on a sample of the population, the success of the research is dependent on the representativeness of the population of concern Standardizing Lead Qualification Why? To create a marketing funnel to feed into sales Create a universal definition of how leads get qualified Don t ask everything; K.I.S.S. Basic contact info Role in buying Purchase timeframe Product Interest Develop consistent lead scoring system and post-event report 48 24


26 6. Standardizing Lead Qualification Report Lead Results Per Event & Collectively Standardizing Lead Qualification 1.Select products/solutions are of interest? List major categories or brands 2.What is your purchasing role? Final say Specify Supplier Recommend Supplier No Role 3.What is your purchase timeframe? <1 month 1 3 months 3 6 months More than 6 months 4.What is anticipated budget? Less than $100,000 $100,000 to $500,000 Greater than $500,000 5.(Optional) custom question (i.e., ) Current customer? Preference to receive information? Biggest challenge? NOTES: 50 25

27 7. Get Your Staff Involved Staff involvement is one of the most essential components of a successful event Provide training before events Obtain staff feedback after events Have a plan so staff are on the same page Always revisit plan to staff effectively 51 26
28 8. Sample Sources & Sizes, Response Rates, and Confidence Intervals Sample Source Visitors: Those who spend quality time in your booth. Does not matter if they swipe their badge Leads: Keep in mind, not every visitor swipes their badge. Are your leads really representative of your visitors? Attendees: Randomly selecting from all registered attendees, regardless of if they visited your booth Sample Sources & Sizes, Response Rates, and Confidence Intervals Sample Size Reliable: statistically reliable and projectable A larger sample size leads to increased precision Response Rates Surveys typically yield 5% to 25% response rates. Varies by industry and source. Work backwards to ensure you have enough completed surveys 54 27


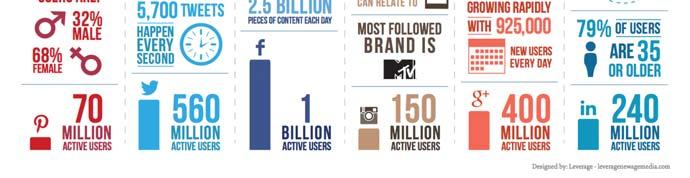
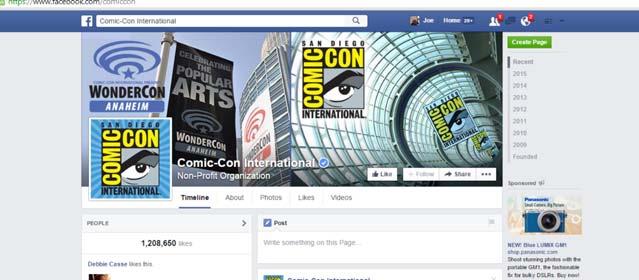
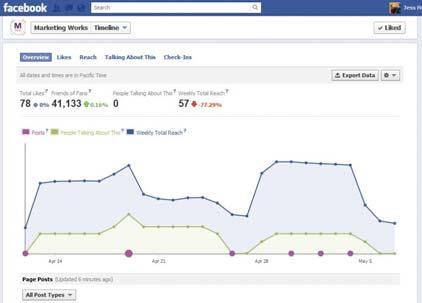
29 8. Sample Sources & Sizes, Response Rates, and Confidence Intervals Confidence Interval & Level The confidence interval is the plus-or-minus figure usually reported in newspaper or television opinion poll results. The confidence level tells you how sure you can be. It is expressed as a percentage and represents how often the true percentage of the population who would pick an answer lies within the confidence interval. The 95% confidence level means you can be 95% certain; the 99% confidence level means you can be 99% certain. Most researchers use the 95% confidence level Digital & Social Media Cost-effective Time consuming Provides increased measurement Give attendees access to event-related information when and where they want it Creates community and content 56 28


30 9. Digital & Social Media Based on Content Marketing Institute/MarketingProfs 2016 Content Research, the difference between B2B and B2C marketers is which platforms they use


31 Source:


32


33


34


35 10. Pull it all together to measure! What will you do differently to measure your event success? How will you go about it? 68 34

36 69 APPENDIX Metrics You Can Use Everyday POST-SHOW SURVEY BENCHMARKS AND TRENDS 70 35

37

38 Sample Onsite Booth Exit Survey 37

39 Contact info Joe Federbush 76 38