The Energy-Smart Pricing Plan SM (ESPP) Real-Time Pricing for Residential Customers. Lawrence Kotewa Senior Engineer and Project Manager
|
|
|
- Carmel Owens
- 5 years ago
- Views:
Transcription
1 The Energy-Smart Pricing Plan SM (ESPP) Real-Time Pricing for Residential Customers Lawrence Kotewa Senior Engineer and Project Manager
2 Real-Time Pricing for Residential Customers The Chicago RTP pilot Program Description Evaluation and results Real-time pricing as part of restructured energy markets in Illinois Legislative and regulatory actions Assessing the potential value What s New? New RTP Program for Ameren Where this could lead Developing new programs
3 Illinois Timeline
4 The Value of Real-Time Pricing The Community Energy Cooperative formed in 2000 to help consumers find ways to benefit from deregulation and restructuring of the electricity industry Initial pilot programs focused on demand reductions on targeted stressed feeders and substations The problem: Programs were successful, but no one could agree on the value of an avoided kw on that infrastructure!
5 The Chicago RTP pilot ESPP
6 Why RTP and not CPP? Similar demand response Both require new metering But Customers get the fairness of RTP passing through prices from the market without a mark-up or risk premium Closer correlation between retail and wholesale markets should lead to economic efficiency
7 Initial Research Questions Will customers sign up? Will they change their behavior? Will they accept the program?
8 Evolution of Residential Real- Time Pricing in Illinois Residential real-time pricing initially researched and developed by Community Energy in Successful Illinois pilot program ( ) with ComEd under Energy-Smart Pricing Plan brand led to legislative action Currently implementing real-time pricing with Ameren under the Power Smart Pricing brand
9 Pilot Program Key Details Energy unbundled from distribution and transmission Consumers paid hourly, market-based prices (pass through of PJM hourly price) Interval meters, read by traditional meter readers The Cooperative provided an intermediary role providing outreach, consumer education, high price notifications ComEd remained the supplier and billed the participant
10 Participant Demographics Over 1,500 enrollments over life of pilot program Diversity across race and income Housing Types Single Family 85%; Multi Family 15% Location Chicago 38%; Suburban 62% Central Air Conditioning Yes 52%; No 48% Window Air Conditioning Yes 40%; No 60%
11 Helping Consumers Manage Prices Information about hourly energy prices Education about general price shapes by season Access to daily prices via a website or phone number Notification of high price days (over 13 cents/kwh) By telephone or , issued the previous evening Access to web-based tools to view charts and graphs of energy use, price and cost down to the hourly level Online and printed summaries of energy use, costs and comparable flat rate bills Educational materials on energy efficiency and how to reduce usage during peak times These tools can create changes in behavior

12 Sample Educational Materials
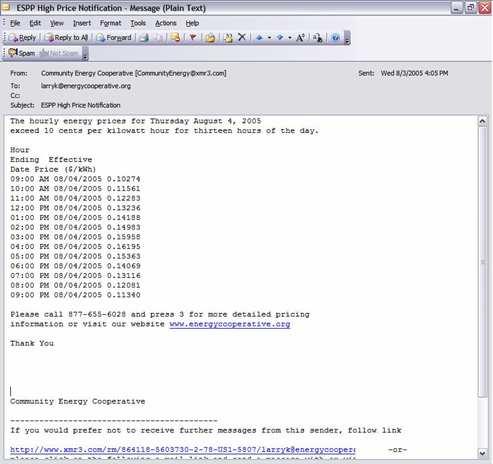
13 High Price Notification

14 Web Access to Detailed Energy Use Data
15 Pilot Program Saw a Variety of Prices and Weather Average Energy Price ( /kwh) Maximum Summer Price ( /kwh) Cooling Degree Days (Avg. is 799) Summer Days with High Price Notifications ,
16 Dec-0 6 $ $ $ $ $ $ $ $ $ $ $ Average Energy Prices Paid S ta n d a rd C o m E d Rate E n e rg y C o s t D is trib u tio n C o s t Oct-06 Apr-03 Ju n-03 Aug-0 3 Oct-03 Dec-0 3 Feb-04 Apr-04 Ju n-04 Aug-0 4 Oct-04 Dec-0 4 Feb-05 Apr-05 Ju n-05 Aug-0 5 Oct-05 Dec-0 5 Fe b-06 Apr-06 Ju n-06 Aug-0 6 Feb-03 $/kwh
17 Bill Impacts Year Average Bill Average Monthly kwh Savings Percent Renewing 2003 $ % 99% 2004 $ % 99% 2005 $ % 87% 2006 $ % N/A Consistently high retention rate, even in 2005, despite a very hot summer, and high power prices driven by natural gas costs (Does not include participants who moved during the year)
18 How Did Customers Respond to Price Signals? Evaluations by Summit Blue and our own internal research demonstrated price response measured in several ways: Elasticity of demand across summer hours Peak demand reductions Conservation and energy efficiency awareness and actions
19 Elasticity of Demand Annual average elasticities ranged from to Impacted by weather and price each year Central air conditioner cycling increased elasticity by as much as 50% We found elasticities on all summer days, not just high priced days this goes beyond just cutting peak and implies load shapes improving Success in notifying participants of next day s price improves their response
20 Peak Demand Reductions Demand Reductions Increase with Air Conditioner Cycling 5% 0% ESPP without enabling technology ESPP with air conditioner cycling -5% -10% -15% -20% -25% 1:00 AM 7:00 AM 1:00 PM 7:00 PM
21 Conservation and Energy Awareness ESPP participants overall monthly summer energy (kwh) usage suggested a conservation effect Reduction in usage of 3% to 4% relative to estimated usage without hourly electricity prices. Participants reported buying ENERGY STAR rated appliances at a high rate and feel more energy aware
22 Overall Pilot Program Met/Exceeded Expectations How Overall Program Experience Compared to Expectations 70% 60% 50% 40% 30% 20% 10% 0% Exceeded expectations Met expectations Did not meet expectations Blank
23 2006 Heat Wave Difficulty in Participating During August 2006 Heat W ave 60% 50% 40% 30% 20% 10% 0% Extrem ely easy Fairly easy Neither easy nor difficult Fairly difficult Extrem ely difficult Blank Other
24 Conclusions from Pilot Program RTP can be successfully implemented with relatively inexpensive incremental technology Useful, reliable pricing information is critical component Creates a real opportunity for energy awareness messages Consumer education is needed (want and use energy information relevant to their situation) High price notifications focus people s attention An automatic curtailment option such as an air conditioner cycling switch or a smart thermostat produces added benefits
25 Real-time pricing as part of restructured energy markets in Illinois
26 Policy Climate for Expansion Like other states, legislators concerned about failure of a competitive (or any) retail market for small customers Starting in 2007, ComEd flat rates increased 22-26%, Ameren rates by 40-50% Experience of the ESPP pilot program showed savings for participants and benefits to the system through demand response Legislators, consumer advocates and other public interveners supported RTP as a rate option to provide consumer choice and reduce costs Criteria for the success of residential RTP is to document projected system benefits
27 Expanding Real-Time Pricing in Illinois Illinois retail prices are now determined by a New Jerseystyle auction RTP default service for large C&I All customers have an option to take RTP 1997 deregulation did not envision information, education and programmatic support needed to make RTP work for residential customers Legislation enacted spring 2006: Creates a residential RTP program and specifies roles for the utility and others Creates a framework that justifies including costs in overall rate base
28 Support From Legislators and Consumers This just seems to make eminent sense to me-- if you're in a position where you can hold out in the heat of the day and run your air conditioner at night, you're gonna save some money. Representative William Black (R-Danville) during floor debate on SB1705, April 4, 2006 CUB and the City view ComEd s Tariff as a necessary and important step toward the development of substantial demand response that can provide the discipline lacking in the markets today. Testimony of Chris Thomas, Citizens Utility Board in support of ComEd rate filing in Docket , October 31, 2006
29 Assessing The Potential Benefits of RTP Illinois legislation required assessment of net benefits to consumers from program, including consideration of: Improvements to system reliability and power quality Reduction in wholesale market prices and price volatility Electric utility cost avoidance and reductions Market power mitigation, and Other benefits
30 Net Benefits Analysis UPI Price Response Evaluation Processes This model assesses two of the five areas: Reduction in wholesale market prices and price volatility Electric utility cost avoidance and reductions Didn t Quantify: Improvements to system reliability and power quality Market power mitigation Other benefits Customer Segmentation Price Elasticity Load Shapes Status Base Yr. Quo Yr. High Mid Yr. Extreme High Yr. Demand Curve Prototype Pricing Plans PriceFx Simulation Load Load impacts impacts Financial Financial Benefits Benefits Participant Bill Participant Bill Savings Savings LSE Hedge LSE Hedge Savings Savings Benefits Supply Curve Events Supply curve (LMPs) LSE Energy LSE Energy Market Market Savings Savings Net Social Net Social Welfare Welfare Improvement Improvement Likelihoods Market Supply Scenarios Capacity Plans a Demand Forecast Multi -Yr. Benefit Outlook
31 Net Consumer Benefits Annual costs for a program at scale (213,000 households [10%]) are smaller than the benefits the program will produce using the base model Other benefits not calculated would increase net benefits [Adapted from CUB/City of Chicago Exhibit 3.5, Testimony of Bernie Neenan in ICC Docket ] Meter Leases Administration Total Cost Participant Fees Non-Participant Costs Total Revenue Participant Benefits Non-Participant Benefits Total Benefits Net Participant Benefits Net Non-Participant Benefits Total Net Benefits $ 13,798,801 $ 3,132,321 $ 16,931,122 $ 5,751,000 $ 11,180,122 $ 16,931,122 $ 23,000,000 $ 11,400,000 $ 34,400,000 $ 17,249,000 $ 219,878 $ 17,468,878
32 The Impact of Improving Response Nonparticipant benefits rise more than participant benefits! (Millions per Year) $70 $60 $50 $40 $30 $20 C&I Customer Benefits Other Residential Benefits RTP Participants $10 Adapted from CUB/City of Chicago Exhibit 3.6, Testimony of Bernie Neenan in ICC Docket ] $0 Reference (-.047) First Step (-.096) Target (-.141)
33 Illinois Next Steps That was all theory, now Illinois needs to demonstrate this through implementation New programs under development at both ComEd and Ameren Ameren program under Power Smart Pricing brand, ComEd program under Wattspot brand After four years, Illinois Commerce Commission will assess programs to determine whether they are generating net benefits to residential rate payers and will decide whether to continue, modify or terminate programs
34 What s new?
35 New RTP Program: Power Smart Pricing New optional rate for Ameren customers administered by the Community Energy Cooperative Same distribution and customer charge as flat rate Participants pay additional $2.25/monthly meter charge. All other residential customers pay 7 /month Pass through of MISO real-time price Note: Price is the true real-time price, day ahead price used for advisory purposes only

36 New Technology PriceLight PriceLight offers up to the hour communication of the current energy price Color change alerts realtime high price


37 Improved Online Experience Examples of Nexus Web Based software displays


38 What Could Come Next Changing people s behavior and awareness opens them up to interest in Innovative information communications systems New homes with enabling technology built in Grid friendly appliances
39 For More Information Lawrence Kotewa Senior Engineer and Project Manager 773/ Community Energy Cooperative 2125 West North Avenue Chicago, IL 60647