Community Meeting Meeting #3 WELCOME. October 23, 2013
|
|
|
- Charlotte Kelly
- 5 years ago
- Views:
Transcription

1 Community Meeting Meeting #3 WELCOME October 23, 2013
2 Tonight s Agenda Welcome + Introductions What We Heard: Community Workshop Results Refined Development Scenarios Finance Analysis Summary Design Guidelines Next Steps Open House
3 Planning Process Community Meeting #1: Planning Workshop May 21, 2013 Tuesday: May 21, 2013 Advisory Board Review + Coordination Community Meeting #2: Alternatives Review Wednesday: June 19, 2013 Advisory Board + Technical Committee Meetings Advisory Board Meeting Community Meeting #3: Scenarios + Analysis Review Wednesday: October 23, 2013


4 Study Overview Build on Outcomes of Previous Visioning Study Community Meetings: Oct Feb Initial Input: 83% Favor Area Redevelopment New Residential Uses Transit + Bus Improvements Bury Utilities Improve Parks + Open Spaces
5 Study Overview May 21, 2013

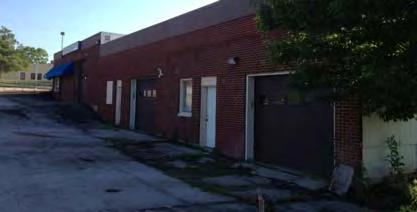
6 Existing Conditions May 21, 2013
7 Existing Conditions: Acreage ~3 Ac. ~3 Ac. ~3 Ac. ~15.5 Ac. May 21, 2013


8 Existing Conditions: Study Area May 21, 2013


9 Planning Workshop: May 21 st May 21, 2013


10 Alternatives Review: June 19 th May 21, 2013
11 Alternatives Review: June 19 th May 21, 2013

12 Workshop Results + Analysis Original Survey given to three different groups: Community Members Advisory Board Members Online Surveyors


13 Workshop Results + Analysis 4 different survey categories: Words that describe the site today Words that describe the site in the future Rank your scenario preference 5 questions to rank, scaled from 1 to 10

14 Workshop Results + Analysis Existing Site Conditions Word Cloud Analysis: Between the three different groups, there were a plethora of similarities; Here are the top five: Tired Ugly Blight Unattractive Inaccessible
15 Workshop Results + Analysis 4 different survey categories: Words that describe the site today Words that describe the site in the future Rank your scenario preference 5 questions to rank, scaled from 1 to 10

16 Workshop Results + Analysis Future Site Conditions Word Cloud Analysis: Between the three different groups, there were a plethora of similarities; Here are the top five: Green Inviting Accessible Attractive Vibrant
17 Workshop Results + Analysis 4 different survey categories: Words that describe the site today Words that describe the site in the future Rank your scenario preference 5 questions to rank, scaled from 1 to 10


18 Workshop Results Community + Advisory Overall Scenario Option Results OPTION A OPTION B OPTION C OPTION D OPTION E Totals AVERAGE


19 Workshop Results + Analysis Other major statistics noticed: 76% submitted Option A as their LEAST favored option. 16 GREEN DOTS on Underpass in Scenario E 20 RED DOTS on Vacant Kmart in Scenario A
20 Workshop Results + Analysis 4 different survey categories: Words that describe the site today Words that describe the site in the future Rank your scenario preference 5 questions to rank, scaled from 1 to 10


21 Workshop Results + Analysis Community + Advisory Overall Results Question #1: Question #2: Question #3: Question #4: Question #5: Driven by Market Demand Driven by Public Policy Character and Quality as a priority Development Incentives as a priority Sustainability as a priority


22 Workshop Results + Analysis May 21, 2013


23 Workshop Results + Analysis May 21, 2013


24 Workshop Results + Analysis May 21, 2013


25 Workshop Results + Analysis May 21, 2013


26 Workshop Results + Analysis May 21, 2013


27 Anticipated Study Outcomes Create Alternative Development Ideas + Concepts Explore Transportation + Transit Opportunities Evaluate Potential Incentives + Public/Private Partnerships Develop Design Guidelines for Future Implementation May 21, 2013

28 Final Redevelopment Scenarios Concept A Concept B Concept C Concept D Concept D+
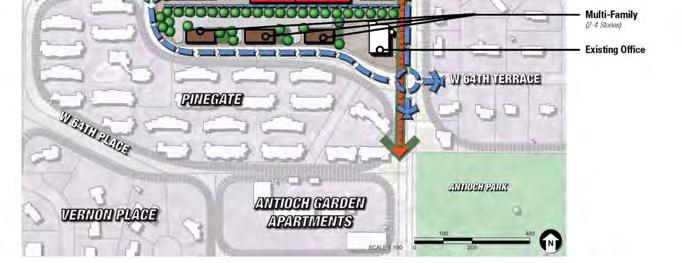
29 Final Redevelopment Scenarios Scenario A: Adaptive reuse of vacant K-Mart for large tenant or mix of smaller tenants - Redefined parking + site circulation - Enhanced landscape - Mix of new + revitalized pad sites New residential along 64 th Terrace New convenience store, restaurants, and library expansion (adjacent parking lot) Auto-oriented and commercial heavy Trail connection follows 64 th Terrace + Eby/IKEA Way
30 Final Redevelopment Scenarios Scenario B: Adaptive reuse of vacant K-Mart for large tenant or mix of smaller tenants - Redefined parking + site circulation - Enhanced landscape - Additional new retail + pad site - Integrated hotel + restaurant (IHOP?) New bank/office location, new restaurants, and library expansion New residential along 64 th Terrace and senior housing on existing bank site Trail connection follows Antioch/62 nd Terr.

31 Final Redevelopment Scenarios Scenario C: Redevelopment of K-Mart site - Proposed mixed-use commercial/office - Slater underpass and trail connection - Pedestrian-friendly retail/office district - Integrated hotel + restaurant (IHOP?) New bank/office location, new restaurants, and library expansion with integrated uses New residential along 64 th Terrace and senior housing on existing bank site Lacks residential community growth + transit supportive density

32 Final Redevelopment Scenarios Scenario D: Redevelopment of K-Mart/Sears site - Proposed mixed-use retail commercial, office, and residential uses - Slater underpass and trail connection - Pedestrian-friendly retail/housing district - Integrated hotel + restaurant (IHOP?) - Transit-supportive development concept New bank/office location, new restaurants, and library expansion with integrated uses New residential along 64 th Terrace and senior housing on existing bank site

33 Final Redevelopment Scenarios Scenario D+: All components of Scenario D incorporated Relocated library into the mixed-use retail district on the K-Mart site New mixed-use residential with retail on the existing library site

34 Existing Transit Service Area service by Johnson County Transit Route Antioch to Downtown From Santa Fe & K-7 to Downtown KCMO 20 total trips Route Midday From the Great Mall to Downtown KCMO Two trips


35 Future SMP Transit Opportunities Lower Intensity Transit A B


36 Future SMP Transit Opportunities Higher Intensity Transit Potential Integrated Mixed-Use C D D+


37 Future SMP Transit Opportunities Examples of Transit Integration within Mixed Use Development Del Mar Transit Station Pasadena, CA Downtown Transit Center Wichita, KS Metro Downtown Transit Center Kansas City, MO TriMet Transit Stop Portland, OR Chicago/Lake Transit Center, Metro Transit Minneapolis / St. Paul, MN


38 Finance Analysis Envision Tomorrow - Integrated Land Use + Development Planning Analysis of Alternative Scenarios - Base vs Subsidized
39 Scenario Modeling Envision Tomorrow Development Planning Model Land Uses and Square Footages Land and Development Costs Debt / Equity Financing Assumptions Residents, Jobs, Parking, and Many Other Outputs Property Values and Taxes Generated Sales Volumes and Taxes Generated Subsidy Needed to Reach 12% Return on Investment May 21, 2013 RESULT = Realistic Benchmarking of Project Feasibility


40 Scenario Modeling May 21, 2013

41 Scenario Modeling May 21, 2013

42 Scenario Modeling Fiscal $/yr $/acre $/yr $/acre $/yr $/acre $/yr $/acre Property Tax Revenue $ 542,811 $ 30,223 $ 1,230,208 $ 55,554 $ 1,665,986 $ 72,725 $ 1,782,197 $ 77,798 Sales Tax Revenue $ 3,458,707 $ 192,578 $ 3,789,887 $ 171,146 $ 2,439,804 $ 106,504 $ 3,301,504 $ 144,119 May 21, 2013

43 Scenario Modeling May 21, 2013
44 Scenario Analysis Subsidy Subsidy Range of $4.9 - $12.2 Million is Benchmark Only Uses conservative assumptions for debt and equity Actual need expected to be lower in Scenarios A and B Less complex; little / no structured parking; more likely to be completed in shorter timeframe than more complex and dense Scenarios C and D Any actual subsidies will be based on detailed Proforma and But For Analysis; May 21, 2013 Cost-Benefit Evaluation, and City Negotiation of Specific Terms and Conditions
45 Scenario Analysis - Infrastructure Site Civil / Internal Utilities: Est. Range of $2 6 Million Bury SM Parkway Electric Lines: Est. $1 Million Concepts C & D Slater Underpass: Est. $3.7 Million Likely also limited scope of traffic control improvements need to fine tune estimates relative to Site Civil estimate Estimated Infrastructure Cost Range: $3 11 Million May 21, 2013
46 Scenario Analysis TIF Capacity Initial Finding: All Four Scenarios Generate TIF Adequate to Fund Subsidy and Infrastructure Costs Excess TIF capacity with Scenarios A and B Closer to break-even capacity with Scenarios C and D Ability to utilize Revenue / Pay-Go financing in lieu of General Obligation more so with Scenarios A and B Along with estimated Development Values, the Timing of Construction / New May 21, Tax 2013 Value and Subsidy / Infrastructure Costs are Key Variables in TIF Capacity
47 Scenario Analysis Analysis does not Quantify City I-35 Corridor TIF District Capacity to Bridge Short-Term Funding or Timing Gaps Additional Tools to Supplement / Reduce City TIF: Franchise and Development Fees Community Improvement Districts (CID) Benefit Districts, Special Drainage Districts, Other Possible Enterprise Revenues May 21, 2013 Selective Funding Programs: County, State, Federal
48 Next Steps Scenario Modeling Refine Scenario Model Analysis Further: Private and Public Redevelopment Costs Development Timing Variables Property and Sales Tax Increment Public Financing Scenarios I35 Corridor TIF Capacity Non-City Tax Funding Options May 21, 2013 Verify: Public Resources > Public Participation Needs


49 Design Guidelines (in-progress) Five Primary Categories Architectural Character Site Design Landscape/Amenities Sustainability Streetscape (Public)


50 Next Steps Draft Report + City Coordination: Late November Future City Adoption: Anticipated Early 2014
51 Community Meeting Meeting #3 THANK YOU! October 23, 2013