INTRODUCTION 1. When manufacturing processes of products being examine through customer s perspective, we will be able to identify 2 types of processe
|
|
|
- Abraham Stokes
- 5 years ago
- Views:
Transcription


1
2 INTRODUCTION 1. When manufacturing processes of products being examine through customer s perspective, we will be able to identify 2 types of processes, the Value-Added and Non-Value Added. 2. The later is WASTE or MUDA because this is what customer does not pay for. 3. Employees must be trained to look for waste as well as eliminate waste.
3 9 TYPE OF WASTE Un-used Staff creativity Waiting Inventory Unnecessary investment Over production Motion Processing Transportation Defect Note: Waste Muda in Japanese
4 MUDA of OVERPRODUCTION MUDA of OVERPRODUCTION result INVENTORY!!! Always shortage of storage space, more stores, manpower, reduce cash flow. WHY? 1. Production not based on TAKT TIME 2. Cycle time HIGH, 3. Are there frequent breakdown in the line, 4. Is it large batch production, 5. FEAR of delayed deliveries, 6. Poor production leveling.
5 MUDA of WAITING MUDA of WAITING utilization result loss of production, efficiency, Types of WAITING 1. Waiting for material No supply, shortage, no information 2. Waiting for man Absenteeism, shortage, low outputs, bottlenecks 3. Waiting for machine Breakdown, long changeover, long processing line, unbalance line, batch process.
6
7
8
9
10
11
12
13
14 EMPLOYEE RESPONSIBILITIES 1. Genchi Genbutsu being at the actual place and see what and where is the waste. 2. Identify Waste. 2.1 Ask why problem occurs 5 WHY.s 2.2 Solve problems.
15 INITIATIVES 1. Value Stream Mapping (VSM) 2. First In First Out ( FIFO) 3. Continuous Line Balancing and Cycle time Improvement 4. Ergonomics / Motion Study 5. Capital Investment Study
16 VALUE STREAM MAPPING 1. VSM is a tool used to map the value (and non-value) stream of processes, material or information flows for any manufacturing or administrative process. 2. VSM enables to identify and eliminate waste, thereby streamlining work processes, reducing lead times, reducing costs, improving space utilization and increasing product quality. Stamping Welding Painting Assembly WIP Store Staging Staging Inspection RM Store FG Store Value-added time Non-value-added time (Waste) Raw Material Throughput Time Finished Goods
17 METHODOLOGY Calculate the takt time based on customer demand: Takt = Available time per period (second) / Customer demand per period (piece) Identify waste for improvement opportunities and select the lean initiatives or tools to eliminate or reduce waste from the value stream including but not limited to : Kanban 1 pc Flow Work Cell Information Flow Improvement Small Batch Production Leveling Workplace Organization SMED 5 S Poka Yoke Autonomation Multi skilled Workforce Total Productive Maintenance The future state map represents a significant change compared to the current processes. When developing the future state map, set the throughput time and lead times goals and prioritize the improvement items. The most urgent needs typically can be accomplished in a short time with utilization of appropriate resources. Create action plan for improvement. Implement the action plan for improvement and progress is monitored and reviewed periodically until the set goals are met. Adjustment is made whenever required. The VSM is recommended to be carried out continuously as part of continuous improvement program.
18 DEVELOPING VSM 1) Develop current state map 5) Implement improvement Continuous Improvement 2) Analyze current state map 4) Develop future state map 3) Identify improvement opportunities Prior to conducting VSM, establish products and services matrix. Choose product/service or a family of products/services that can be immediately transformed. When mapping the current state of material or information flow, it is best to walk and draw a visual presentation of actual path of flow on a layout known as spaghetti diagram. During the VSM at gemba, measure cycle time and distance traveled and counting inventory (if available) for each process. Conduct an analysis on the data collected on current state map. The Value-Added Ratio (VAR) for current state can be calculated using this formula: VAR = Value Added Time / Throughput Time
19 Current State VSM MAP

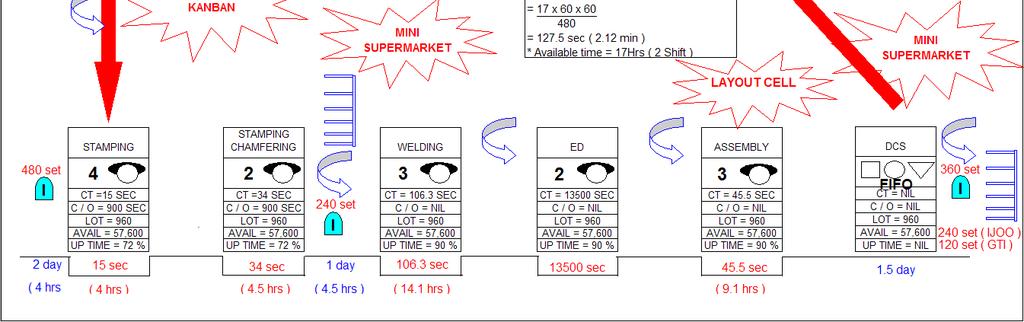
20 VSM MAP Future State
21 VSM MAP
22 FIFO What is FIFO? 1. FIFO (an acronym for First In First Out) means what is received first shall be used first. 2. A tool for inventory management. 3. There are three types of inventory (stock) that a business can hold: a) Stocks of raw materials (inputs brought from suppliers waiting to be used in the production process) b) Work in progress (incomplete products still in the process of being made) c) Stocks of finished products (finished goods of acceptable quality waiting to be sold to customers)

23 FIFO Benefit of FIFO To rotate stock so that it remains in good condition for the consumers. To reduce returns and inventory write down. Implementing FIFO will prevent: 1. Use of obsolete parts 2. Non-moving / dead stocks 3. Quality degradation due to inactive use 4. Poor traceability of parts Figure 12.0
24 FIFO FIFO Add more beneficial pix / samples First In First Out A A A A A A B B B B B B C C C C C C D D D D D D E E E E E E FIFO - Push out Store according to product lines Sliding transport Figure 13.0
25 Continuous Line Balancing and Cycle time Improvement A balanced line: Promotes one piece flow Avoids excessive work load in some stages (overburden) Minimizes wastes (over-processing, inventory, waiting, rework, transportation, motion) Reduces variation


26 Unbalanced Line Work Station 1 Work Station 2 Work Station 3 Work Station 4 Undesirable waiting

27 B a l a n c e d L i n e Work Station 1 Work Station 2 Work Station 3 Work Station 4 Promote one piece flow Avoids overburden Minimizes wastes Reduces variation
28 L in e B a la n c in g p r e r e q u is it e s Prior to balancing a line we must: Determine the required workstation cycle time (or TAKT time), matching the pace of the manufacturing process to customer demand Standardize the process
29 Ergonomics and Work Methods Ergonomics is the study of the interface between man and machine Often called human factors Operator input to machines Feedback to operators
30 Ergonomics and Work Methods The work environment Illumination Noise Temperature Humidity


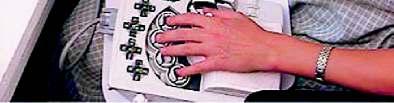
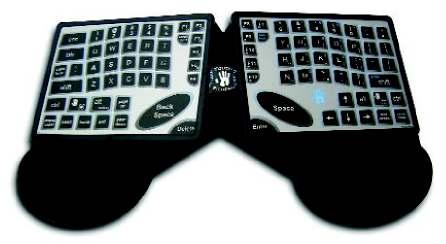
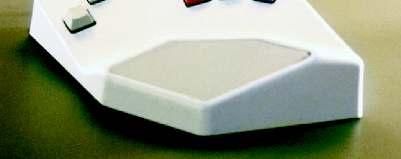
31 Job Design and Keyboards
32 PULL SYSTEM WASTE ELIMINATION FLEXIBILITY PRODUCTION LEVELLING STANDARDISATION QUALITY RIGHT 1 ST TIME EVERY TIME 5 2 AMS 9 PRINCIPLES VISUAL MANAGEMENT TOTAL EMPLOYEE INVOLVEMENT & DEVELOPMENT 1 LONG TERM BUSINESS THINKING 4