Executive Dashboard. Executive Dashboard is a powerful business intelligence tool that allows owners, managers and executives to:
|
|
|
- Felicity Phillips
- 5 years ago
- Views:
Transcription
1
2 Executive Dashboard Executive Dashboard is a powerful business intelligence tool that allows owners, managers and executives to: Easily see trends that exist within the data that is imputed into PestPac. Compare performance on all key metrics against past performance and budgets Improve organizational efficiency by providing snapshots of performance for customer service representatives, technicians and salespeople. Produce all reports in multiple formats (tabular and chart) and export professional, formatted versions of each report to Excel or PDF formats.
3 Executive Dashboard Important Things To Know Before You Dive In: Use Dashboard in the Branches Lookup Table for each user accessing the Executive Dashboard must be checked. While logged into the Dashboard, you can click on Help in the top right-hand corner of the module to get more information about the options and functionality available within each report. Data is not real-time it caches nightly. What does this mean? The Dashboard caches years of historical data each night, which greatly improves the speed at which reports can be generated, sorted and filtered. Note that while caching improves speed, it does result in small data discrepancies between PestPac reports and Dashboard reports from time to time. Once the data caches that evening, the reports will again be in sync.
4 Executive Dashboard In order to fully utilize all of the reports in Dashboard, you must fill out the following lookup tables and enter in data in the fields the lookup tables correspond with. Service Budgets: the Revenue and Budget Reports use this lookup table. You may enter them company wide or by branch. Branch is suggested for multi-branch companies. Sources: the Marketing Return on Investment (ROI) report uses this lookup to calculate the return you get on your investment in marketing sources. You may enter in sources on leads, locations and service orders. Quotas: the Sales vs. Goal report uses quotas. Quotas may be entered by going into the employees lookup table, selecting an employee and clicking on the gold quotas button. You may enter in quotas for specific service classes and/or services for each month of the year. Branches: In the branches lookup table, you must check the box that says Use Dashboard in order for that branch to be included in Executive Dashboard.
5 Executive Dashboard While the Dashboard provides a wide range of powerful reports, the following reports have proven to be most popular and valuable with current Dashboard users: Renewal Retention: Holding on to your existing customers is critical, this report allows you to quickly see how many customers have renewed by service, branch and time period and to compare that against prior periods Service Completion Report: See month-to-date completion rate for each route. Proactively see which routes and technicians are behind and get them back on track before you get a month end surprise Bill-To Credit Status Report: Keeping track of credit status is critical and this report allows you to quickly view credit status, collection and auto-bill stats all on one screen Marketing ROI Report: Quickly see where leads are coming from, how your team is closing those leads and how your costs compare to the proposed revenue by advertising source Projected Revenue vs. Budget Report: Combines a service order list and an invoice list in one easy to read report Customer Statistics Report: See how many active customers are in the system along with the percentage of customers who have contracts and renewals Enhanced Sales and Production and Detailed Daily Summary Reports: Compare variance to budget over different time periods and view each technicians daily route Contract Length Report: See how long you ve had your customer base
6 Executive Dashboard By the end of this presentation you will: Learn the key features of Executive Dashboard Learn how to set up the different options available throughout the dashboard See samples of every report available in the Dashboard Have the ability to save commonly run reports to Report Gallery Have the ability to create slideshows of the reports in the Dashboard
7 Executive Dashboard The following slides will show you the key features that exist within Executive Dashboard for all of the Standard Reports (excluding Flex Reports)
8 The Dashboard reports are split up into seven categories and a Saved Reports menu. To see the individual reports within each category, hover you mouse over the category.

9 Hide/Show the left hand toolbar by using the icon. The menu on the left had side of the screen is expandable and allows you either to choose all items under each category or choose some of the items under each category. You can use this sidebar in any report to change the information that is viewable on the report. **Please note that not all of these sidebar options are available for each report.**
10 This example shows that only the Main Branch is selected and the AJ and CT service classes are selected. You can select individual items by clicking on them. As you change your criteria, the screen you are on will automatically refresh according to the current selections that are made.
11 In many of the reports, you can choose from the output formats below. They are : Data Mode (above) Chart Mode (next slide) Save to Report Gallery Export to Excel Export to PDF


12 There are two different types of bar charts that are used within dashboard. They are defaulted depending upon the report selected. These charts allow you visually to see data and easily make decisions regarding that data.

13 It is recommended that you do not use chart mode on the more complicated reports such as a sample flex report that has three group by options as these reports can become unreadable.

14 In this section of the screen, you can select how you want to view the report. You can also choose from different Formats including Count or Dollars in many of the screens.

15 This is a sample Bill-to Credit Status report. In many of the reports, you can drill down into the numbers to see an even more detailed report. On the next screen, you will see a sample report if the total under the Bradley Branch is clicked on.
16 Detailed Bill-To Credit Status report in Detail mode after drilling down into the number on the previous slide.

17 By clicking on the column headers in any report, it will sort by that column.
18 The Options menu houses all of the choices you can select from throughout the Executive Dashboard.
19 You can define which report you will see when you log in and when you click on each of the report categories. You can define Company Wide Data Options including sales tax, voided invoices and A/R options. You can choose whether or not to Participate in Benchmarking. You can choose which options you want to see on the left hand menu for your Filter Options. Data is cached (or updated) nightly. Any changes made during the day will update that night.
20 Standard Reports Review The next set of slides will go through the Standard Reports in Executive Dashboard


21 From the Reports menu, select Executive Dashboard. Enter your company key, username and password. Click on Go to login.
22 Business Statistics Reports
23 Hover over the Business Statistics tab to see the reports under that category.

24 The Bill-To report displays statistics about your bill-to customers in PestPac. One Bill-To with multiple service locations is counted once on this report.

25 The Customer Statistics report displays statistics about your customers in PestPac. A service location is considered one customer. This report allows you to see the number of total active customers and percentages of those with contracts and/or renewals.

26 You can drill down into these numbers to see a tech s entire route for the day. The Daily Summary Report is divided into three sections including Key Metrics statistics, Accounts Receivable statistics and Service Orders for Today statistics.
27 Sales & Leads
28 Hover over the Sales & Leads tab to see the reports under that category.

29 The Leads Report displays the number and dollar value of sales leads entered in PestPac. This report shows the total number and dollar value of leads, as well as the ratio of leads that are currently open, won and lost. This report can be used to evaluate performance as well as help establish future sales goals.

30 The Leads by Month report displays either the number of leads or the proposed value of Leads for each month. Each View By category will be listed in a row, with rows below it listing proposed, won, lost and open leads. Dollar value totals are displayed in thousands of dollars and represent the proposed value of the lead. The Leads by Month report can be used to compare current and past performance and identify seasonal changes in your business. The information on this report can be used to help establish future sales goals based on past precedents for a particular month.
31 The Marketing ROI Report can be used to evaluate the return on your marketing investments by showing the cost to close a sale vs. the revenue you will receive from the sale. Please note that you must have Budget and Lead cost information for your Sources and enter this information on Leads in order to utilize this report.

32 The Sales vs. Goal compares sales performance relative to sales goals (quotas). Sales goals are read from the Sales Quotas entered for each employee. To enter a add or edit a quota in PestPac, select the employee in the Employee Lookup table and click the Quotas button. Quotas are entered for each employee by Service and Month.
33 Production
34 Hover over the Production tab to see the reports under that category.

35 The Service Completion report displays totals for work completed, posted as not serviced, rescheduled and open based on Service Orders and Invoices in PestPac. This report displays totals as a count or dollar value, depending on the format selected.

36 For each month of the year, the Service Completion report displays totals for work completed, posted as not serviced, rescheduled and open based on Service Orders and Invoices in PestPac. This report displays totals as a count or dollar value, depending on the format selected.
37 The Technician Production report displays totals for services completed in PestPac as well as the total of call back services and production based on dollars per hour. This report can be used to identify areas where call back services are needed on a regular basis as well as areas where production is highest and lowest.
38 Revenue & Budget
39 Hover over the Revenue & Budget tab to see the reports under that category.

40 The Payments Report shows payments made within the specified Date Range selected. The report is divided into regular payments, prepayments and renewal prepayments.
41 The Projected Revenue vs. Budget report can be used to compare expected revenue to projected sales goals. This report displays revenue based on invoice totals and projected revenue based on scheduled Service Orders in PestPac. Budget figures are based on budget information populated in the Service Budgets Lookup Table in PestPac. The purpose of this report is to help you determine if expected sales goals will be met, based on services performed as well as those scheduled to be completed by a certain date.

42 The Revenue by Month report displays total revenue by month. Revenue is based on invoices totals from PestPac. It can also be used to identify seasonal highs and lows in revenue. This report can be used to establish future sales goals based on the amount of revenue typically earned in a given time period.

43 The Revenue vs. Budget report can be used to compare projected sales goals to actual revenue. This report displays revenue based on invoice totals and displays budget figures based on information populated in the Service Budgets Lookup Table in PestPac. The report displays totals for the Month, Quarter and Year to Date for each View By category and the variance between revenue and budget in either dollars or a percentage.

44 The Revenue vs. Prior Year report can be used to compare your revenue and budget for the current year compared with the same period in the prior year. This report displays revenue based on invoice totals in PestPac. Budget figures are based on budget information populated in the Service Budgets Lookup Table in PestPac.
45 Retention

46 Hover over the Retention tab to see the reports under that category.

47 The Contract Length report displays either the count or dollar value of recurring services broken up by the length of time those services have been active. You have the option to include Service Setups, Renewals or both. This report can be used to help determine the level of customer satisfaction based on the length of time clients choose to receive your services.

48 The Contract Statistics report displays the number or dollar value of recurring services and the amount of annual revenue those services generate. You can choose to include Service Setups, Renewals or both.

49 The Gain/Loss Report displays gain and loss counts and dollar value for recurring Service Setups. Gains include Service Setups that have been added, un-cancelled or reactivated. Losses include Service Setups that have been deleted, cancelled or deactivated. The Gain Loss Report can be used to evaluate increases and losses in recurring business based on Service Setups added and removed in PestPac as well as price changes. This report allows you to see if you have a net gain or loss for a particular date range and how much of this can be attributed to changes in the amount of recurring business versus changes in price for existing recurring services.
50 The Renewal Retention report displays the total number of renewals for a given Date Range as well as the dollar value or count and percentage of renewals that are unpaid, renewed or cancelled. The figures are representative of Renewal setups in PestPac, based on the Start and Renewal date fields. This report can be used to evaluate customer retention in the area of renewals. Using this report, you will be able to see if most customers are choosing to renew their contract or if you are experiencing a high volume of cancellations.

51 The Renewal Retention by Month report displays the total number of renewals for a given Date Range for each month, as well as the dollar value or count and percentage of renewals that are unpaid, renewed or cancelled. The figures are representative of Renewal setups in PestPac, based on the Start and Renewal date fields. This report can be used to evaluate customer retention in the area of renewals. Using this report, you will be able to see if most customers are choosing to renew their contract or if you are experiencing a high volume of cancellations.
52 Flex Reports Review The next set of slides will go through the Flex Reports in Executive Dashboard. The Flex reports are extremely customizable in regards to format of the reports and the data included in the report. The first set of slides will go over how to customize Flex Reports and the second half of this section will go over what data is contained in each Flex Report.
53 Overview All of the Flex Reports use the same concepts to customize each report.
54 The highlighted section above contains the Report Options on the screen for Date Range, Fields, Results per Page and Toggle Pre-filter. Use the Hide Report Options link to hide this area of the screen.

55 The Choose Display Fields link, when clicked, shows the pop up above. These are all the fields available to display and group by on the report.
56 The highlighted section above are all of the filters on the report. You can add additional fields to filter by clicking on the Choose Display Fields link and dragging and dropping the field into this row s area. Please note that you use see two white arrows above and below the field to confirm it will be dropped successfully there. Use the filters to filter out information you do/do not want. For example, if you only wanted to view Call Back orders, you would click on the arrow on the Order Type field and uncheck all order types other than CB.

57 The highlighted section above and to the left is the area where you can drag and drop column headers to add to the report. They directly correspond with the highlighted column headers above and to the right. Remove column headers by right clicking on them and selecting hide. Please note that column headers should only be data fields such as count, total, subtotal, tax, etc.

58 The highlighted area above shows where you can drag and drop display fields to group by column. In the example above, the display field, Date-Original Work Date Quarter, has caused the report to be split up into 1 and 2 or Quarter 1 and Quarter 2.
59 In the highlighted section above, you can drag and drop rows to group by. Above, the display field of Branch-Order Branch has caused the report to display the Main Branch and Second branch s grouped by information.
60 Flex Reports The next set of slides will go through the individual Flex Reports available.

61 The Device Flex report allows you to set up a report where you can view virtually all of the information collected about devices at customer properties. Use the Display Fields to drag and drop column headers, filter and group by options.

62 The Invoice Flex Report allows you to create customized reports based off of the invoices in your database. Use the Display Fields to drag and drop column headers, filter and group by options.

63 The Lead Flex Report allows you to create reports based off of virtually all the information contained in your Leads. Use the Display Fields to drag and drop column headers, filter and group by options.

64 The Location Flex Report allows you to create reports based off of information about each Location in your database. Use the Display Fields to drag and drop column headers, filter and group by options.

65 The Material Flex Report allows you to create different reports based off of Material applications that you record within PestPac. Use the Display Fields to drag and drop column headers, filter and group by options.

66 The Service Order Flex Report allows you to create reports based off of your pending Service Orders that have not been posted yet. Use the Display Fields to drag and drop column headers, filter and group by options.

67 The Service Setup Flex Report allows you to create reports based on all the Service Setups in PestPac. Use the Display Fields to drag and drop column headers, filter and group by options.

68 There are several pre-built reports in the Flex Reports menu. Hover over the Flex Reports, then hover over the Pre-Built Reports section to choose one of the pre-built reports.
69 Advanced Reporting Options The next set of slides will go through the Report Gallery, Slideshow, Google Analytics and Benchmarking features in Executive Dashboard.
70 Report Gallery


71 When you click on the Save icon to save any report to Report Gallery, you will see the pop up below. Type in a Name for the report, whether it s Private or viewable by Branch or Company. If you click on Set as Default Report, this will be the report that you see when you click on the category tab.
72 When you view the saved report, the title at the top of the report changes to the name you saved it as.
73 Slideshows The next set of slides will go through how to create slideshows. You must have reports already saved in Report Gallery to create a slideshow.

74 Click on Options to go to the slideshow menu.

75 From the Select Slideshow dropdown, choose Create a New Slideshow.

76 Enter a name for the Slideshow then click on the Save icon.
77 Use the Add Report dropdown to select which reports in Report Gallery you would like to add to the slideshow. Click on the + icon at the end of the field to add it to the Slideshow Contents section of the screen.

78 If you want to change the order of the reports in the slideshow, click on the report you want to change and use the up and down arrows to move the report. If you want to delete a report from the slideshow, click on it and then click on the red X at the bottom of the Slideshow Contents section. If you want to delete the entire slideshow, select the slideshow from the Select Slideshow dropdown and click on the red X at the end of the field. If you want to play the slideshow, click on the blue arrow at the end of the Select Slideshow dropdown.

79 When playing the slideshow, use the blue arrows on the right side of the screen to navigate forward or backwards through the show.
80 Google Analytics The Google Analytics feature in Dashboard allows you to integrate your existing Google Analytics account and create reports from it in Dashboard. Google Analytics is a free service offered by Google that generates detailed statistics about the visitors to a website (such as your company s website, customer account access site, etc). You can sign up for this service here.

81 Under the Business Statistics Reports, you can select Google Analytics. Click on the Access Google Analytics button to be brought to Google s login page where you can grant Dashboard access to your account. Please note that you must have an existing Google Analytics account to use this feature.
82 Benchmarking Benchmarking allows you to see how your company compares with other companies in the United States.

83 If you would like to participate in Benchmarking, select Yes under the Benchmarking dropdown in the Options menu. If you choose to participate in Benchmarking, your data will remain anonymous.

84 Use the green pencil icon under the Goal column to enter in your goals for each category. The current year and previous year s information will be displayed along with how they compared to each category s Goal. The Benchmark column will be filled in with the National average information. There is also a different output format for benchmarking that the user can select by clicking on the gear icon. A sample report is on the next slide.

85 Sample Benchmarking Report using the Gear icon.
86 Dashboard Mobile App The Dashboard Mobile App is included with Dashboard 3.0. It allows managers to see detailed reports that show a snapshot of common statistics so that they can see how the company is doing on a daily basis. This app can be viewed on a web browser from any Smart Phone including iphones and Android models. If you are hosting PestPac on your own server, you can get to Dashboard Mobile by going to external IP)/mobile. If you are using PestPac online and you access PestPac by going to use the following link: If you are using PestPac online and you access PestPac by going to www10.mypestpac.com, use the following link: If you are using PestPac online and you access PestPac by going to east.mypestpac.com, use the following link: If you are using PestPac online and you access PestPac by going to www80.mypestpac.com, use the following link:

87 Login using the same credentials you use with PestPac. The Main Menu is divided into sections. Tap on them to see all of the reports within that section.
 and Year to")
88 New Contracts The New Contracts section allows you to view contracts created within the last Month to Date (MTD) and Year to Date (YTD)
89 New Contracts for the Company New Contracts by Branch

90 New Contracts by Division New Contracts by Service Class

91 New Contracts by Service New Contracts by Location Type

92 Invoices The Invoice Reports allow you to see information about MTD and YTD Invoices.
93 Invoices by Company Invoices by Branch
94 Invoices by Service Class Invoices by Service
95 Payments The Payment Reports allow you to view payments made today, MTD and YTD.

96 Payments by Company Payments by Branch


97 Payments by Method of Payment Payments by Service Class

98 Payments by Service

99 Leads The Lead Reports allow you to view reports for Today, MTD and YTD.

100 Leads by Company Leads by Branch

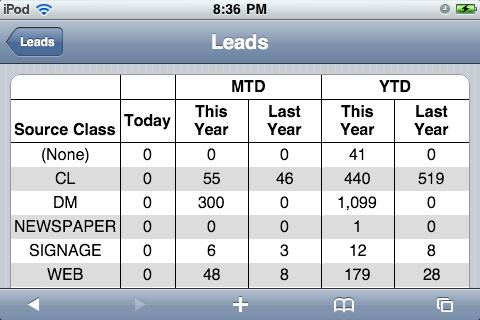
101 Leads by Source Leads by Source Class
102 Leads by Service Class Leads by Service

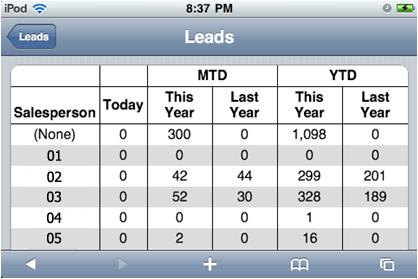
103 Leads by Pending Event Leads by Salesperson

104 Leads by Status
105 Sales vs. Goal The Sales vs. Goal reports allow you to see how your sales compare with Sales Quotas that are set up for your Employees through the Employees lookup table.


106 Sales vs. Goal by Company Sales vs. Goal by Branch

107 Sales vs. Goal by Salesperson

108 Service Completion The Service Completion reports allow you to look at the current count and dollar amount of services that were due during the current month and what percentage of those services have already been completed.

109 Service Completion by Company Service Completion by Branch

110 Service Completion by Technician

111 Work for Today You can view technician s scheduled work for Today by clicking on their default Branch. Click on the Technician whose schedule you want to see.

112 The information to the left will be displayed for each stop the technician has scheduled for today. Scroll up/down to view the different appointments.
113 Executive Dashboard This concludes the Executive Dashboard presentation. If you have additional questions, please contact our office at or by using the support option within the software.