Lawrence Henze Nicole Bechard. March 29, 2011
|
|
|
- Clyde Parker
- 5 years ago
- Views:
Transcription
1 Target Analytics Fundraising Models Lawrence Henze Nicole Bechard March 29, 2011
2 Today s Agenda Target Analytics and Blackbaud Predictive Modeling for Direct Marketing Predictive Modeling for Donor Development Questions and Answers

3 About Us Target Analytics, a Blackbaud Company since 2001 Backed by Blackbaud s reputation and experience More than 25 years of practical experience exclusively with nonprofits Superior software and services from one source Donor predictive modeling Prospect research tools such as wealth screening and prospect management software Donor benchmark comparison reports and program assessments Integration with The Raiser s Edge and BBEC With the addition of NOZA, we ve added more prospect research solutions, such as file screening and subscription to the searchable database of over 50 million gifts Our Mission Help nonprofits maximize fundraising results at every stage of the donor life cycle!


4 MJ2 Target Analytics has helped almost 3,500 organizations American Cancer Society National Baseball Hall of Fame Stanford University Brown University Harvard University The Metropolitan Museum of Art Habitat For Humanity International American Breast Cancer Foundation Mayo Clinic World Society for the Protection of Animals American Junior Golf Association Christian Broadcasting Network healthcare human services k-12 private schools higher ed cultural recreation/social religious
5 Slide 4 MJ2 UPDATE THE LIST OF ORGS, DOES 2,500 WORK? Meredith Johnson, 12/02/2007


6 Supporting the Donor Pyramid Maximize fundraising results at every stage of the donor life cycle with the help of Target Analytics
7 Predictive Modeling for Direct Marketing
8 Proactive Research Begins With Data Mining Data Mining: Automated or manual extraction or query of information from a constituent database: segmentation analysis, correlation studies, descriptive predictive modeling Predictive Modeling: Discovery of underlying meaningful relationships and patterns from historical and current information within a database; using these findings to predict individual behavior
9 The Benefits of Data Mining and Modeling A comprehensive view of your database Jump starting prospect identification and classification Potential cost savings Clean your database Understand donor/non-donor characteristics Create cost-effective appeals Increase gift revenues Staffing and resource allocation Knowing your institution, turning knowledge into results
10 Limitations with House File Data Donor Inform mation New to File Minimal data Difficult to predict donor behavior Active Donors Abundant data Models can help optimize giving amounts and frequency Lapsed Donors Old data Less predictive donor behavior Warm Prospects Very little data Can t differentiate responsive donors from non-responsive donors Deep Lapsed Donors Very old data Obsolete for meaningful selects Warm Prospects Active Donors Lapsed Donors House File Segment


11 Solving House File Challenges: The Coop Component
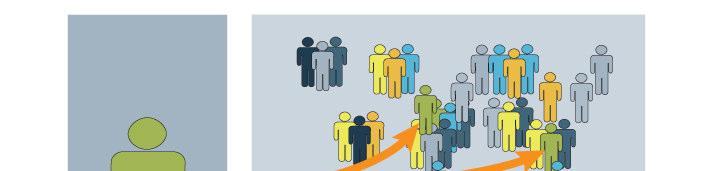
12 Building Models with the Nonprofit Cooperative Database The models spread and sort the larger donor population into smaller groups ranked by relative response rates Donor universe before applying models Likely and unlikely responders mixed together limits ability to treat donors differently Donor universe after applying models Likely and unlikely responders identified and separated into manageable groups Most likely to respond: Target Model Applied Least likely to respond:
13 Building Models with the Nonprofit Cooperative Database o Some model variables can be fairly straightforward (RFM): Days since last gift Total number of gifts ever Size of last gift Etc... o Many variables are complex measurements of trends created from the basic data elements on both your file and the Coop: Recency of giving across organizations, relative to others on your file The importance, or lack of importance, of disaster giving over time Change in the pace and trajectory of giving over multiple years Trend in relative giving to various types of organizations Ratio of premium gifts over non-premium gifts Giving density in the past 2, 5 or 10 years Share of wallet at your organization Giving during trying economic times Seasonal Giving
14 Building Models with the Nonprofit Cooperative Database Using Target Tags with a straight forward approach will increase revenue and response rates > Contact higher Tag-ranked donors more frequently < Contact lower Tag-ranked donors less frequently Tag Score Contact Frequency A High Appeal as frequently as possible without annoying donors B C Medium High Appeal frequently D E Medium Determine optimal frequency based on response rates F G Medium Low Reduce the number of appeals H I Low Appeal infrequently or not at all for an entire year.
15 Overcoming Challenges with Warm Prospects Problems Warm prospects populations are tough to segment. Performance from prospect files is often lower than anticipated. Solution Using outside philanthropic data from the public domain and the Coop, models can be built that identify prospects more likely to respond. With these models, segments are formed that rank the relative responsiveness of these warm prospects. Efficiencies are created by focusing more efforts on segments with more responsive prospects and less on segments with the least responsive.
16 Overcoming Challenges with Warm Prospects Select responsive prospects from marginal prospect lists for higher returns with less waste with Donor Conversion Tags. Model applied to advocacy warm prospects Target Tag Qty Quantity Response Available Mailed Rate A1 23,500 19, % A2 23,500 19, % A3 23,500 20, % B1 23,500 26, % B2 23,500 19, % B3 23,500 20, % C1 23,500 19, % C2 23,500 14, % C3 23,500 15, % D1 23,500 7, % D2 23,500 8, % D3 23,500 13, % E1 23,500 8, % E2 23,500 4, % E3 23,500 12, % Model applied to event participants Tag Total Total Total Average Available Mailed Responses RR A 128,143 93,526 1, % B 216, ,127 1, % C 224, ,560 1, % D 224, , % E 224,371 32, %
17 Overcoming Challenges with Lapsed and Deep Lapsed Donors Problems Outdated information on former donors require greater precision in direct mail efforts Mailing more often to lapsed donors who are most likely to return will help streamline these efforts RFM can only go so far in lapsed populations, especially in deep-lapsed donors where the RFM is too old to be useful. Solution Use external giving data as well as your organization's own transactional histories to dive deep into lapsed donors behavior. As with many of the house file models, the scores allow you to alter your contact frequency strategy. Discover who to mail more and who to contact less
18 Efficiency with Lapsed and Deep Lapsed Donors: Identify the best prospects for reactivation amongst your lapsed donor population with Lapsed Tags. Tag Total Total Average Total Mailed Available Responses RR A 146, ,746 1, % B 146, ,475 1, % C 146, ,623 1, % D 146, , % E 146, , % F 146, , % G 146, , % H 146, , % I 146, , % J 146, , % Total: 1,468,853 1,114,604 8, %

19 Contact Strategy Using Lapsed Target Tags Overall performance improves with segment and contact strategies by score
20 Predictive Modeling for Donor Development


21 Reality Check What Shape is Your Pyramid?

22 Pyramid Power
23 Defining Mid-Level Giving for Modeling o Mid-Level Giving falls between annual fund (or direct marketing) and major giving o Prime Upgrades are ready to move from Annual Giving into Mid-Level Giving o Transitional Donors are traveling up the pyramid to Major Giving Annual Giving Major Giving Prime Upgrades Transitional Donors
24 Predictive Modeling - How it Works Giving profiles are complex Profiles vary by constituency/organization Profiles vary by giving level/type Giving propensity and capacity are different Propensity and capacity scores will enable you to identify prospects to strengthen your donor pyramid
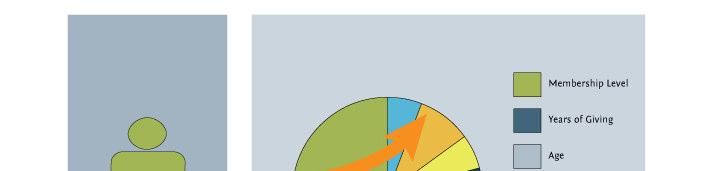
25 Data Mining Internal Data Look for internal and transactional data to tell us donor/nondonor characteristics Internal Age Gender Major Degree Type of Relationship Number of relationships Transactional Membership Premiums Special events
26 Data Mining External Data Adds Depth and Breadth Data appended to your file: Census Cluster data Equifax Niche data Summarized credit data Wealth Hard asset data


27 How Modeling Works: Identify the Action to be Predicted

28 Building the Profile

29 Scoring the Database

30 Most Common Target Analytics Fundraising Models Planned Gift Likelihood Major Gift Likelihood Mid-Level Giving Likelihood Annual Giving Likelihood Target Gift Range Likelihood To Give

31 Target Analytics Provides an Immediate Strategy for Segmentation and Cultivation High likelihood scores and mid-level target giving ranges Implement targeted upgrade, mid-level major and planned gift strategies Increase annual giving Highest scores and high assets Further qualification and research Immediate individual cultivation Low likelihood scores and low target giving ranges Minimize investment Consider reduced resource application Lower likelihood scores, but high target giving ranges and assets Need to be sold on your mission Longer term cultivation

32 Major Giving Model

33 Major Giving Score Distribution
34 Target Gift Range Model The capacity model looks at the inclination combined with the capacity a prospect has to make a gift at a certain level to your organization Gift range projected by the predictive model for a one year period Target Gift Ranges are numbered 1 to 12, from $1-50 to $100,000+ 1: $1 - $50 7: $2,501 - $5,000 2: $51 - $100 8: $5,001 -$10,000 3: $101 - $250 9: $10,001 - $25,000 4: $251 - $500 10: $25,001 - $50,000 5: $501 - $1,000 11: $50,001 - $100,000 6: $1,001 - $2,500 12: $100,001 +


35 Target Gift Range WealthPoint Rating


36 Identified Major and Transitional Giving Prospects
37 Implementation Recommendations Techniques for using scores for assignment Mid-Level Prospects have a high mid-level likelihood and capacity fits in mid-range Prime Upgrades are highly likely but capacity is just below mid-range Transitional giving prospects have high likelihood and capacity just below major giving threshold Prospects with the highest scores are ripe for assignment are poised to move to the next level Assign newly rated prospects to fill pipeline Capacity in Mid-Level Giving Range - 12 months Mid-Level Giving Likelihood Very Good+ Good $1,001-2,500 $2,501-5,000 $5,001- $10,000 $10,001-25,000 $10,000+

38 The Power of Combining Wealth and Modeling A recent study completed by one of our senior statisticians showed that Wealth and Modeling together account for higher gift potential in a database than either method by itself
39 Planned Giving Likelihood Model (PGL) Based on our national research of individuals that have made planned gifts to charitable organizations, your best planned giving prospects have the following characteristics. They: Are past givers to you Tend to be mid-age and older Live alone Live in neighborhoods where many of the residents are retired Maintain high incomes Maintain a low mortgage balance or have paid off their mortgage Do not apply for additional credit Keep their credit balances low even if their credit limits are large Are direct mail responsive

40 PGL Variable Distribution


41 Organizational Publications Use what you have available Seek dedicated internal inventory so that you know the printing schedule and can plan your marketing
42 Summary and Questions Contact: White Papers: /whitepapers.aspx