Operational Logistics Management (OLM612S)
|
|
|
- Roderick Crawford
- 5 years ago
- Views:
Transcription
1 Ester Kalipi (M.LSCM.; B. Hons Logistics; B-tech. BA.; Dip. BA.; Cert. BA.) Operational Logistics Management (OLM612S) Unit 2: Logistics Planning 21 February 2018
2 Table of contents Unit Objectives The role of Forecasting in Supply Chain Planning Demand and Logistics Requirements Planning Forecasting Models Coordinating Operational Plans Application of Material Requirement Planning (MRP) Unit summary References
3 Objectives By the end of this unit, students should be able to: Explain the role of forecasting in the supply chain; Discuss the impact of forecasting at the three levels; (operational, tactical and strategic) of the organization; Discuss the techniques and steps of forecasting; Discuss the application of material resources planning.
4 Logistics Planning At the heart of any organization Starts with sales and operations plans, and plans the input requirements A process relative to the firm s competitive priorities and an important part of managing supply chains The purpose of logistics planning is to make sure that future demand can be satisfied by the company s available resources and to point out situations where demand cannot be met in time or in the desired quantities.
5 Do you know? Demand planning is the key driver of the supply chain. Demand forecasting is the is the wheel that propels the supply chain forward and the demand planner is the driver of the forecasting process.
6 The role of Forecasting in Supply Chain Planning Forecasting: the process of determining the amount of product and related information that consumers will require in the future, either in the short or long term. Forecasting information is important for marketing, manufacturing and logistics management. Marketing forecasts of future demand determines the promotional strategies, allocation of sales force efforts, pricing strategies, market research activities and manufacturing scheduling and resizing. Manufacturing schedules determines the acquisition strategies, plant inventory decisions and right sizing production capacity in line with marketing forecasts. Logistics management forecasts determine how much of each item manufactured by the firm needs to be transported to its various markets.
7 Features of forecasting It is difficult to forecast accurately, indeed impossible. Generate a good forecast and keep the forecast error as low as possible. Forecasting demand a group of items may be more accurate than the forecast demand for a single item. Forecast for a shorter period of time is more accurate than the forecast for a longer time horizon. What happened in the past can be used to as an important guidance when making forecasts
8 Elements of a good forecast Forecasts should be timely Forecasts should be credible and reliable Valid forecasts should be communicated Forecasts should be in a meaningful units Forecasting techniques should be relevant Forecasts should be cost effective. Forecasts should address the uncertainity
9 Forecasting steps: Determine the purpose for forecasting specify the objective clearly. Determine what to forecasts select items and quantity to forecasts Do you want to predict the financial value of sales or unit of sales? Are you forecasting total sales? Sales by region? Choose the horizon is it 1-30 days? 18 months? Select the techniques to use Gather & Analyze the data needed to make the forecasts Make the forecast Implements the results of the forecast Monitor the forecast
10 Types of forecasts used in Supply chain Short-term forecasting (operational forecasting) crucial for day-to-day planning. Patterns may help to determine safety stock levels; production plans that may come from materials resource planning. Shift production schedules may require forecasts of workers availabilities and preferences. Medium-term forecasting (tactical forecasting) measured in weeks or months (up to 18 months). As time period increases, changes in patterns and relationship become more apparent. Economic cycles change from boom periods to recession. Medium forecasts are needed for budget purposes. Forecasts for sales, prices and costs of the whole organization. Long-term forecasting (strategical forecasting) primarily needed for capital expansion plans, selecting research and developments projects, launching new projects, formulating long-term goals and strategies and adpting to environmental changes. Long-term forecasts aim to provide a general direction where the industry or the economy is heading, to identify major opportunities and warn of dangers ahead.

11 What type of forecast involved in the picture below? Back slats Seat cushion Leg supports Seat-frame boards Back legs Front legs A Ladder-back chair
12 Demand and Logistics Requirements Planning The purpose of Demand management is to coordinate and control all sources of demand so the supply chain can be run efficiently and effectively and to ensure products are delivered on. Two basic sources of demand 2.1 Dependent Demand Demand for a product /Service caused by the demand for other product. Demand that can be directly be determined or derived from other products by tabulating or calculating the requirement based on the demand for the product. is demand for component parts or subassemblies. For example, this would be the microchips in the computer, the wheels on the bicycle, or the cheese on the pizza. 2.2 Independent Demand Demand that cannot be directly be determined or derived from other products. Independent demand is demand for a finished product, such as a computer, a bicycle, or a pizza.
13 Independent demand Active Influence To increase demand companies apply pressure on its sales by offering incentives to customer and its own personnel, wage campaigns to sell products /services Passive Response When a firm plays a passive role by simply responding to customer demand
14 Logistics Requirement Planning (LRP) The main function of material requirements planning is to guarantee material availability, that is, it is used to procure or produce the requirement quantities on time both for internal purposes and for sales and distribution. LRP is a scheduling technique which ensures that the right goods are available at the right place, at the right time, and at the right quantities. It is a logical integration of distribution requirement planning (DRP) and material requirements planning (MRP). Distribution requirement planning (DRP) is concerned with allocating finished goods from the factory to the distribution warehouse and customer. DRP is driven by independent demand Material requirements planning- Operates on dependent demand DRP & MRP interfaces at the factory level and close coordination that result in minimal need for safety methods. LRP aims at reducing total inventory in SC by reducing the reliance on demand for all items on forecasting, by scheduling which integrates and coordinates the requirements across the SC for a specified planning period.
15 Forecasting Techniques Qualitative techniques Qualitative forecasting techniques are subjective, based on the opinion and judgment of consumers, experts; they are appropriate when past data are not available. Forecast should not only rely on statistical methods Visionary forecasting-this method uses personal insight, judgement and when possible facts about future events. It is characterised by subjective guesswork and imagination. This method is usually inaccurate, but can be effective if used to adjust forecast based on statistical methods Panel Consensus-based on assumption that several minds are better than one Delphi Techniques- A panel of experts, each of whom is physically separated from the others and is anonymous, is asked to respond to a sequential series of questionnaires. After each questionnaire, the responses are tabulated and the information and opinions of the entire group are made known to each of the other panel members so that they may revise their previous forecast response. The process continues until some degree of consensus is achieved Historical Analogy- Comparing past events that have a similar effect in the recent past to the likely impact of future events
16 Time Series Analysis Forecasting Techniques (Cont d..) A time series is a set of observations measured at successive points in time or over successive periods of time. If the historical data used are restricted to past values of the series that we are trying to forecast, the procedure is called a time series method. Time Series Data is usually plotted on a graph to determine the various characteristics or components of the time series data. There are 4 Major Components: Trend, Cyclical, Seasonal, and Erratic events. The Trend Component-regardless of other fluctuations, sales can increase, decrease or even remain constant. Changes in sales can be caused by technology, changes in taste, and changes in marketing strategies or competition. Long-run increase or decrease over time (overall upward or downward movement), Data taken over a long period of time, Trend can be upward or downward, Trend be linear or nonlinear such as exponential growth. The Cyclical Component-Sales are often affected when customer can have more or less disposable income available. Long-term wave-like patterns, Regularly occur but may vary in length, Often measured peak to peak or trough to trough The Seasonal Component- Short-term regular wave-like pattern, Observed within 1 year, often monthly or quarterly. Usually affected by weather, holidays and general customer behavior. The Erratic Events-data that is irregular and cannot be accurately predicted, such as strikes, floods, fires ECT. These events are random in nature and are difficult to forecast using statistical methods.
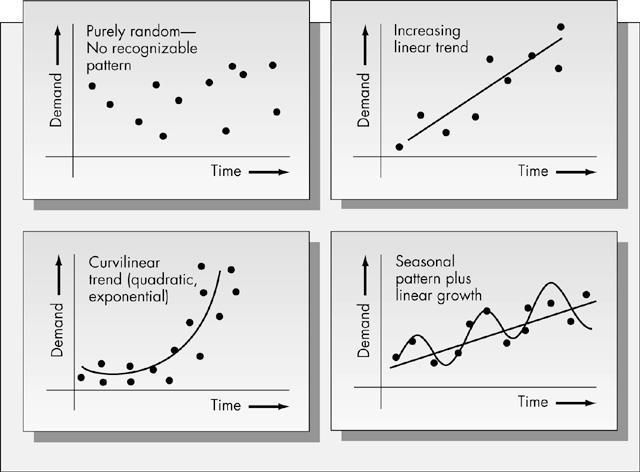
17
18 Forecasting Techniques (Cont d..) Casual Forecasting Casual forecasting assumes that demand is related to some underlying factor/s in the environment. For example an ice cream company using previous week s temperature to determine the impact of demand at the factory. Once this relationship is understood, the demand for ice cream can then be determined reasonably accurate Simulation methods Simulation is the imitation of the operation of a real-world process or system over time. The act of simulating something first requires that a model be developed, this model represents the key characteristics or behaviours/functions of the selected physical or abstract system or process. Simulation is best for analysing systems with multiple sources of variation and interdependencies and balancing resource capacity in the Supply chain. Simulation tools provide animation capabilities to that allow the process designer to see how customers and / or work objects flow through the system.
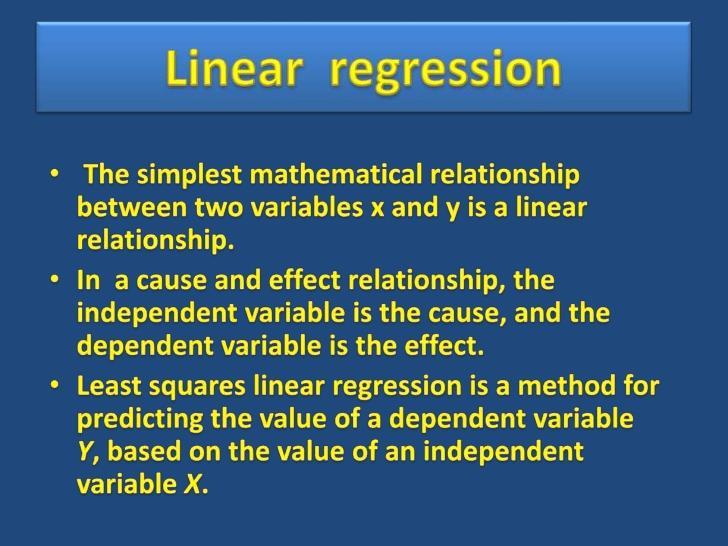
19 Forecasting techniques Forecasting is important for decision making and planning. Statistical techniques: Simple moving average Each time you predict demand we move step by step. Weighted average or exponential smoothing Time series (trend) Analysis Regression analysis Other qualitative and subjective techniques: Marketing or customer research Expert opinions Delphi method
20 Quantitative forecasting Objective Method More scientific, calculation of demand by numerical manipulation. Provides Hard data such as figures for historical demand. Historical data are available on variables that are of interest. Analysis of historical data concerning the time series of specific variables of interest.
21 Simple moving average This method looks at the demand for recent periods and assume that demand for the coming period will be at the average of that experienced in the past. There is rule on how many past periods should be taken into account. Moving average mean each month move along step by step. Simple moving average gives equal weight to each of the figures recorded in previous periods.

22 Exercise 1 Months January 2000 February 3000 March 1000 April 5000 May 2000 June 4000 July???? Demand for beers (Namibia Breweries)
23 Weighted Average Method ( or Moving weighted average) Older figures are less reliable guide to the future than more recent figures. It gives greater weight to the figures experienced in recent months and reduce the weight given to older figures. The weight is not fixed but they must always total of 1

24 Exercise 2:
25
26 Selecting a forecasting model Forecasting model Amount of historical data Data Pattern Forecast Horizon Linear Regression 10 to 20 observations for seasonally at least 5 observations Simple Moving Average Weight moving average & Simple exponential smoothing 6 to 12 months weekly data are often used 5 to 10 observations needed to start Stationary, trend & seasonality Stationary data, no trend or seasonality Stationary data short to medium term Short short
27 Coordinating Operational Plans Forecasts are made through the entire supply chain, but the most important forecast is on demand. This involves the the degree to which the firm can strategically collaborate its forecasting methods in the supply chain to achieve the effective and efficient flows of Product and services, Information, financial resources and decisions with the objective of providing the maximum value to the customer at low cost and high speed. Integration is the alignment and interlinking of business processes, and embodies various communication channels and linkages within a supply network Collaboration is a relationship between supply chain partners developed over a period of time
28 Integration comprises of the following factors: Supply chain uniformity Information Technology Information sharing- all key information is given to all parties Connectivity capability to exchange data timely, responsive and compatible format Standardisation-Common operations designed to be efficient and effective Simplifications Discipline-doing the right action, at the right time, in the right way each time
29 Integrating Forecasting and production Integrating Production and forecasting makes it easy to estimate the future demand for goods and services. It also estimates the resources which are required to produce those goods and services. These resources include human resources, financial and material resources Integration helps estimates the future market or demand for the company s goods and services. And also estimates the human resources, financial resources, Materials, Machines and Methods, which will be required to produce those goods and services. Production and forecasting coordinated estimates the future technological developments. It estimates the customer s needs and preferences along with competitors' strategy in the future. So, production forecasting is an estimation of a wide range of future events, which affect the production of the organization. Production forecasting requires a lot of skill, experience and judgement of the production manager. He must use many statistical techniques and tools to make his forecasts accurate.
30 Integrating Forecasting and production (cont d..) Production forecasting is a combination of objective calculations and subjective judgements. That is, it involves systematic collecting and analyzing past and present data. This is done objectively with the help of statistical techniques and tools. Production forecasting also involves subjective judgement of the production manager. That is, he has to use his intuition and judgement for forecasting. The success or failure of an organization depends upon the accuracy of its production forecasts. All the plans and strategies of the organization are based on the production forecasts. Production forecasts help to reduce the business risks.
31 Sales & Operations Planning (S&OP) Forecasting process Helps to provide customer service, lower inventory and shorten customer lead time, stabilize production rates and help management run operations smoothly. Done on Monthly basis Link sales and all operational activities in the company; designed to coordinate activities with manufacturing and service functions that are required to meet demand. Assess monthly product groups at least 6-12 months across the planning horizon, but some companies go out as far as 18 months.
32 Benefits of sales and operations Planning improved customer service reduced inventory lower manufacturing & distribution costs better control of overall business performance increased team work within and across functions
33 Application of material Requirement Planning (MRP) MRP is the piece of logic that that deals with supply scheduling. It is a method used for scheduling high value custom made parts, materials & supplies. The purpose of MRP is to avoid carrying inventory, because inventory does not need to be hold when the needs of the consumers are known. This is computer-based information system for ordering and scheduling of dependent-demand inventories, i.e. what is needed, how much is needed, and when is it needed MRP calculates how many parts or materials or particular types are required and at what time. Demand forecasting Inventory Record- check how much is available
34 MRP Inputs Master Production Schedule (MPS) States which end items are to be produced, when they are needed, and in what quantities Bill of Materials (BOM) a listing of all of the raw materials, parts, and sub-assemblies needed to produce one unit of a product Inventory Records includes information on the status of an item during the planning horizon, eg. quantity, supplier, order lead time, lot size
35 Primary Reports MRP Output Planned Orders schedule indicating the amount and timing of future orders Order Releases Authorization for the execution of planned orders Changes revisions of due dates or order quantities, or cancellation of orders Secondary Reports Performance-control reports Evaluation of system operation, including deviations from plans and cost information Planning reports Data useful for assessing future material requirements Exception Reports Data on major discrepancies encountered
36 Benefits of MRP Low levels of inventories and reduction in manufacturing lead time Ability to track material requirements hence reducing shortages Ability to evaluate capacity requirements Means of allocating production time