WELCOME TO CILMOR DC
|
|
|
- Pierce Payne
- 5 years ago
- Views:
Transcription

1

2 WELCOME TO CILMOR DC

3

4 TRACK RECORD OF GROWTH


5 AFRICA S NO. 1 RETAILER

6
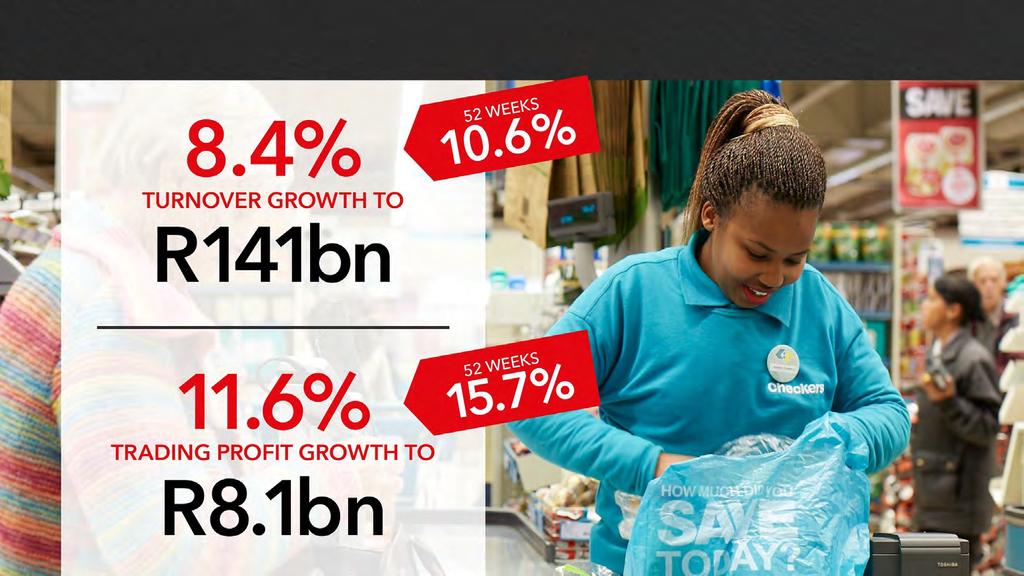
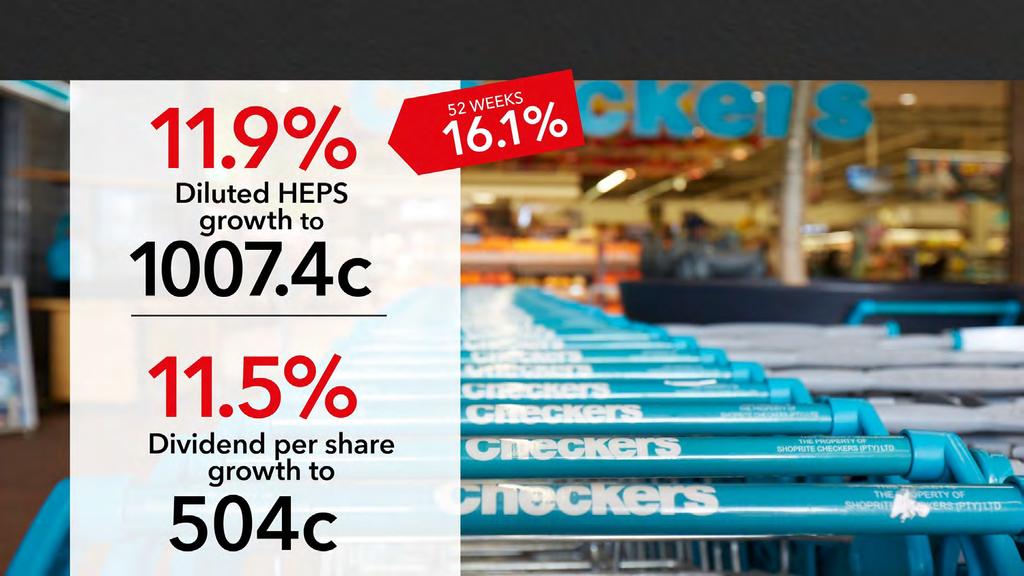
7 FINANCIAL HIGHLIGHTS

8 TRADING MARGIN
9 FINANCIAL HIGHLIGHTS
10 FINANCIAL HIGHLIGHTS Sales growth per segment Existing stores Net new stores Total 52 weeks Total 53 weeks Supermarkets RSA 6.9% 3.6% 10.5% 8.0% Supermarkets Non-RSA 1.0% 12.5% 13.5% 11.7% Furniture 1.9% 4.3% 6.2% 4.3% Other Operating Segments % 7.0% Total 5.8% 4.8% 10.6% 8.4% Supermarkets Non-RSA at constant currencies: 31.6% (52 weeks = 33.8%)

11 GROSS PROFIT MARGIN
12 FINANCIAL HIGHLIGHTS (53 weeks) Other operating income 2016 Rm 2017 Rm Growth Finance income earned % Net premiums earned % Operating lease income % Commissions received % Franchise fees received % Investment income % Sundry income % Total 2,444 2, %

13 FINANCIAL HIGHLIGHTS Depreciation and amortisation: 7.5% Operating leases: 9.6% Employee benefits: 10.5%
14 KEY INFORMATION PER SEGMENT KEY INFORMATION PER SEGMENT Trading Profit 2016 Rm 2017 Rm 53 week growth 52 week growth Supermarkets RSA % 14.1% Supermarkets Non-RSA % 18.9% Furniture % 38.0% Other Divisions % 30.0% Total % 15.7%
15 EXCHANGE RATE DIFFERENCES Rand appreciation against the US Dollar June 2015: R12.13/$ June 2016: R14.78/$ June 2017: R13.04/$ R46.1m loss 2016 R235.9m loss 2017
16 INVENTORY LEVELS Growth in inventory: 18.2% R687m lower than December Excl. Supermarkets Non-RSA = 8.9% Provisioning Cilmor DC Angola stock clearance issue
17 FINANCIAL HIGHLIGHTS Capital expenditure 2016 Rm 2017 Rm Land, Buildings and Leasehold Improvements Store Refurbishment New Stores Information Technology Other Replacements* Total * Includes new Cilmor DC equipment, vehicles and office furniture
18 FINANCIAL HIGHLIGHTS KEY INFORMATION PER SEGMENT 2016 Rm 2017 Rm Growth Net Cash Balances % Investment in USD Index Linked Angolan Government Bonds

19 Reflects 52 week comparison

20 WINNING THE BATTLE FOR CUSTOMERS Relentless focus on customers reaping rewards 52 week comparison


21 SUPERMARKETS RSA Double digit sales growth of 10.5% (5.9% internal inflation) R100bn sales milestone achieved Sales growth outstripped market every quarter Record share in June 17 at 33.2%
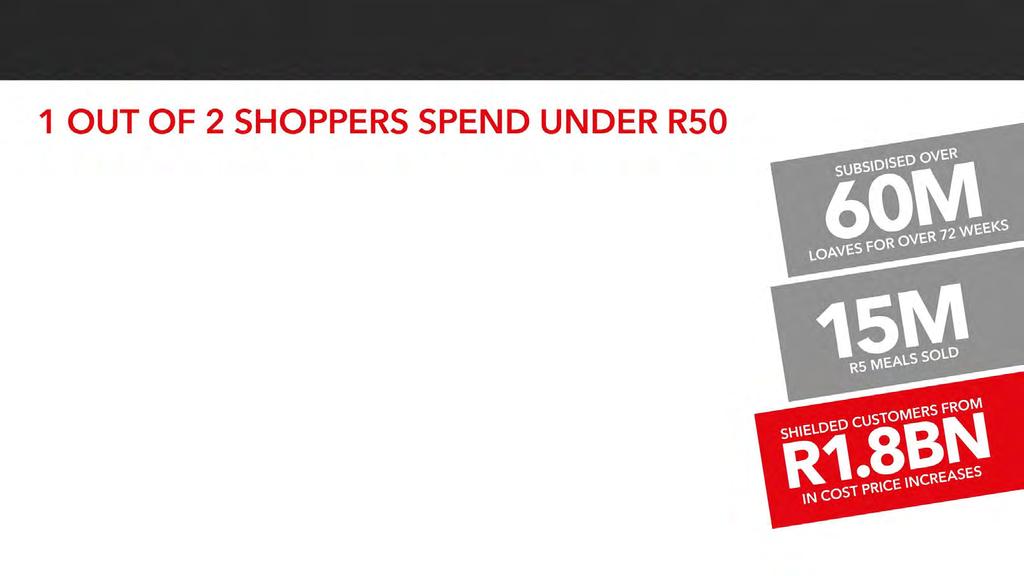


22 FOCUS ON AFFORDABILITY
23 SUPERMARKETS NON-RSA 13.5% sales growth conceals strong constant currency growth of 33.8% Currency devaluations vs Rand in all countries Slowing GDP growth and forex shortages Non-RSA Constant Currency growth
24 NON-RSA SUPERMARKETS Angola Turnover growth Non-RSA Supermarkets: 52 week local currency Trade normalising after exceptional half year growth of 130.2% Loyalty of new customers: +23% like-for-like Nigeria Import restrictions, local products now 80% of sales Shopping centre developments have stalled Namibia Turnover increased by 11.5% Zambia Political noise, depressed copper price Increased competitor presence
 0.")
25 COMPLEMENTARY BRANDS 438 total stores (incl. franchises) 0.72% share gains Trading Profit +38% 36% Sales growth

26 COST LEADERSHIP Expense growth well controlled Shrinkage well below global benchmark

27
28 6 DRIVERS OF FUTURE GROWTH
29 1. CUSTOMER-FIRST CULTURE No customer leaves the store unhappy Operational management aligned to brands Invested two million training days (+12%) 35% reduction in customer complaints Invested in customer science and data capabilities More relevant ranging and pricing On-shelf availability improved 2%
30 2. GROWING UPMARKET SHARE OF WALLET Chasing share of wallet of 1.9m LSM 8-10 cross-shoppers Dismantling the monopoly in premium food retail Accelerating market share gain in upmarket segment Record high share in June 17

31

32 3. DEVELOPING PRIVATE LABEL Participation +1% to 14.7% in SA Private Label Margin up 2.3 percentage points Opportunity: Industry participation 18.5%* *Source: Nielsen, July 2017

33 4. STRONGER FRANCHISE OFFER Increased appeal: 29 net new members Gained market share Rebranded stores growing 2x other stores Retailer Margin improved 0.5% Profit growth ahead of Turnover growth

34 5. LEVERAGING AFRICAN ADVANTAGE McKinsey Global Institute, 2016 Headroom to grow in untapped formal market 21 new stores opened, 35 confirmed, 116 further opportunities


35 6. STRATEGIC EXPANSION Amplify value chain on the continent - Photy Tzellios- Sizeable competitive advantage in Supply Chain: Learnings from 24 years experience R40bn of investment 750,000m 2 of distribution space Source from 43 countries and export to 14 countries Optimising inventory and improving cash cycle

36 NEW GENERATION CILMOR DC
 Optimised store size with improved ROI New agile technology enables")

37 6. STRATEGIC EXPANSION Capitalise on bricks-and-mortar Extend footprint lead in Africa - advantage for omni-channel (Amazon/Wholefoods) Optimised store size with improved ROI New agile technology enables scalability ERP replatforming for rapid deployment (acquisitions) Going Google enhancing collaboration Expanding borders New African countries Beyond the continent under investigation New supermarket openings

38