Sustainable Smart Parking in DC Combining Technology with Big Data Analytics
|
|
|
- Francis Snow
- 5 years ago
- Views:
Transcription

1 Penn Quarter/Chinatown Sustainable Smart Parking in DC Combining Technology with Big Data Analytics Presented at: April 18, Image courtesy of Mr. T in DC Presented by: Soumya S. Dey, P.E., PMP Director of Research & Technology Transfer District Department of Transportation
2 Outline Introduction to parkdc: Penn Quarter/Chinatown Technology Assessment Asset Lite Concept/Lean Asset Deployment Creating the right on street environment System design minimum viable product Asset deployment strategy Data fusion for traveler information Other Big Data Analytics Wrap up 2
3 Key Project Team Members 3
4 PARKDC: PENN QUARTER/ CHINATOWN 4
5 The Parking Ecosystem is Unbalanced Relationship between curbside congestion and roadway congestion 5
6 A Smart Approach to Parking Rebalance supply and demand: Push parkers to underutilized spaces Encourage higher turnover Provide better parking information Encourage use of other modes This will be accomplished through: Demand based pricing Providing real time parking availability information Sustainable, Cost-Effective Approach Asset Lite 6
7 Project Goals Reduced time to find parking: Increased parking availability More reliable parking information for drivers Potential to reduce congestion, increase safety, and encourage use of other modes Improved turnover of high demand parking spaces Incentives (lower prices, longer time limits) on low demand parking spaces 7


8 The Penn Quarter/Chinatown Study Area 114 block faces 1000 metered spaces 30 loading zones 6 bikeshare stations 2 car sharing spaces 3 major Metro stations 3 busiest Metro Stations WMATA bus stops Freeway arterial Interaction Different land uses White House US Capitol 8
9 PERFORMANCE PRICING Aka Value Pricing Aka Demand based Pricing Aka Dynamic Pricing Aka Time of day Pricing 9
 (Opened December 2014) WMATA Metrorail Time of Day Pricing Monday Thursday Friday Saturday http://www.95expresslanes.com/album/50 5:00 a.m. 9:30 a.m. Peak 5:00 a.")
10 Local Examples of Demand-Based Pricing I 495 HOT Lanes (VA) (Opened November 2012) I 95 Express Lanes (VA) (Opened December 2014) WMATA Metrorail Time of Day Pricing Monday Thursday Friday Saturday 5:00 a.m. 9:30 a.m. Peak 5:00 a.m. 9:30 a.m. Peak 7:00 a.m. Midnight Off Peak 9:30 a.m. 3:00 p.m. Off Peak 9:30 a.m. 3:00 p.m. Off Peak Midnight 3:00 a.m. Peak 3:00 p.m. 7:00 p.m. Peak 3:00 p.m. 7:00 p.m. Peak 7:00 p.m. Midnight Off Peak 7:00 p.m. Midnight Off Peak Sunday Midnight 3:00 a.m. Peak 7:00 a.m. Midnight Off Peak 10
11 Pricing Schemes Price adjustments quarterly Different pricing by time of day (like Metro pricing) CURRENT Parking Prices Per Hour (same price throughout) M F Sat Sun 7am 9:30am No parking $$$ FUTURE Parking Prices Per Hour (different rates based on congestion; adjusted periodically) M F Sat Sun 7am 9:30am No parking $ 9:30am 4pm $$$ $$$ 9:30am 4pm $$ $$$$ 4pm 6:30pm No parking $$$ Free 4pm 6:30pm No parking $$$ Free 6:30pm 10pm $$$ $$$ 6:30pm 10pm $$ $$$ Overnight Free Free Overnight Free Free 11


12 What s New & Innovative? Asset Lite approach Meters Occupancy detection Application of demand pricing to other modes Delivery trucks and motor coaches 12


13 Smart Parking Spectrum Smart parking meters Higher uptime, customer convenience, proactive maintenance, higher revenues Alternative payment options Pay by cell, credit cards Real time information to use and share Pricing as demand management tool 13 13
14 Relationship Between Paid Usage & Occupancy In many jurisdictions payments do not correlate strongly with occupancy 14
15 TECHNOLOGY ASSESSMENT 15
16 Technology Assessment Space Occupancy Technology In ground sensor Parking dome mounted sensor Movable camera Time lapse camera Fixed camera License plate reader Evaluation Criteria Accuracy Latency Reliability Versatility Scalability Ease of installation Life cycle cost capital, operating 6 trailer mounted cameras ~ 6 months 50 sensors from 3 vendors installed 16 16
17 Minimum Viable Product What accuracy do we need? Based on purpose (traveler information vs. pricing strategies) Based on system design space level availability vs. block face level probabilities Create an environment for asset lite Transition to pay by space Selecting the optimal solution What does the solution look like? hybrid vs single technology What is the optimal mix of technologies for a hybrid solution? What coverage do we need? 17


18 Movable Cameras Solar powered Mobile Allows video analytics Line of sight issues Obtrusive to public space Vandalism 18


19 Example: East side of 4th Street between E and F Street F Street Museum Entrance th Street EStreet 3/12 3/13 3/14 3/15 3/16 3/17 3/18 3/19 3/20 3/21 3/22 09E3 AC1C C375 19

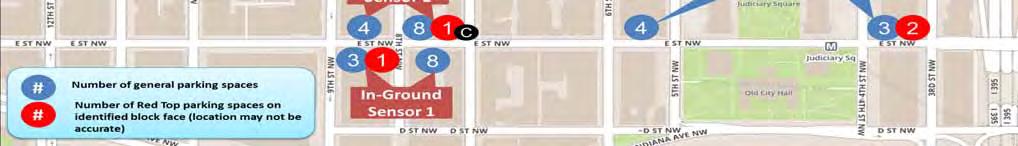
20 Sensors In ground sensors (3) Parking meter dome mounted sensor (1) 20


21 Sensor Testing Locations 21

22 Occupancy By Hour By Day RED = 100% occupancy Blue = 0% occupancy Peak occupancy during lunch hour, evenings Declines in early morning hours, rush hour 22
23 ASSET LITE APPROACH Meters Occupancy 23


24 Asset Lite Concept Getting to minimum viable solution with fewer assets What outcomes do we really need; minimize system requirements through smarter design 24
25 ASSET LITE FOR METERS 25

26 Example Asset Lite Approach - Meters Meters Where pay by cell is the overwhelming payment method of choice, remove meters from one side of the street Multi space meters will still be available on other side of the street Assess impacts Pay By Cell Market Penetration 100% 75% 50% 25% 0% Coin Credit Card Pay By Cell 26 26


27 Pay by Cell Usage 100% pay by cell Candidate block faces for removing meters Areas in white were installed in or after December Does not include Red Top meters No pay by cell 27
28 ASSET LITE FOR OCCUPANCY DETECTION 28

29 Step-Down Approach to Real-Time Availability Create the right onstreet configuration Design user interface to reduce accuracy requirements Data fusion Asset deployment algorithm Real-time availability 29
30 Step-Down Approach to Real-Time Availability 30


31 Pay-By-Space Conversion Completed end of October 2015 Allows payment information at the space level Provides another input into the blender Improves the customer experience Pay by space enhances accuracy of occupancy detection 31
32 Step-Down Approach to Real-Time Availability 32


33 Block vs Space level diagram Block level information reduces accuracy requirements 33
34 DATA FUSION Deployment strategy Traveler information algorithm 34
35 Step-Down Approach to Real-Time Availability 35

36 Data Fusion Sensor data Special events data Camera data Sensor deployment strategy Point-to-point carsharing data Pay by cell transaction data Real time occupancy/ availability Pricing engine Meter transaction data Enforcement data What is the most cost-effective mix of assets that will provide reliable occupancy information? Real time traveler information 36


37 Data Fusion Challenge Extracting value from data fusion Volume Velocity Veracity Variety 37
38 Data Fusion Challenge Fusing spatio-temporal data in variety of data distribution Data Type Coverage Time Sensor Sample Real-time Camera Sample Historic Pay by Cell Universal Real-time Meter Transaction Universal Real-time Enforcement Universal Historic Special Events Universal Static Placard Usage Sample Historic 38
39 Sensor Placement Challenge There are 252 different ways to install five sensors in ten stalls, and a huge number ( E+269) of ways to install 450 additional sensors in 900 spaces. Using models of the spatial dependence of occupancy at different locations, we can calculate the expected error in predictions of occupancy for any given sensor arrangement. Using a combinatorial optimization algorithm which searches over possible sensor arrangements, we can pick the arrangement that minimizes those errors. 39
40 Business Rules for Asset Deployment Blocks with fewer spaces require a higher percentage of sensors. Blocks with greater congestion require more sensors than blocks with fewer parkers. Sensors are placed to maximize spatial coverage. Percentage coverage on a block depends on variability between spaces Percentage coverage on a block depends on variability from day to day 40

41 Sensor Deployment Legend #* Sensor Communication Equipment!( No Sensor Installed!( Sensor Installed 41
42 DATA FUSION FOR OCCUPANCY DETECTION 42
43 Using payment data and citation data to predict occupancy Rush hours removed Percentage use/payments (includes enforcement patterns) Hour 43
44 WRAP-UP 44
45 Key Project Activities and Timeline Q Q Q2& Q Q Q Q Quarterly Q Q Kick off project Prepare project documentation Develop new signage Install asset lite parking occupancy detection Test new systems Transition to pay by space Perform baseline conditions assessment Deploy sensors Develop pricing algorithm Install new signage Implement demand based parking pricing changes Provide real time parking availability information Adjust pricing Perform after conditions assessment Complete comprehensive impact assessment 45
46 OTHER ACTIVITIES 46

 sensors Dense, ubiquitous sensor network")
47 Measuring Cruising for Parking Problem Cruising for parking adds to traffic, causing extra congestion Smart parking policies and tech can address the causes of cruising But, cities can t measure cruising continuously When and where does cruising happen? How does cruising for parking change over time? Solution Deploy a dense network of low cost AVI sensors (Bluetooth) Sensors detect vehicles Anonymous vehicle routes are reconstructed from distributed sensor data Vehicle routes are classified as cruising or noncruising Able to measure rates of cruising for parking Low-cost automatic vehicle identification (AVI) sensors Dense, ubiquitous sensor network deployments Reconstructed vehicle routes Source: Rapid Flow 47 47

48 Time Lapse Photography Battery powered (could be plugged in) Dependent on frequency of photography, battery life is 1 72 days 5 minute frequency lasts about days About $300 $350 per unit and mount Minimally obtrusive to public space Need to make law enforcement aware Requires some in depth post processing Semi manual approach as done at NYCDOT Automated approach through vendor Challenges in post processing accuracy Frame frequency may not differentiate occlusion and parked vehicles leading to errors on high volume streets Camera ideally monitoring no more than 6 8 parking spaces 48


49 Timelapse Photography Analysis
50 More information Contact: Soumya Dey, PE, PMP Director of Research & Technology Transfer District Department of Transportation 50