Welcome & Introductions
|
|
|
- Elvin Stone
- 5 years ago
- Views:
Transcription


1 Welcome & Introductions Casey Murphy ACT Events and Programs Manager David Straus ACT Executive Director

2 Make the most of survey data
3 Introduction Rachel Forseth Consultant Project focus: San Diego Association of Governments (SANDAG)

4 What is icommute? TDM program provided by SANDAG Free services and programs to encourage sustainable transportation alternatives icommute s goals: Reduce traffic congestion Reduce GHG s Reduce # people who drive alone Employer Outreach is main focus, currently engaged with over 250 employers icommutesd.com


5 Employer Services Program Planning Survey employees GIS team maps data Measure interest in alternative transportation Trip Reduction Plan Implementation Incentives & marketing materials Evaluation Technical assistance & trip tracking

6 Commuter Survey Goals: Establish a baseline SOV rate to improve on Understand: existing commuter picture motivations and barriers to alternative modes 6

7 Know your employees Goal of marketing: change norms Effective campaigns must be human centered Create a program not for, but with your employees Segment audience Identify values Tailor message


8 Reduce burden of change Understand: Who wants to make a change How can you make it easy for them


9 GIS Mapping


10 Focused programs Lunch and Learn Ride-matching Try Transit Bike safety Incentives Facility upgrades First/last mile solutions


11 Case Study: County of San Diego Survey results indicated 38% of employees interested in transit 150 employees participated in Try Transit program 40% of program participants continue to ride regularly 11


12 Case Study: Genentech Kai-Zen to facilitate a group decision on commuter program Transitioned from company funded shuttle to a Lyft for Work program Subsidized carpool trips to a nearby transit station Saved company $8k in first month, estimated $96k/year


13 Engaged Employers


14 Thank you!
15

16 Technology and Feedback in Commute Programs at Intuit February 2018


17 Our mission Powering prosperity around the world Who we serve: Consumers Small Businesses Self-Employed


18 Who we are , B 42M Founded IPO Employees Locations Revenue Customers Our values: Integrity Without Compromise Be Be Bold Passionate Be Decisive Learn Fast We Care and Give Back Win Together Deliver Awesome

19 Intuit global locations: 21 locations in 10 countries Canada Edmonton Mississauga/Toronto NA SA EU AS AU United States California: Mountain View San Diego San Francisco Woodland Hills Eagle, ID Fredericksburg, VA Miami, FL Plano/Dallas, TX Quincy, WA Reno, NV Tucson, AZ Washington, D.C. Europe London, UK Paris, France Munster, Germany Brazil São Paulo Israel Tel Aviv India Bangalore Australia Singapore Shuttles Bikes Financial assistance Guaranteed Ride Home Carshare Paid Parking Transportation Management Association Sydney Carpool/Commute reporting Zimride everywhere but UK EV Charging MIS and all US except Quincy & WDC Updated January 2018


20 Intuit Mountain View Campus Transportation Demand Management Overview Open to Public Shuttles Commuter Bike Loan MVgo Last Mile Shuttles GoPass (Free CalTrain) Vanpools Public EV Chargers Global Ride Matching Carshare Guaranteed Ride Home Bike Share Program Monthly Transit Benefit Personalized Marketing Transportation Coordinator Transportation Fair Mountain View Transportation Management Association (TMA) 3 rd Party Pilots
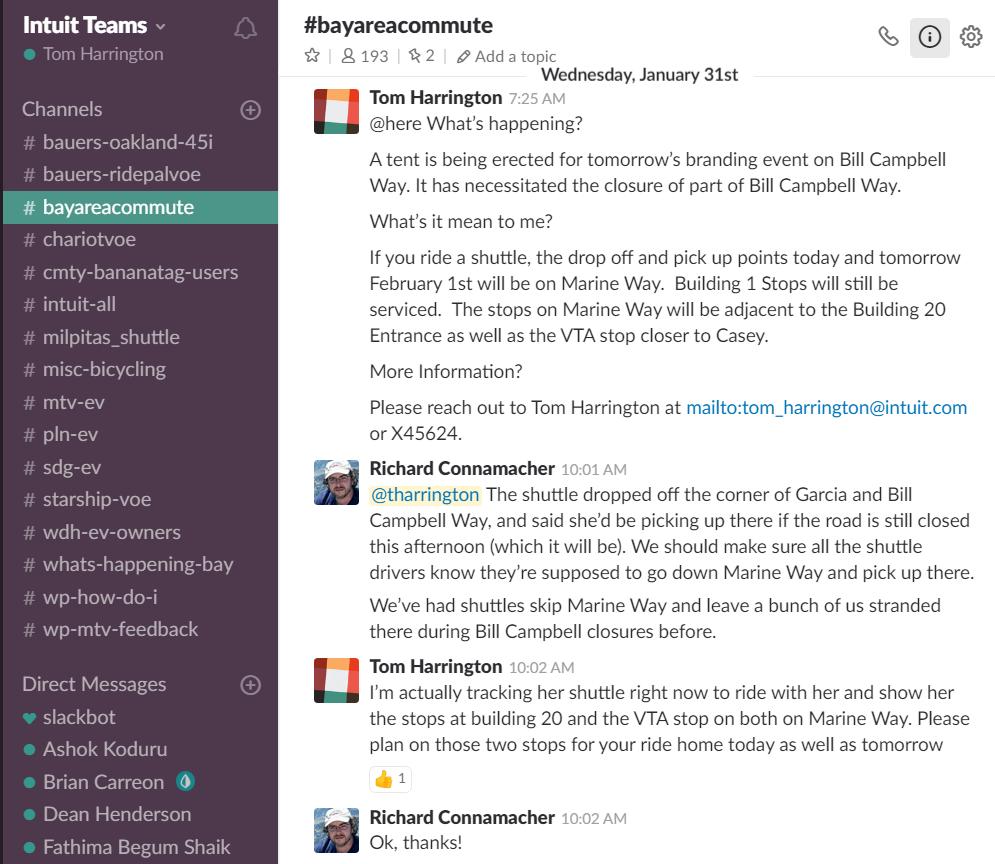
21 Feedback Channels: Direct voice, and live conversations Aggregated (Town halls) Surveys Slack How is Slack used? Real time posts Community to answer Partner sees questions and responds Quick references Can Pin information- e.g. Guiding Principles; external support contacts, broadcasts a message Ubiquitous access Desktop Smartphone Targeted audience: Invite or Opt in What is Slack? 1 Messaging platform that: It s the foundation for teamwork It simplifies communication It helps everyone find the answers they need It streamlines your workflows The results Real-time communication with the program manager Inspired confidence in the program brand Riders KNOW their feedback is heard Response workload shifts to partner Top 3 Learnings Build it for them..or your customers will Expectation is always available If you take too long; assumption is you don t care and the feedback disappears


22 Use cases- feedback & education


23 Use cases- Communication


24 Use cases- marketing

25 Use cases- other
26 Contact Tom Harrington

27 February 20, 2018 Mark Melynk


28 Introduction Mark Melnyk
 made to our campus to no more than 50%.")
29 Cherry Hill s Transportation Story Multitenant Major Institution with a campus population of over 3000 (80% are Swedish caregivers). Campus shares ~1850 parking spaces for both employees and patients. In order to expand we need to demonstrate that we can reduce the number of drive-alone trips (DAR) made to our campus to no more than 50%. Every two years we need to continue to reduce our drivealone trips by 2% until we hit our campus goal of 32% (DAR).
30 Cherry Hill s Commuting History 60.0% 58.0% 56.0% 54.0% 58.7% 56.1% 57.6% 56.7% 52.0% 50.0% DAR Goal 48.0% 46.0% 44.0% 2009/ / / /2016


.")


31 Are we offering the right programs? Parking policies & pricing that restricts/disincentiviz e parking during peak hours. Free and reduced parking for carpools (reduced) vanpools (free). Reserved/preferred parking for HOV Heavily subsidized transit passes Covered and uncovered bike parking throughout the campus. Lockers and showers for walkers and bikers. Transportation at work: Shuttles and Zipcar. Host Transportation fairs. Attend New Employee Orientations. Promote regional and local commuter campaigns.

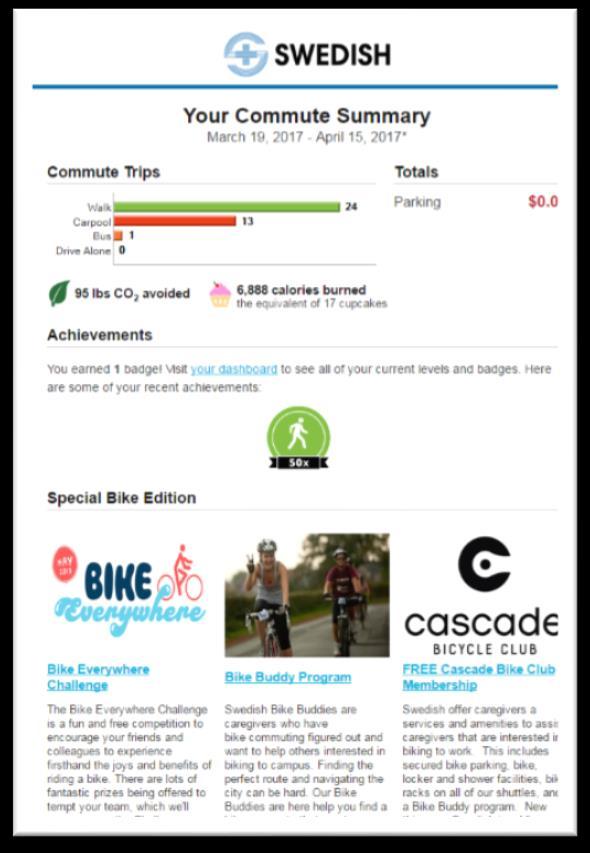
32 We shifted from a static dinner bell approach to a program that is dynamic and engaging. The reality is that if you are in any market, customers expect services/products that are customized to their unique needs. We are not in the transportation business. Rather we are in the business of adding value to caregiver s work experience by reducing the burdens associated with commuting.


33

34 Leveraging Data Insights to Shape Messaging 70 Targeted Departments: Parking Flex ARUKN Monthly
35 2017 Mode-Split Data: Cherry Hill Campus 70.0% 60.0% 50.0% GOAL : 50% SOV 40.0% 30.0% 20.0% 10.0% 0.0% Drive-Alone Transit Rideshare Tele/CWW Bike Walk % 20.6% 11.5% 1.3% 1.7% 4.5% % 19.1% 9.4% 3.3% 2.9% 5.6% % 23.2% 13.7% 3.5% 3.1% 5.7%

36 Programming constantly evolving
37 Contact Mark Melnyk