Production & operations management. Chapter 6 Process Planning & design
|
|
|
- Maud Allen
- 5 years ago
- Views:
Transcription
1 Production & operations management Chapter 6 Process Planning & design
2 Process Planning & design Process planning is concerned with planning the conversion or transformation processes needed to convert the materials into finished products. Process planning consists of two parts Process design and Operations design. Process Design is concerned with the overall sequences of operations required to achieve the product specifications. Process planning specifies the type of work stations that are to be used, the machines and the equipments necessary & the quantities in which each is required.
3 Process Planning & design Process planning is concerned with planning the conversion or transformation processes needed to convert the materials into finished products. Process planning consists of two parts Process design and Operations design. Process Design is concerned with the overall sequences of operations required to achieve the product specifications. Process planning specifies the type of work stations that are to be used, the machines and the equipments necessary & the quantities in which each is required.
4 Operations design The sequence of operations in a manufacturing process. 1) Nature of the product. 2) Materials used. 3) Quantities being produced. Operations Design Operations Design is concerned with the design of the individual manufacturing operation. It consists of examining man-machine relationship in the manufacturing process for converting the raw materials into finished or semi finished product
5 Framework for process design The design of the transformation process requires to answer following questions: What are the characteristics of the product or services being supplied or offered to customers? What is expected value of output? What kind of equipment or machinery are available? Equipment or machinery custom built? What types of labor skills are available? How much money can be spent on manufacturing process? How best to handle materials?
6 Systems approach to process Planning & design Inputs: Product/Service information. Product system information. Operation strategy. Conversion process: Selection of the type of process coordinated with operation strategies. Vertical integration studies consisting of major minor technological steps. Equipment studies Production process studies Facilities studies
7 Systems approach to process Planning & design Outputs: Technological processes:design of specific processes & linkage among process Facilities:Building design,layout of facilities and selection of equipment Personal Estimates:Skill level requirement,number of employees,training & retaining requirement,supervision requirement
8 Linkage between Product & Process Planning Product Planning serves as an input to process design. Responsibility for product planning and development rests with marketing department & R&D department. Basic Product planning must begin during the product design stages where selection of material& initial form as casting,forging,die casting & plastic moldings takes place
9 Process Planning Linked to n Product Planning Product Planning New technology Product Final Design Process R&D Process design Work Station Selection Process Design Operations Design Operations Content Operations Methods
10 Distinction between Process Planning & facilities planning Process planning blends with the layout of physical facilities. The process plans manifested by documents such as route sheets and operation sheets are regarded as input to the development of layout of physical facilities. Figure shown on next slide shows overall conceptual framework of process planning
11 Diagram of overall development of process plans Design Specification Sales forecast Customers Orders Process design Functional Design Production Design Drawing Product Analysis Buy Make or Buy Make Process planning Process decision Route sheets Workplace design Manufacturing Modification Of process plans
12 Scope of Process Design Design of manufacturing of the product starts with the receipt of product specification and ends with the final plan for the manufacture of the product.the steps involved in the process design are. A careful review of the product design & product specification to ensure economical production is feasible. Determination of the methods of manufacture that will result in the optimum manufacture
13 Scope of Process Design Selection or development & procurement of all machines,tools,jigs,and fixtures. Layout of production areas and auxiliary spaces& installation of the manufacturing facilities. Planning for and establishing the necessary control of materials.,machines & man power to ensure effective utilization of manufacturing facility for economical production of product
14 Factors affecting Process Design Volume of product to be manufactured. Required quality of the product. Equipment that is available. Major Factors affecting process Design Decision Nature of product demand. Degree of vertical integration. Level of product/service quality. Degree of automation Level of product/service Quality Degree of customer contact
15 Factors affecting Process Design Ultimately the supply of virtually all "industrial" products and services is dependent upon consumer demand. We say, therefore, that Industrial Demand is DERIVED DEMAND. That is, it is derived from Consumer demand. So it follows that demand for a company's products will be affected by the demand for some ultimate consumer product or service - no matter how far removed the company might be from the consumer market. As we move further back in the "chain" from the consumer, the number of companies in a particular industry reduces.
16 Factors affecting Process Design For example, there are relatively few steel manufacturers, yet steel is bought and processed by many companies until there are thousands of companies producing consumer goods that incorporate steel in some way. Similarly, there are relatively few oil extracting companies, but many companies further down the "chain" that produce goods derived from oil products. The effects of all this are significant to companies that manufacture or supply industrial goods or services: (a) The company needs to be aware of what is happening in its customers' markets (and those of its customers' customers) even though the company does not have direct access to these markets
17 Factors affecting Process Design (b) Price manipulation, and other gimmicks, are not likely to have much effect on the total demand for industrial products. If there is little consumer demand, there will be a low level of industrial demand that cannot readily be stimulated by price - cutting. Also, because there are relatively few suppliers in the industrial markets, any attempt at a "price war" is likely to attract price retaliation. The net effect will then be to reduce profits all round. (c) Following on from (a) above, sales forecasts must be largely based on customers' assessments of demand, rather than wholly upon the suppliers' assessments.
18 Types of Process Design Process focused production system:in this type the production processing the production department are organized according to the type of product/services being produced. Product focused production system:this is a form of production system in which production operations are grouped according to the type of process. Group-technology/cellular manufacturing system:this form has recently developed.in group technology,the products or components are placed in families or groups and separate manufacturing cells are used to manufacture these groups
19 Types of Process Design Group-technology/cellular manufacturing system:advantages Improved material flow Reduced queuing time Reduced inventory Improved use of space Improved team work Reduced waste Increased flexibility
20 Process Technology Group-technology/cellular manufacturing system:advantages Improved material flow Reduced queuing time Reduced inventory Improved use of space Improved team work Reduced waste Increased flexibility
21 Process Technology Life Cycle Process Technology Life cycle are related to product Life cycles as shown in fig. Over the period of time manufacturing cost per unit diminishes in mature products The product life cycle starts from from the stage of Start up and ends up with decline Manufacturing Cost per unit Job Shop Batch Assembly line Continuous flow Time
22 Product Process Matrix The product/process matrix (PPM) This is a simple tool for mapping whether or not proposed strategic choices lie in the firm's area of experience. Step 1 involves plotting two axes, one for the product families which the firm currently make and one for the processes which it uses. This effectively defines the area within which the firm is operating in terms of its technological competence. Step 2 involves asking whether the new proposal fits somewhere within this space or lies outside it, in other words, somewhere which will require the acquisition of new competence.
23 Product Process Matrix If it does, then it implies that the new development will require new combinations of existing knowledge and the challenge is one of internal learning. But if it lies outside current competence, then it will be necessary to think about how the gap will be closed, and whether it represents a high risk jump into completely new territory or an incremental advance in the firm's knowledge base. Much innovation involves progress along one axis, keeping the other constant. For example, developing a new product family using processes with which the firm is familiar is relatively low in risk.
24 Product Process Matrix Similarly employing a new process to make a wellunderstood product is relatively low risk. Where the change involves both product and process, the risks are high. The basic principle can be applied in a number of ways. First the axes can be changed, for example, to explore the space around products and markets, or processes and materials. And the matrix can be extended to three, four or five dimensions, although by this time it becomes difficult to work with. But in each case the principle is the same, the axes represent 'knowledge space' within which the firm has experience.
25 Product Process Matrix
26 Batch size & Productivity Batch Size A Product Focused Dedicated system B. Product Focused batch System C Cellular manufacturing Process Focused D Number of product Design Job Shop
27 Product Mix At point there is a single product having a large demand.in this case a product focused organization dedicated to single product would be appropriate which gives low production cost per unit. As the number of product design increases & as the batch size decreases say at point B,a product focused batch becomes appropriate At point D the production of many one off- a kind products,a job shop producing unique products in batches of a single item At point C,the number of product decreases and the batch size of products increases as compared to point D
28 Cost Requirement for Planning Designs The amount of Capital required for the production System depends on the type of production processing organization It is greatest for production processing organization and diminishes for the product focused batch system Economic Analysis of production process Because fixed & variable costs tend to differ from one form of production process to another,economic analysis is used for comparing alternative processing plans for production of products When deciding among the types of production processing organization,it is important to consider the cost of each alternative
29 Cost Requirement for Planning Designs Cost Function of processing Alternative The amount of Capital required for each type of process design tend to be different Capital charges are fixed charges that occur every month.this fixed cost will be greater when initial cost of the equipment building & other assets are high.the variable cost which vary with volume is different Automated assembly line has highest fixed cost.
30 Cost Requirement for Planning Designs Job Shop Cellular Mfg. B Automated Assy. C A QA QC Volume of products Annual cost of Prod.
31 Break-Even Point The break even point for a product is the point where total revenue received equals total costs associated with the sale of the product (TR=TC). A break even point is typically calculated in order for businesses to determine if it would be profitable to sell a proposed product, as opposed to attempting to modify an existing product instead so it can be made lucrative. Break-Even Analysis can also be used to analyze the potential profitability of an expenditure in a sales-based business
32 Break-Even Point In unit sales If the product can be sold in a larger quantity than occurs at the break even point, then the firm will make a profit; below this point, a loss. Break-even quantity is calculated by: Total fixed costs / (selling price - average variable costs). Explanation - in the denominator, "price minus average variable cost" is the variable profit per unit, or contribution margin of ach unit that is sold.
33 Break-Even Point This relationship is derived from the profit equation: Profit = Revenues - Costs where Revenues = (selling price * quantity of product) and Costs = (average variable costs * quantity) + total fixed costs. Therefore,Profit=(selling price*quantity)- (average variable costs*quantity+total fixed costs). Solving for Quantity of product at the breakeven point when Profit equals zero, the quantity of product at breakeven is Total fixed
34 Break-Even Point Firms may still decide not to sell low-profit products, for example those not fitting well into their sales mix. Firms may also sell products that lose money - as a loss leader, to offer a complete line of products, etc. But if a product does not break even, or a potential product looks like it clearly will not sell better than the break even point, then the firm will not sell, or will stop selling, that product. An example: Assume we are selling a product for $2 each.
35 Break-Even Point Assume that the variable cost associated with producing and selling the product is 60 cents. Assume that the fixed cost related to the product (the basic costs that are incurred in operating the business even if no product is produced) is $1000. In this example, the firm would have to sell (1000/( ) = 714) 714 units to break even. in that case the margin of safety value of nil and the value of bep is not profitable or not gaining loss.
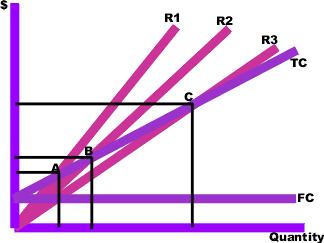
36 Break-Even Point By inserting different prices into the formula, you will obtain a number of break even points, one for each possible price charged. If the firm changes the selling price for its product, from $2 to $2.30, in the example above, then it would have to sell only (1000/( ))= 589 units to break even, rather than 714. To make the results clearer, they can be graphed. To do this, you draw the total cost curve (TC in the diagram) which shows the total cost associated with each possible level of output,
37 Break-Even Point
38 Break-Even Point the fixed cost curve (FC) which shows the costs that do not vary with output level, and finally the various total revenue lines (R1, R2, and R3) which show the total amount of revenue received at each output level, given the price you will be charging. The break even points (A,B,C) are the points of intersection between the total cost curve (TC) and a total revenue curve (R1, R2, or R3).
39 Break-Even Point The break even quantity at each selling price can be read off the horizontal, axis and the break even price at each selling price can be read off the vertical axis. The total cost, total revenue, and fixed cost curves can each be constructed with simple formulae. For example, the total revenue curve is simply the product of selling price times quantity for each output quantity.
40 Break-Even Point The data used in these formulae come either from accounting records or from various estimation techniques such as regression analysis. The total cost, total revenue, and fixed cost curves can each be constructed with simple formulae. For example, the total revenue curve is simply the product of selling price times quantity for each output quantity. The data used in these formulae come either from accounting records or from various estimation techniques such as regression analysis.
41 Limitations of Break-Even Analysis Break-even analysis is only a supply side (ie.: costs only) analysis, as it tells you nothing about what sales are actually likely to be for the product at these various prices. It assumes that fixed costs (FC) are constant It assumes average variable costs are constant per unit of output, at least in the range of likely quantities of sales.
42 Limitations of Break-Even Analysis It assumes that the quantity of goods produced is equal to the quantity of goods sold (i.e., there is no change in the quantity of goods held in inventory at the beginning of the period and the quantity of goods held in inventory at the end of the period. In multi-product companies, it assumes that the relative proportions of each product sold and produced are constant (i.e., the sales mix is constant)
43 Process Planning Aids Time planning It is important to allocate a predicted amount of time to specific tasks in the design and make process so that you share the time allocated for the whole project among the time requirements of various tasks. Remember, some parts of the design process will take up more time than others so you must consider this in the distribution of the time available. If you want your project to flow smoothly, it is a good idea to start your planning with the production
44 Process Planning Aids This flow chart will reflect the design process but will be specifically based on the type of project you are undertaking. Although the flow chart will help you organize the sequence of operation for your project, you still need to allocate specific time to each activity. Commercial designers use planning charts to help them map out the tasks they have to complete against the time allocated. These charts are no different to a geographical map in the sense that
45 Process Planning Aids they provide an overview of the project very much like a geographical map shows an overview of the land. To designers and engineers these are called Gannt charts. You may have used them previously. There are many ways of laying out a Gannt chart but whichever way you decide you will need to construct the chart logically. Based on the studentcompleted Gannt chart shown, a method that you could use is: Determine how long you need or want to take to complete the project.
46 Process Planning Aids Decide on the unit of time you will use across the top of the chart under the heading of date/period: this could be hours, days or weeks. Consider the advantages and disadvantages of each unit of time. Decide how long you will need to complete each of the project stages indicated on the left of the chart. You will need to base this on previous project experience or talk to your teacher for advice..
47 Sample Painting Process Flow Chart In this example, a hypothetical manufacturing operation has flow charted its painting operation. The example was kept relatively simple, concentrating only on paint-related wastes and releases. Only enough sections have been completed to illustrate the procedure and end points. Many sections have been left incomplete. Plant Painting Material Consumption and Wastes The following are examples of information that might be easily measured on a plant-wide basis. Paint purchase 2,430 gpy (30% solids) Thinner purchase 570 gpy Wash solvent purchase 490 gpy
48 Sample Painting Process Flow Chart Wash solvent purchase 490 gpy Paint hazardous waste 560 gpy Paint filter 100 lb/yr Painted parts scrapped 3% Painted parts reworked 9 % Transfer efficiency 45 % Process Flow A process flow diagram might look as follows with waste streams identified. Measuring the liquid and solid waste collected would be relatively easy at this level of detail. But, estimating evaporation for paint preparation and cleanup would be difficult.

49 Sample Painting Process Flow Chart
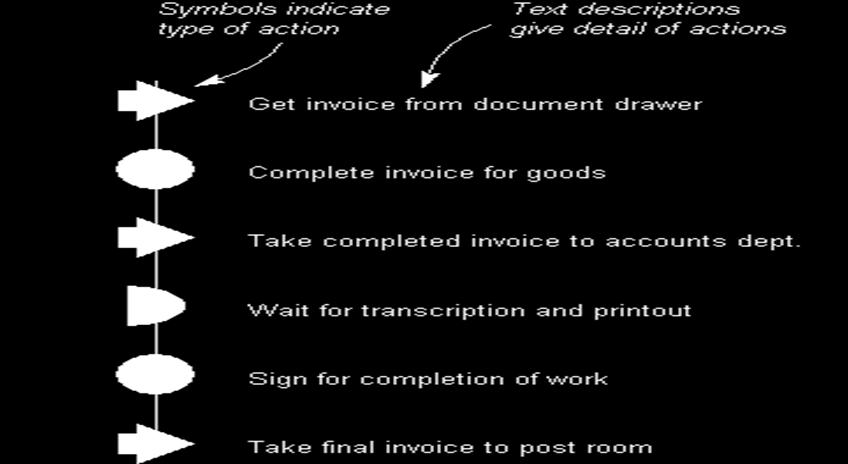
50 Flow Process Chart The Flow Process Chart In analyzing processes, particular actions along the way are often significant, especially if you are looking to eliminate sources of waste (or muda, as the Japanese call it) such as having documents piling up in in-trays or materials being moved from pillar to post. How it works The Flow process Chart is a simple half-text, half-picture method of showing the steps in a process, using symbols to indicate the type of action being taken and text to give details of the action. The chart can selectively be used to show what happens to selected people, materials or equipment.
51 Flow Process Chart Selecting and sequencing operations is vital to efficient production. Proper analysis of product drawings is the first step. Description of the operations is the second step. Flow Process Charts Operation Process Charts Flow Diagram

52 Flow Process Chart
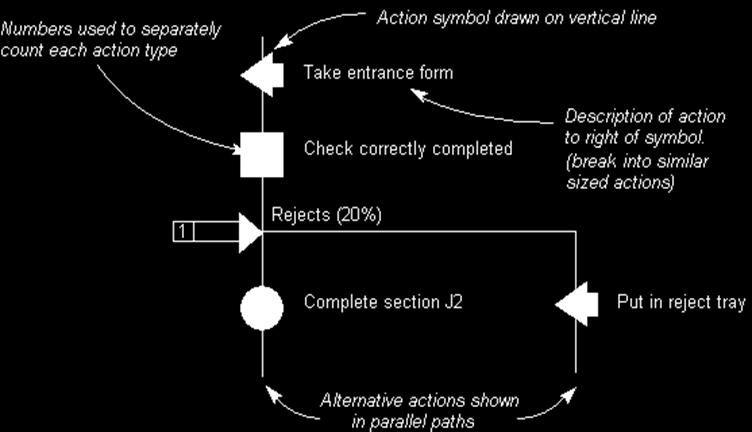
53 Flow Process Chart How to do it 1. Identify the process to be charted and the objective for charting it. 2. Identify the symbol set to be used. 3. Record the steps of the process as it happens, starting at the top of the page, with symbols on the left overlaying a vertical line with appropriate notes about what is happening to the right. Try to record significant activities which are generally of approximately equal size (unless the problem is at the detail level, do not try to capture too much detail). You can also make the diagram more useful by such tricks as numbering the different action types in sequence

54 Flow Process Chart
55 Flow Process Chart Slide 7 of 11
56 Flow Process Chart
57 Flow Process Chart
58 Flow Process Chart
59 Process Planning & design End Of Chapter 6