Lean, team-based medical device manufacturing. David Hurley Associate Director of Operations Alcon Research, Ltd.
|
|
|
- Aron Garrison
- 5 years ago
- Views:
Transcription

1 Lean, team-based medical device manufacturing David Hurley Associate Director of Operations Alcon Research, Ltd.
2 Agenda Alcon Starting our Lean journey Our Lean Change Process Lean Production Lean Management
3 Agenda Our Improvements Looking beyond surface metrics Telling your story - Our advice
4
5 Alcon, Huntington WV Size: 296,000 ft.² Employees: More than 750 Key Products: AcrySof Intraocular Lenses (IOLs), PMMA Intraocular Lenses, Monarch IOL Delivery System (LDS) Annual Volume: 5 million IOLs, 9 million LDSs

6
7 Alcon-North, Lesage Size: 130,000 ft² Employees: More than 200 Key Products & Processes: Manufacturing: Monarch IOL Delivery System (9 million annually) Sterilization, Packaging, and Distribution of all product lines (15 million annually)
8 Starting our Lean journey
9 Lean...Again...Really? Failed past initiatives: Support from top Involvement from bottom-up Change agents from middle management People who understand Lean
10 Why Now? New General Manager (Support from top+) Involvement from bottom-up (Ready and waiting) Change agents from middle management (Me+) People who understand Lean (Operational Excellence+)
11 The Process We need help!

12 To The Rescue! Alcon Operational Excellence Greg Stehle, April Young, Stephanie Williams
13 The Process Lean Production Lean Management
14 The Process Communications and support from the top Technicians involved at every step Priorities for improvements Safety (Ergonomics) Quality (Poka-Yoke) Productivity (Fixtures) Cost (Will take care of itself)
15 The Process Operational Excellence Support Lean road map Facilitate Gemba Kaizen Events Technical support for Lean tools Education of support staff Change Agents (Middle Managers) develop technical lean knowledge to lead and facilitate
16 Lean Production Creating Continuous Flow Who is your customer? Your supplier? What is the distance between stations? Is one-handed delivery possible? Identification of Product vs. Process oriented layouts What is a work cell? Is a cell possible? Takt Time
17 Lean Production CONWIP & Pull System Supermarkets Standard Work Value Stream Mapping
18 Lean Production Process Improvement Teams (P.I.T.) Q.A. Mfg. Eng.
19 Lean Management Day-by-Hour Charts Staffing Grids Tier Tier Boards Tier 1: For Technicians, by Technicians Tier 2: Supervisors and dedicated support (PIT Teams) Tier 3: Value Stream Manager and Staff Members
20 The Kick-Off

21 Gemba Kaizen Events

22 Value Stream Mapping

23 Load Charting

24 Spaghetti Chart

25 New Layouts

26 Lean Management System

27 The Improvements

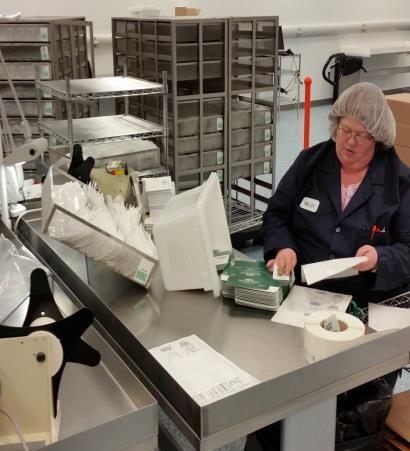
28 New Process Meet Penny

29 New Process Meet Sheldon

30 New Process Meet Howard

31 From Batch

32 To Flow
33 Efficiency Improvements 1, Process

34 Old Process

35 New Process Water Spider

36 New Process Meet Frodo

37 WIP Racks for Sale
38 Results and cautions!
39 WIP (Beware Equivalent Units!)
40 550,000 Product 1, WIP (Equivalent Units) 500, , , , , , ,000 Jan-13 Feb-13 Mar-13 Apr-13 May-13 Jun-13 Jul-13 Aug-13 Sep-13 Oct-13 Nov-13 Dec-13
41 800,000 Product 1, WIP (Equivalent Units) + 17% 600, , ,000 Jan-13 Feb-13 Mar-13 Apr-13 May-13 Jun-13 Jul-13 Aug-13 Sep-13 Oct-13 Nov-13 Dec-13 Jan-14 Feb-14 Mar-14 Apr-14 May-14 Jun-14 Jul-14
42 800,000 Product 1, WIP (Equivalent Units) 600, , ,000 -
43 Process 1 WIP (Equiv. Units Avg.) 500, , , ,315-32% 400, , ,000 B A + 12% 278, ,000 S 200, , ,000 E L I N - 39% 50,000 E
44 Process 2, Product A WIP (Avg.) 400, , , , , % 250, , , ,000 50,000 B A S E L I N E 60,669-82%
45 Cycle Time
46 Process 1 Cycle Time (Days) % % B A S E L I N E - 9%
47 Process 1 Lot Std. Dev. (Avg. Days) B A 10 8 S E L 8-65% 6 I N - 53% E - 25%
48 Process 1, Max. CT (Days) B A S E L I N % - 86% 50 E 50-73%
49 400 Process 1, Lots Completed 24 Hrs. (Lot Count) Normal Distribution % Non-Normal Distribution 0.1% Normal Distribution 0.2%
50 Cost
51 $4,500,000 Process 1 Cost and Throughput (proj.) + 4% 10,000,000 $4,000, % 0 % 9,000,000 $3,500,000-1% 8,000,000 $3,000,000 $2,500,000 B A - 15% - 6.5% 7,000,000 6,000,000 $2,000,000 S E -22% 5,000,000 4,000,000 $1,500,000 L 3,000,000 $1,000,000 $500,000 I N E 2,000,000 1,000,000 $ (Proj.) 0 Cost TH
52 Putting it all together

53 Put it all together to tell the story
54 Our Advice on your Lean Journey Support from the top Start small It doesn t need to be pretty Celebrate success big and small Beware of quick automation, Lean first Involve everyone, even the grumpy ones
55 Our Advice on your Lean Journey Be transparent Take pictures to tell your story Involve the right people Avoid scope creep get early wins
56
57 Thank You! Please complete the session survey at: Session: WP/24 Lean, team-based medical device manufacturing David Hurley Alcon