Comparative Assessment of Triveni Supermarket, Margin free Markets and Private..
|
|
|
- Camilla Henderson
- 5 years ago
- Views:
Transcription
1 COMPARITIVE ASSESSMENT OF TRIVENI SUPERMARKET, MARGIN- FREE MARKETS AND PRIVATE SUPERMARKETS USING SELECTED RETAIL VARIABLES 7 C o n t e n t s 7.1 Measures 7.2 Validity and Reliability of Data 7.3 Retail factor variables considered to compare Triveni Supermarkets with Margin-Free Markets and other Private Supermarkets 7.4 Factor Analysis Using the Selected Retail Variables of Private Supermarkets 7.5 Factor Analysis Using the Selected Retail Variables of Triveni Supermarkets 7.6 Factor Analysis Using the Selected Retail Variables of Margin- Free Supermarkets 7.7 Comparative Assessment of Triveni Supermarkets, Margin- Free Markets and Private Supermarkets Using Selected Retail Factors 7.8 Statistical Tests for Comparing the Outlets Consumer goods retailing has become a highly competitive form of business as many players offer the same categories of products in the same areas. At the same time, because of a number of reasons, the retailing of consumer goods has been an attractive sector of business. As a result, different types of players have established ventures in almost all places of the country with the objective of making maximum returns. Large scale retail outlets like supermarkets or hypermarkets or value chain stores or margin free consumer stores offer products to the public in almost all towns of Kerala and in rural areas. Retailing is a customer -driven marketing strategy comprising the art 361
2 Chapter -7 and science of choosing target markets and building profitable relations with customers. To design a winning marketing strategy, the marketing manager must answer two important questions: what customers to serve (what is our target market)? And how can we serve these customers best (what is our value proposition?)? (Philip Kotler. 2008) 1. Supermarkets offer numerous consumer products under one roof and provide the convenience of self service. They normally display a wide range of packed products in racks and the space layout may suit the free movement of customers from rack to rack to select their preferred brands. They incepted the concept of self service from full service where the customers enjoy the advantages of seeing, feeling, touch and assurance (Prathibha & Sharma. 2011) 2. Modern consumers seek improved availability of goods and quality, reasonable price, pleasant shopping experience, services, etc. All these retail variables are inevitable for the long run success of a large consumer store. The present study intends to compare the Triveni Supermarkets, Margin- Free Markets and Private Supermarkets on the basis of the responses of common customers of these three types of outlets on selected retail variables by the factor analysis method. Triveni Supermarkets are in the cooperative sector, managed and controlled by the CONSUMERFED. Margin- Free Supermarkets are retail outlets supplying consumer goods and work under a charitable society known as the Consumer Protection and Guidance Society. Both types of retail outlets are found in all parts of the state of Kerala. Likewise, hundreds of single and chain supermarkets exist in all parts of Kerala managed by individuals and corporate entities. All these three types of consumer stores compete with one another in the supply of food grains and other consumer goods. In the light of stiff competition between these types of stores success depends upon the consumers 362
3 response to the stores based on their perception on pricing strategy, quality of goods, service attractiveness, facilities offered, etc. 7.1 Measures For measuring the opinion of customers for the purpose of comparing the outlets such as Triveni Supermarkets, Private Supermarkets and Margin- Free Markets 18 variables are used. Some of the attributes in the study were selected taking in to account the Asian Shoppers Pyramid as given in the research conducted by IBM for Coca Cola Research Council. According to this pyramid, the attributes selected varied from basic to value attributes. The attributes comprise price, quality, choice, location, offers and discounts, service level and store size. Other attributes applicable to supermarkets such as attractiveness in display, space layout in the store, quality of packing, complaint redress mechanism, speed in billing, cleanliness in the shop, parking facilities and the availability of fresh stock are also included in the present study. In this part of the study, the consumers of Triveni Supermarkets who use Margin-Free Markets and other Private Supermarkets (outlets offering food and grocery) were asked to rate their perception on eighteen retail variables applicable to these three types of outlets separately and these data were used to compare the stores. The seven point scale (7 means highest and 1 means lowest )-one of the most commonly used scales among marketing researchers to assess psychographic variables-is used for collecting responses from selected common customers (Hair Jr.2004) 3. Statistical tools Factor Analysis, One way ANOVA and Repeated Measure MANOVA are used in the study. Exploratory Factor Analysis Method is used to reduce the large number of variables in to classes for drawing meaningful conclusions. Repeated Measure MANOVA is a suitable tool as the data is collected from Triveni customers who also frequently use other types of retail outlets. The validity 363
4 Chapter -7 and reliability of the scales are assessed to identify and preclude any unreliable and/or invalid measure that could arise from using multiple items (Field.A.2000) 4. Initially, a content validity was assessed to ensure that the instrument contained the representative sample of the universe of the subject matter of interest (J.Stevans.1998) 5. This was done by examining the questions for clarity and completeness using feedback from experts. 7.2 Validity and Reliability of Data Before assessing construct validity, correlation matrix of variables was drawn to check for multi- colinearity, communalities of all items individually to understand the common variance within items. Discriminant validity was assessed through principal component analysis using Verimax rotation, and factor correlation matrix (Cheng. 2001) 6. Only those variables were retained which had Eigen values greater than unity and only those items were retained which had a factor loading greater than Convergent validity was assessed through factor loading and item-total correlations (Cooper & Schindler 2006) 7. For factor loading, the commonly accepted value is 0.3 and above (Hair Jr. 2004) 8. This was done to determine the number of factors needed for the study. Reliability was assessed through Cronbach s alpha, alpha if item deleted, and item correlations are used to assess internal consistency. All the tests used in this research were done using the statistical programme Statistical Package for Social Sciences (SPSS- 17). 7.3 Retail factor variables considered to compare Triveni Supermarkets with Margin-Free Markets and other Private Supermarkets Triveni Stores, Margin- Free Markets and Private Supermarkets offer the same type of consumer goods to the public and their outlets are located in the 364
5 same areas and so they have to compete with one another. All these outlets claim to sell quality consumer goods at low prices. Essential goods used for food preparation like food grains, powdered grains and other powders and oil, sugar, biscuits, nuts and other packed bakery items, cleaning items, personal and home care products and other staple items are commonly offered by these three outlets. The price level and quality of these items as perceived by the common customers, service attractions, promotions, space layout, availability of brands, etc offered by the three outlets are considered for the study. The pilot study has revealed that 18 variables are important in determining the competency of a consumer retail outlet to satisfy their customers. The presumed retail variables used to collect data in the study are 18 in number. Common customers of these three types of outlets are asked to rate each variable applicable to these outlets in the light of their perception. These eighteen variables are factored in to six factor variables by using Factor Analysis Method with the help of SPSS. Then the mean scores of the individual variables as well as factor variables (cumulated mean scores of variables included in the factor) are computed. The mean scores of factor variables so computed are used in the comparison of Triveni Stores with Margin-Free Markets and other Private Supermarkets in Kerala. Variables used in the study to compare the types of consumer stores are: 1) Price of food and groceries 2) Quality of food and groceries 3) Price of convenience goods 4) Quality of convenience goods 5) Customer personal care 6) Availability of fresh stock 7) Availability of brands 365
6 Chapter -7 8) Location advantages 9) Attractiveness in display 10) Space layout in store 11) Quality of Packing 12) Parking facilities. 13) Complaint redress mechanism 14) Speediness in billing 15) Discount available 16) Cleanliness in the shop 17) Facilities such as toilet, water,seating facilities, etc 18) Working hours Data about the above mentioned eighteen retail variables are collected at the seven point scale for comparing Triveni Supermarkets with Margin-Free Markets and other Private Supermarkets. 7.4 Factor Analysis Using the Selected Retail Variables of Private Supermarkets Private Supermarkets are retail outlets offering consumer goods and they claim that they offer quality goods at lowest prices. In the study, they are perceived to a type of consumer stores and do not mean a particular private supermarket. Customers selected (Respondents) for collecting sample data were common customers of the Private Supermarkets, Margin- Free Markets and Triveni Supermarkets. The sampled customers claimed that they use the three types of consumer outlets simultaneously for purchasing essential and household items. The Exploratory Factor Analysis technique is used in the study to reduce the number of variables for assessing the customer rating about the three types of stores. Factor Analysis is a statistical technique designed to 366
7 represent a wide range of variables on a smaller number of dimensions. For using this technique, Factor Correlation Matrix, Communalities Table, table provides Eigen Values and Rotated Component Matrix are used. It has been ensured from correlation matrix that eighteen retail variables are not correlated each other. Factor Analysis is a data reduction technique which identifies a small number of factors that explain most of the variance observed in a large set of variables. This is generally employed to generate hypothesis regarding causal mechanism for a problem. Using the correlation structure, factor analysis is employed to identify underlying hypothecated variables called factors that explain the correlation pattern explained. The KMO and Bartlett's Test is used for knowing the suitability of the collected data for factor analysis. Table 7.1 KMO and Bartlett's Test Kaiser-Meyer-Olkin Measure of Sampling Adequacy..710 Bartlett's Test of Sphericity Approx. Chi-Square Df 190 Sig Table 7.1 shows the results of KMO and Bartlett's Test. The Kaiser- Mayer-Olkin Measure of Sampling Adequacy is a statistic that indicates the proportion of variance in the variables that might be caused by underlying factors. High values (close to 1.00) generally indicate that generally factor analysis is useful with the data set and the values; less than 0.50 indicates that the results of the factor analysis are not very apt in the context. The result of KMO and Bartlett's Test indicates that the factor analysis is appropriate for 367
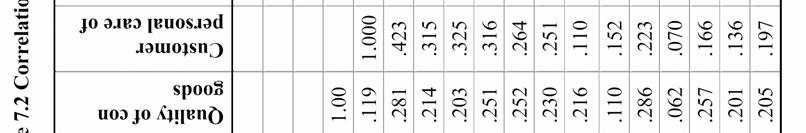
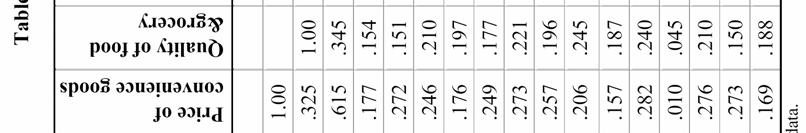
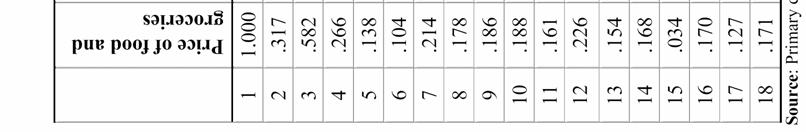
8 Chapter -7 the present data base, as the KMO value is.770 (between 0.50 and 1.00) and statistical results of Bartlett s test of sphericity are significant (where p=0.000 with df 190) for the factor correlations with in a correlation matrix. Small values less than 0.05 of the significance level indicate that a factor analysis is useful to a particular set of data set. From the KMO and Bartlett's Test, we can observe that the significance level is <0.05, indicating the data is appropriate to conduct a factor analysis for the study. The correlation matrix of the variables extracted is given below. 368
9 369
10 Chapter -7 The correlation matrix would help to assess the discriminant validity of the exploratory tendency of the variables. The correlation matrix shown in Table 7.2 depicts that no significant correlation exists between any of the variables. The correlation co-efficient were far below the 0.85 cut off mark, (Gerberg & Anderson.2008) 9 which was used as rule of thumb. This implies that there is no conceptual overlapping among the variables, and discriminant validity of the sub-scales is proved once again. The output from analysis is viewed after validating the variables using the communalities. Table 7.3 Communalities extracted for the retail variables of Private Supermarkets Variables Initial Extraction Price of food and groceries Quality of food and groceries Price of convenience goods Quality of convenience goods Customer personal care Availability of fresh stock Availability of brands Location advantages Attractiveness in display Space layout in store Quality of Packing Parking facilities Complaint redress mechanism Speediness in billing Discount available Cleanliness in shop Facilities such as toilet, water, seating facilities Working hours Extraction Method: Principal Component Analysis. 370
11 Since all extraction communalities are fairly large (>0.482) it is supposed to be a good set of variables. The principal component extraction followed by varimax rotation are reported in the following table. Table 7.4 Total Variance Explained for retail variables of Private Supermarkets Comp onent Initial Eigen values Total % of Varian ce Cumul ative % Total Extraction Sums of Squared Loadings % of Varian ce Cumul ative % Total Rotation Sums of Squared Loadings % of Varian ce Cumul ative % Extraction Method: Principal Component Analysis, Rotation method: Vermax with Kaiser Normalisation; N = 432 It is a general practice in factor analysis to consider as many factors as there are Eigen values greater than1 (Eigen Values are variances to the factors). Using this procedure, six factors are found dominant which cumulatively 371
12 Chapter -7 account for about per cent of explanation of total variance. Therefore, eighteen variables will have to be classified in to six factor variables, which are enough to explain all these variables. The associated rotated component matrix is given below: Table 7.5 Rotated Component Matrix for the retail variables of Private Supermarkets. Variables 372 Component Price of food and groceries Quality of food and groceries Price of convenience goods in Quality of convenience goods Customer personal care Availability of fresh stock Availability of brands Location advantages Attractiveness in display Space layout in store Quality of Packing Parking facilities Complaint redress mechanism Speediness in billing Discount available Cleanliness in shop Facilities such as toilet, water Working hours Extraction Method: Principal Component Analysis. Verimax Rotation The rotated component matrix in table 7.5 shows that there were no cross- factor loadings of the variables (above absolute value of loading).this proves the discriminant validity of the sub-scales.
13 From this matrix using the factor loadings, it is seen that the first factor is loaded with five variables i.e. Space layout, Quality of packing, Complaint redressel, Parking facilities and Speediness in billing. Most of the variables in this group are more or less related with self service and service provided by the outlets and the factor is named Service. The second factor loading shows another five variables can be grouped as another factor. They are Customer Personal care, Availability of fresh stock, Availability of various brands, Location advantages and Attractiveness in display. This factor is named Availability and Ambience. As per the Rotated Component Matrix, another three variables show the maximum coefficient values are Cleanliness in the shop, Facilities such as drinking water, seating arrangements, etc. and Working hours of the outlet. These retail variables determine the facilities in a store and so the factor is named Facilities. The fourth factor variable includes two variables, viz. Quality of food and grocery and Quality of other convenience goods. The factor is named Quality of Goods As per factor loading, the fifth factor is named Price of Goods as it include two variables- 1) Price of food and grocery and 2) Price of other convenience goods. Discount is the only variable included in the sixth factor named Discount. Hence, Eighteen selected retail variables used for comparing the three types of consumer outlets are reduced to six retail factors such as: 1) Service, 2) Availability and Ambience, 3) Facilities, 4) Quality of Goods,5) Price of Goods and 6) Discount. Hereafter, these generated factor variables are used for comparative analysis of the three types of outlets. 373
14 Chapter -7 Table 7.6 List of Retail Variables Loaded in Retail Factors Name of Retail Factor Variables used for comparing Triveni Supermarkets with Margin-Free Markets and Private Supermarkets Retail Variables 1. Service 1. Space layout in store 2. Quality of Packing 3. Parking facilities 4. Complaint redress mechanism 5. Speediness in billing 2. Availability and Ambience 1. Customer personal care 2. Availability of fresh stock 3. Availability of brands 4. Location advantages 5 Attractiveness in display 3. Facilities 1. Cleanliness in shop 2. Facilities such as toilet, water 3. Working hours 4. Quality of Goods 1. Quality of food and grocery 2. Quality of other convenience goods 5. Price of Goods 1. Price of food and groceries 6. Discount 1. Discount 2. Price of other convenience goods. The factor variables The set of variables generated through factor analysis are named 1. Service, 2. Availability and Ambience, 3. Facilities, 4. Quality of Goods, 5. Price of Goods and 6. Discount. Hereinafter, they will be referred to as factor variables. The following table shows the factor variables, number of variables included in factor variables, mean value of variables and standard deviation of factor variables of Private Supermarkets. 374
15 Table 7.7 Descriptive of Retail Factor Variables of Private Supermarkets Sl.No. Factor Variables No. of variables included Mean scores of factor variables Comparative mean of factors Standard deviation of factor variable 1 Service Availability and Ambience 3 Facilities Quality of goods Price of goods Discount As per the table 7.7, the mean scores of the retail factor variable Price of Goods in private supermarket is and the Quality of Goods is It means that private supermarkets charge high prices to their products and the quality is also high. Though the price and quality match, the price is comparatively high. As per the rating of customers, the discount offered by the supermarkets is low as its mean score is The parametric test, one way ANOVA (F- test) is attempted to test whether any significant variations exist in the mean values of retail factors of private supermarkets among the central, southern and northern regions of Kerala. One way ANOVA is most appropriate when dealing with categorical independent variables and continuous (interval) dependent variables (Norman& Streiner. 1994) 10. Hypothesis H 0 : There is no difference in the means of retail factor variables of Private Supermarkets among the regions. H 1 : There is difference in the means of retail factor variables of Private Supermarkets among the regions. 375
16 Chapter -7 For validating the hypothesis one way ANOVA is used. Table 7.8 shows F-Test having Sum of Squares, df, Mean Squares, F values and Significant levels of all the six variables considered. Table 7.8 ANOVA table : Region-Wise Variations of Retail Factor Variables of Private Supermarkets Factors Sum of Squares df Mean Square SERVICE Between Groups Within Groups Total AVAILABILITY AND Between Groups AMBIENCE Within Groups Total FACILITIES Between Groups Within Groups Total QUALITY OF GOODS Between Groups Within Groups Total PRICE OF GOODS Between Groups Within Groups Total DISCOUNT Between Groups Within Groups Total As seen from the ANOVA table, in all six factor variables the null hypothesis is rejected since p <.05. It is therefore, proved that there exists significant difference in the level of performance perceived by customers while considering all retail factor variables of Private Supermarkets among the central, the southern and the northern regions of Kerala. F Sig. 376
17 7.5 Factor Analysis Using the Selected Retail Variables of Triveni Supermarkets As per the opinion given by common customers of the three types of enterprises, the selected retail variables of Triveni Supermarket were factored into six retail factors using factors generated for Private Super Markets using the same method. Retail factor variables of Triveni Supermarkets so obtained are considered below and their mean values and standard deviations ascertained are given below. Sl. No. Table 7.9 Descriptive of retail factor variables of Triveni Supermarkets Retail Factor Variable No. of variables included Mean scores of factor variable Comparative mean of factors Standard deviation of factor variable 1 Service Availability and Ambience 3 Facilities Quality of goods Price of goods Discount The mean scores of retail factor variable Price of Goods (5.46) of Triveni Supermarkets and the mean score of Quality of Goods (10.51) reveal that they charge comparatively low prices and the quality of goods rated by the sample customers is high. The customer rating for discount is also high (5.71) and it indicates that they supply goods at a low price. The following hypothesis is generated to recognize the variation of mean scores of factors among regions. Hypothesis H 0 : There is no difference in the means of retail factor variables of Triveni Supermarkets among the regions. H 1 : There is difference in the means of retail factor variables of Triveni Supermarkets among the regions. 377
18 Chapter -7 For testing the hypothesis on mean differences of retail factor variables one way ANOVA is used. Table 7.10 depicts whether region-wise variation exists in the mean scores of factor retail variables of Triveni supermarkets. Table 7.10 ANOVA table : Region-wise Variations of Retail Factor Variables of Triveni Supermarkets Service Factors Availablity And Ambience Facilities Quality of Goods Discount Price of Goods Sum of Squares df Mean Square F Sig. Between Groups Within Groups Total Between Groups Within Groups Total Between Groups Within Groups Total Between Groups Within Groups Total Between Groups Within Groups Total Between Groups Within Groups Total ANOVA table depicts Mean Square, F- values and the significant levels (p values) of all the six factor variables considered. The null hypothesis is rejected as p <.05 and the alternative hypothesis is accepted as there exists significant difference in the means of all retail factor variables of Triveni Supermarkets among the three regions. This shows that there is 378
19 significant difference in the performance of Triveni Stores among various regions based on the responses of the respondents. 7.6 Factor Analysis Using the Selected Retail Variables of Margin- Free Supermarkets As per the opinion given by common customers of the three types of enterprises, the selected retail variables of Margin- Free Markets are (rated by customers) factored into six factors using factors generated for Private Supermarkets as the reference. Retail factor variables of Margin-Free Markets so obtained are given below and their mean values and standard deviations ascertained are also given in the table Sl. No. Table 7.11 Descriptives of retail factor variables of Margin-Free Markets No. of variables included Mean scores of factor variable Comparative mean of factors Standard deviation of factor variable 1 Service Availability and Ambience 3 Facilities Quality of goods Price of goods Discount As per the table 7.11, it is seen that the mean value of the retail factor variable Price of Goods (10.14) was higher than that of the factor variable Quality of Goods (8.86) and the average rating for discount was also low. This led to the conclusion that Margin-Free Markets charge comparatively higher prices for the goods compared to the quality of goods that they offer. The comparative ratings given by the selected customers for Margin-Free Markets led us to conclude that the quality of goods and the price of goods offered by this type of stores do not match. It was also found that these stores offer low discount as well as premium 379
20 Chapter -7 products to the customers. To identify the variation among the regions are significant or not, the following hypothesis is framed Hypothesis H 0 : There is no difference in the means of retail factor variables of Margin-Free Markets among the regions. H 1 : There is difference in the means of retail factor variables of Margin- Free Markets among the regions. For validating the hypothesis, one way ANOVA is used. Table 7.12 ANOVA table for testing region-wise variations of factor retail variables of Margin- Free Markets. Factors Sum of Squares df Mean Square Service Between Groups Within Groups Total Availability and Between Groups Ambience Within Groups Total Facilities Between Groups Within Groups Total Quality of Goods Between Groups Within Groups Total Price of Goods Between Groups Within Groups Total Discount Between Groups Within Groups Total F Sig. 380
21 As seen from the ANOVA table 7.12, by evaluating the, Mean Squares, F values and sig. level of factor variables, all factor variables except Price of Goods, the null hypothesis is accepted as p >.05. It is inferred that there exists no difference among the means of retail factor variables Service, Availability and Ambience, Facilities, Quality of Goods and Discount of Margin-free markets among the regions. This shows there is no significant difference in the responses of customers relating to the five factors mentioned above among the three regions. In the case of factor variable Price of goods, the null hypothesis is rejected as P<.05. Here the alternative hypothesis is accepted as there is significant difference among the means of this factor variable of Margin-Free Markets among the regions. 7.7 Comparative Assessment of Triveni Supermarkets, Margin- Free Markets and Private Supermarkets Using Selected Retail Factors For comparison, the mean scores and standard deviations of factor variables of the three types of stores are considered. Mean scores obtained for factor variables are used for drawing bar diagrams, which will lend clarity to the comparison of the retail outlets. Repeated measure MANOVA will be useful in this respect to test whether statistically significant differences exist among the three types of retail outlets. Here two types of tests are resorted to: 1) Test for knowing whether significant differences exist among the means of retail factor variables for the three different types of retail outlets and 2) Test for knowing whether significant differences exist among the means of retail factors for the outlets on regions, income levels of customers and the areas of residence of customers. 381
22 Chapter -7 Table 7.13 Group Statistics of Retail Factor Variables for the comparison of three types of supermarkets Mean scores Std. Deviation Sl. No Retail Factors Triveni Superma rkets Margin- Free Markets Private Superma rkets Triveni Superma rkets Margin- Free Markets Private Superma rkets 1 Service Availability and Ambience Facilities Quality of Goods Price of Goods Discount Retail factor Service Table 7.13 gives the mean values and standard deviations of retail factor variables of all the three types of retail outlets studied. Comparing the mean value of factor variable Service of the three types of retail outlets, Triveni Supermarkets (24.15) stay behind the Private Supermarkets (25.42) but occupy a better position than the Margin- Free Markets (20.68).. However, Triveni stores are not at all far behind Private supermarkets as their mean values do not have much difference (25.42 and 24.15). But, Margin- Free Markets are far behind Private Supermarkets and Triveni Supermarkets in this regard. Considering the customer rating on satisfaction, variables included in the factor, namely space layout, quality of packing, parking facilities, complaint redress mechanism and speediness in billing are found to be comparatively better in the Private Supermarkets than in the other two types of retail outlets. This suggests that Triveni Supermarkets and Margin- Free Markets need to 382

23 improve their performance in the variables mentioned in the factor Service to make them more competitive enterprises in the retail business. Their quality of packing is better than that of Private Supermarkets and they redress the complaints of customers satisfactorily. Figure 7.1 Comparative analysis of mean score of three retail outlets on Retail factor Service Retail factor: Availability and Ambience In the case of Retail factor Availability and Ambience, Triveni Supermarkets are in the second position based on the mean value of the customer rating (23.8), Private Supermarkets have secured the highest mean score in the factor Availability and Ambience variables (25.71) and Marginfree Markets having mean value, occupies third position in this respect. Therefore, customer personal care, availability of fresh stock and brands, location advantage and attractiveness in display are perceived to be better in Private Supermarkets than in the other two. From this one can safely infer that without equipping Triveni staff to offer better care for customers and making 383

24 Chapter -7 available popular brands and fresh stock through Triveni outlets, the enterprise cannot hope to compete with Private Supermarkets. This is applicable to Margin- free markets as well. Again, it is desirable for Triveni Supermarkets and Margin-Free Supermarkets to focus on better attractiveness in the display of products. Figure 7.2 Comparative analysis of mean score of retail outlets on Retail factor Availability and Ambience Retail Factor variable: Facilities The mean value of retail factor Facilities is found highest in Private Supermarkets (15.63), compared to Triveni Stores (13.78) and Margin- Free Markets (12.76) as per the ratings provided by the selected respondents. This shows that the latter two types of retail outlets should certainly improve their facilities such as cleanliness in the store, seating arrangements to customers, drinking water facilities, etc. to engage in a healthy competition with modern private retail outlets. 384
25 Figure 7.3 Comparative analysis of mean scores of retail outlets on Retail factor Facilities Retail factor: Quality of Goods The fourth retail factor variable considered and used for comparison between the three type of consumer outlets is Quality of Goods. The mean scores of the factor for Triveni, Margin- Free and Private Supermarkets are 10.51, 8.86 and respectively. It shows that the quality of goods is better in Triveni Supermarkets compared to Margin-Free Markets but inferior compared to Private supermarkets. This is considered a state of dereliction as Triveni Stores and Margin- Free Markets are poor in supplying quality goods. Sooner, they will reach a derogatory stage unless and otherwise they supply quality goods to the customers in the near future. 385
 compared to Private Supermarkets (12.01) and Margin-Free Supermarkets (10.14). The mean difference among the three types of outlets shows the existing price variations among the supermarkets.")
26 Chapter -7 Figure 7.4 Comparative analysis of mean score of retail outlets on Retail factor Quality of Goods Retail factor: Price of Goods Price, the fifth retail factor variable depicts that as per customers rating Triveni Supermarkets charge very low price for goods (5.46) compared to Private Supermarkets (12.01) and Margin-Free Supermarkets (10.14). The mean difference among the three types of outlets shows the existing price variations among the supermarkets. The price level of Triveni Supermarkets is far below that of the other two types of enterprises. Private Supermarkets and Margin-Free Markets are private entities, they charge highest price for commodities which depicts their undue attitude for making more profit through exploiting customers. 386
27 Figure 7.5 Comparative analysis of mean score of retail outlets on Retail factor Price of Goods Retail factor: Discount Discount is the amount of reduction offered from the printed price given on the package of articles or it is the amount of difference perceived by the customer compared to the general price prevailing in the neighborhood stores. The following chart shows the comparative mean scores of the factor variable Discount of Triveni, Margin-Free and Private Supermarkets. Figure 7.6 Comparative analysis of mean score of retail outlets on Retail factor Discounts 387
28 Chapter -7 It is clear from the above diagram that, Triveni Stores are far ahead in the mean scores of the retail factor Discount of other two types of private consumer outlets as the Triveni Stores has a mean value of 5.71 (Margin- free markets and Private Supermarkets-2.65). This means that the rate of discount offered by Triveni consumer outlets is considerably higher than the other two types of outlets compared based on customer opinion and comparative assessment. 7.8 Statistical Tests for Comparing the Outlets To compare the set of retail factor variables of the three types of outlets, repeated measure MANOVA is used. These six factor variables are considered under MANOVA to assess the variations in their behavior among Triveni Supermarkets, Margin-Free Markets and Private Supermarkets. A repeated measure MANOVA is used when all the members of a random sample are measured under a number of different conditions. As the sample is exposed to each condition in turn, the measurement of the dependent variable is repeated. Using a standard MANOVA in this case is not appropriate because the repeated measures tend to be correlated: the data violate the MANOVA assumption of independence. For example, one can use a repeated measure MANOVA to compare the factor variables obtained from among the sample respondents repeatedly at the three retail outlets considered in this exercise. A sample member is called a subject. When a set of dependent variables is measured repeatedly for all sample members across a set of conditions, this set of conditions is called a withinsubjects factor. The conditions that constitute this type of factor are called trials. The selection of the 3 retail outlets might be on certain conditions which constitute within-subjects factor for the problem. 388
29 When a dependent variable is measured on independent groups of sample members, where each group is exposed to a different condition, the set of conditions is called a between-subjects factor. The conditions that constitute this factor type are called groups. In this case the regional groups will be between-subjects factor. When an analysis has both within-subjects factors and between-subjects factors, it is called a repeated measure MANOVA with between-subjects factors. In this problem, the researcher aims at examining the impact of the type of retail outlets on factor one to factor six. To investigate the issue, data collected from a sample of individuals are grouped according to their characteristics. In addition to these between-subjects factors, a single within-subjects factor also is included in the analysis. Each subject's measurement on factor variables is at three levels i.e., of retail outlets, for convenience, and calling it as type. Within-Subjects Main Effect Does type influence factor variables? (Do means of factor variables change across the trials by type?) This is the test for a within-subjects main effect of time. Between-Subjects Main Effects Do regional, income levels or area -wise difference influence factor variables? (Do the three regions, five income levels and three areas have different means of factor variables?) This is the test for a between-subjects main effect of treatment difference. Within-Subjects by Between-Subjects Interaction Effects Do the regional, income level and area-wise influence on factor variables depend upon type? (Does the pattern of differences among means of factor 389
30 Chapter -7 variables for the regions, income levels or areas change at each type of retail outlet?) This is the test for a between-subject by within-subjects interaction of treatment preference by time. Within-Subject Tests: The Univariate versus the Multivariate Approach The first set of tests is for the within-subjects effects. When there are more than two levels of a within-subjects factor (here we have 3 levels), two different sets of within-subjects hypothesis tests: one using the multivariate approach, the other using the univariate approach is reported. Generally, both sets of tests yield similar results. Repeated measure MANOVA carries the standard set of assumptions associated with an ordinary analysis of variance, extended to the matrix case: multivariate normality, homogeneity of covariance matrices, and independence. Repeated measures MANOVA is robust to violations of the first two assumptions. Violations of independence produce a non-normal distribution of the residuals, which results in invalid F ratios. In addition to these assumptions, the univariate approach to tests of the within-subject effects requires the assumption of sphericity, which is described in more detail below. When sample sizes are small, the univariate approach can be more powerful, but this is true only when the assumption of a common spherical covariance matrix has been met. Mauchly's Sphericity Test and Epsilon Adjustment Values The test of sphericity, when requested, immediately precedes both sets of within-subjects tests. The test for the comparison of Triveni, Private Supermarkets and Margin- Mree markets in research in retailing, dataset appears below. 390
31 Within Subjects Effect Retail factors Table 7.14 Mauchly's Test of Sphericity b Approx. Epsilon a Mauchly's Chi- df Sig. W Greenhouse- Square Geisser Huynh- Feldt Lowerbound Services Availability and Ambience Facilities Quality of goods Price of goods Discount Tests the null hypothesis that the error covariance matrix of the orthonormalized transformed dependent variables is proportional to an identity matrix. a. May be used to adjust the degrees of freedom for the averaged tests of significance. Corrected tests are displayed in the Tests of Within-Subjects Effects table. Mauchly's sphericity test examines the form of the common covariance matrix. A spherical matrix has equal variances and covariances equal to zero. The common covariance matrix of the transformed within-subject variables must be spherical, or the F tests and associated p values for the univariate approach to testing within-subjects hypotheses are invalid. If the Chi-square approximation has an associated p value less than the alpha level, the sphericity assumption has been violated. The chi-square approximation for this test is significant at 5 per cent level for four out of six variables considered. Since this is less than the alpha level of 0.05, we can be confident that the data do not meet the sphericity assumption. Hence, multivariate tests are used. For practical purposes, these issues are important only in helping to decide which output to use, and if the output should be adjusted. If we use 391
32 Chapter -7 the univariate output, we may have more power to reject the null hypothesis in favor of the alternative hypothesis. However, the univariate approach is appropriate only when the sphericity assumption is not violated. If the sphericity assumption is violated, then in most situations it is better off staying with the multivariate output. (It amounts to using Multivariate output often) Test for knowing whether significant difference exists among the means of retail factor variables for three different types of retail outlets Multivariate Approach to Within-Subjects Tests: As noted above, the multivariate output is still valid even if the sphericity assumption is not met. SPSS prints the multivariate approach to testing the within-subjects factors after Mauchly's test of sphericity. The first multivariate test of a within-subjects effect is the within-subjects main effect test. It examines changes in factor variables as a function of type of retail outlets considered. The null hypothesis is that the means of factor variables do not change across different types of retail outlets considered. Hypothesis: H 0 : There is no difference in the means of factor variables for different types of retail outlets. H 1 : There is difference in the means of factor variables for different types of retail outlets. 392
33 factor1 Table 7.15 Multivariate Test for Within-Subjects Main Effect Within Subjects Effect Value F Hypothesis df Error df Sig. a. Exact statistic Pillai's Trace Wilks' Lambda a Hotelling's Trace Roy's Largest Root b b. The statistic is an upper bound on F that yields a lower bound on the significance level. c. Design: Intercept + Region Within Subjects Design: factor1 d. Tests are based on averaged variables. There are four tests, each reporting a separate multivariate test statistic (Pillai s, Hotelling's, Wilks', and Roy's); among them the Wilks test is commonly used. These multivariate statistics are converted to F values. In some cases, the converted F and its degrees of freedom are approximations. When this is not the case, a note at the bottom of the output states that the statistics are exact. Since, the F ratio for this hypothesis is very large [F(12,1490) = , P <.0001], we confidently reject the null hypothesis and conclude that the means of factor variables change with type of retail outlets in the population from which the sample was drawn. This is concluded by stating that there exist significant differences in the means of all six retail factor variables for the three different types of retail outlets Test for the hypothesis that regional differences interact with type of retail outlets considered. Table 7.16 gives the region-wise mean scores and standard deviations of six factor variables of Triveni Supermarkets, Margin-Free Markets and Private Supermarkets. 393
34 Chapter -7 Table 7.16 Region-wise means and standard deviations of retail factor variables of the retail outlets. Retail factors Services Availability and ambience Facilities Quality of goods Price of goods Discount Region Triveni Supermarkets Margin-free Supermarkets Private Supermarkets Mean Std. Deviation Mean Std. Deviation Std. Mean Deviation Central Southern Northern Total Central Southern Northern Total Central Southern Northern Total Central Southern Northern Total Central Southern Northern Total Central Southern Northern Total Red: Above average and black: below average. 394
35 As wide variations exist among the means of factor variables in different regions for different types of retail outlets, following line charts are drawn to express these variations clearly and Multivariate test is used to identify the variations are statistically significant or not. Figure 7.7. Means of SERVICE Figure7.8. Means of Availability and Ambience 395
36 Chapter -7 Figure 7.9. Means of Facilities Figure Means of Quality of goods 396
37 Figure Means of Quality of goods Figure 7. 12: Means of Discount Under Repeated measure MANOVA format, Multivariate test is used for testing hypothesis of those regional differences interacting with type of retail outlets. 397
38 Chapter -7 Hypothesis: H 0 : There is no difference in the means of factor variables among regions for different types of retail outlets. H 1 : There is difference in the means of factor variables among regions for different types of retail outlets. Between- Subjects Effects Test To test whether the regional means of factor variables of the three types of outlets are significantly different between each other, between subjects main effect test is used and reported below. Table 7.17 Multivariate Test for Between-Subjects Main Effects for Region Between Subjects Effect Value F Hypothesis df Error df Sig. factor1 * Region Pillai's Trace Wilks' Lambda Hotelling's Trace Roy's Largest Root b In this instance, as per Wilks test (most commonly used test), the F value associated with these multivariate tests of the interaction is ; therefore, the associated p value is low [F(24,2600) = , p <.0001]. Hence the null hypothesis is rejected and it is concluded that variations in the means of factors across type of retail outlets depend upon regions. Within-Subjects by Between-Subjects Interaction Effects for Region Following is the multivariate test of significance for within-subjects by between interaction effects for region. 398
39 Table 7.18 Tests of Hypotheses for Between Subjects Effects for Region Source Region Retail factors Type I Sum of Squares df Mean Square F Sig. Service Availability and Ambiance Facilities Quality of goods Price of goods Discount This is the sum of squares, degrees of freedom, and mean square for region. This test also shows the F value and associated p value for the test of the group hypothesis. In this case, a p value less than.0001, has a statistically significant effect (using the alpha criterion of.05 to define "statistical significance"). It is therefore, concluded that a statistically significant difference exists among regions with respect to the means of factor variables. This clearly shows that regional mean values of all the three types of outlets are different. In other words; there is a main effect for treatment difference. This shows that the perception of selected customers is varied with the performance of outlets considering different regions of Kerala Test for the hypothesis to know whether income level difference interacts with type of retail outlets. It has been understood that statistically significant difference exists among regions with respect to the means of factor variables of three types of retail outlets. Yet another test is resorted to here to understand whether significant difference exists among income levels of customers with respect to the means of six factor variables of Triveni Supermarkets, Margin-Free Markets and Private Supermarkets. Table 7.19 provides the mean scores and standard deviations on the basis of income levels of respondents of three types of retail outlets. 399