CONNECTED CONSUMER SURVEY 2017: MOBILE SERVICES AND DEVICES IN EUROPE AND THE USA
|
|
|
- Robyn Robertson
- 5 years ago
- Views:
Transcription

1 analysysmason.com RESEARCH SURVEY REPORT CONNECTED CONSUMER SURVEY 2017: MOBILE SERVICES AND DEVICES IN EUROPE AND THE USA ARIS XYLOURIS and INIGO BARKER
2 About this report This report focuses on aspects of Analysys Mason s Connected Consumer Survey that relate to the behaviour, preferences and plans of mobile users in Europe and the USA. In particular, it focuses on respondents usage of mobile services and devices. This part of the survey was conducted in association with Survey Sampling International (SSI). The research was conducted in May and June The survey groups were chosen to be demographically representative of the broader online consumer population. We set quotas on age, gender and employment status to that effect. There were a minimum of 1000 respondents per country, The total sample size was 7090 respondents. USA GEOGRAPHICAL COVERAGE Poland Germany UK France Spain Turkey KEY QUESTIONS ANSWERED IN THIS REPORT How strong are operators as smartphone sales channels and how does this relate to consumers choice of tariffs? What impact does 4G have on mobile users spend and engagement with their smartphones? What is the effect of 4G on customer satisfaction in terms of data speed and data allowances? What is the relationship between data usage and spend? Which activities drive engagement time on smartphones? WHO SHOULD READ THIS REPORT Operator-based strategy executives and marketing managers who are interested in understanding consumer market trends, the role of operators as smartphone distribution channels, and the impact of differing approaches to pricing in the market. Market intelligence and research executives in service providers that are responsible for understanding end-user trends and supporting business units in identifying and addressing new opportunities. Equipment/device manufacturers and software providers that want to identify end-user trends in service and device usage and help their operator customers to improve their ability to address market opportunities. 2
3 France Germany Poland Spain Turkey UK USA Time spent on mobile phone (minutes) Connected Consumer Survey 2017: mobile services and devices in Europe and the USA Total engagement time on mobile devices continued to increase partly because of ongoing migration from non-4g to 4G services in all markets Figure 5: Average time spent on mobile phone per day (minutes), by year and mobile network technology type Total, 2015 Total, G, G, 2017 Source: Analysys Mason 1 Question: Yesterday, how long did you use each of the following devices for? ; n = 7090 (n=7250, 2015). The average time spent on mobiles has increased, largely because of the behaviour of 4G users which has been magnified by the ongoing movement from non-4g to 4G services. The total engagement time on mobile devices has continued to increase. In markets such as Poland, Spain, Turkey and the USA, the total mobile engagement time exceeded the TV engagement time. The increase in the total mobile engagement time was, to a large extent, the result of legacy device users switching to smartphones and LTE-enabled devices, rather than an absolute increase in engagement time across the board. 4G users spent considerably more time on their mobile devices than non-4g users (211 minutes and 116 minutes, respectively). Where penetration is low, this is partly due to the early adopter effect, but in high penetration markets, it is due to the legacy base remaining at 3G. How non-4g and 4G usage differed can be explored on a more granular level. The average non-4g mobile data usage was 2.8GB whereas the average 4G mobile data usage was 6.7GB. 26% of non-4g users used their smartphones to watch a paidfor online TV service compared to 40% of 4G users. 24% of 4G users said they bought goods or services online frequently or very frequently compared to 13% of non-4g users. 10


4 More than 10% of contract customers in Europe reported being on allowances of more than 10GB Figure 9: Mobile service allowance distribution for contract customers, by country 1 1 Question: How much data is included in your plan/package? ; n=5289. The differences in data allowances between countries largely depend on the level of competition in each market. There are considerable differences in data plan sizes between countries. 36% of French respondents reported being on data allowances of more than 10GB. Large data allowances have become a staple of the French market, after having been initially incentivised by Free in 2014 with its 20GB plan for EUR Conversely, in Germany, the majority of users are in the 1 4GB tiers, largely constrained by high prices per GB. In the countries with the most users on sub-1gb allowances (Germany and the UK), 44% and 35% of respondents, respectively, reported being on allowances of up to 2GB. The main explanation for these divergences is the mobile market competition. By comparing the average data allowances by country to the Herfindahl Hirschman market concentration index (HHI) for each mobile market, we can identify a link between low HHI scores and higher average data allowances. There are other important factors that drive this trend that must be specified. In Poland and Turkey, despite low LTE penetration, the share of users on high data allowances is considerable, largely because mobile connectivity is often used in lieu of fixed broadband. In Spain, while prices per GB are higher than in some markets in our sample, the average data allowance is unexpectedly high, mostly due to the large data allowances provided to customers of converged bundles as part of promotional deals. 14

5 CONTENTS EXECUTIVE SUMMARY SMARTPHONE USAGE AND ENGAGEMENT ON 4G NETWORKS DATA USAGE AND MONETISATION OPERATORS ROLE AS SMARTPHONE CHANNELS METHODOLOGY AND PANEL INFORMATION ABOUT THE AUTHORS AND ANALYSYS MASON 27


6 About the authors Aris Xylouris (Senior Analyst) is the lead analyst of the Fixed Broadband Services programme and a key contributor to Analysys Mason's primary research for the Consumer Services research practice. His areas of specialisation include fixed broadband strategy, the bundling and pricing of multi-play and convergence services, customer satisfaction and consumer-facing marketing strategy. He also specialises in statistics, surveys and the analysis of primary research, and manages Analysys Mason's Connected Consumer Survey and Consumer smartphone analytics series of research. Inigo Barker (Research Analyst) is a member of the Consumer Services research term in London, working on the Video Strategies research programme. He previously worked in trade publishing and editing. He holds a first-class BA (Hons.) degree in Classics from the University of Cambridge. 28


7 Analysys Mason s consulting and research are uniquely positioned Analysys Mason s consulting services and research portfolio CONSULTING We deliver tangible benefits to clients across the telecoms industry: communications and digital service providers, vendors, financial and strategic investors, private equity and infrastructure funds, governments, regulators, broadcasters, and service and content providers. Our sector specialists understand the distinct local challenges facing clients, in addition to the wider effects of global forces. We are future-focused and help clients understand the challenges and opportunities that new technology brings. RESEARCH Our dedicated team of analysts track and forecast the different services accessed by consumers and enterprises. We offer detailed insight into the software, infrastructure and technology delivering those services. Clients benefit from regular and timely intelligence, and direct access to analysts. 29

8 Research from Analysys Mason 30
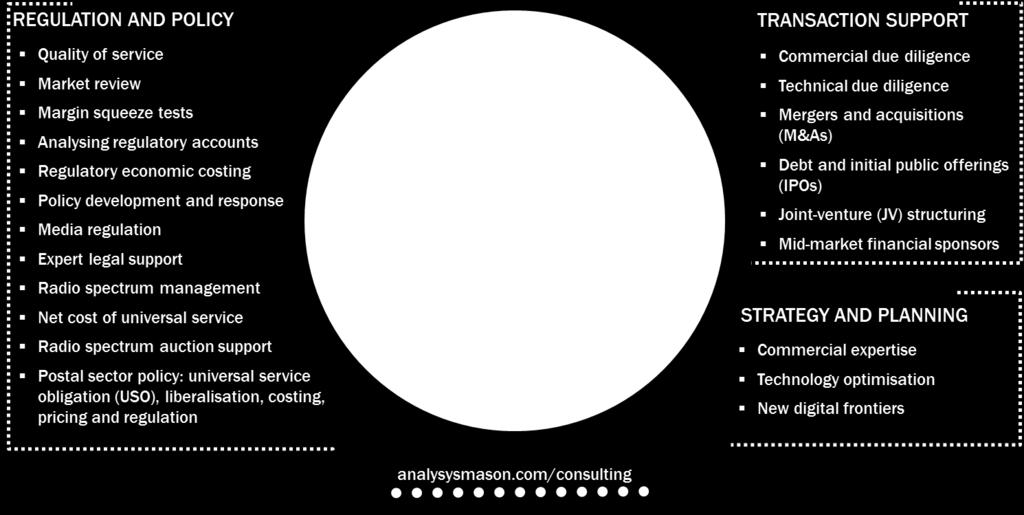
9 Consulting from Analysys Mason 31

10 PUBLISHED BY ANALYSYS MASON LIMITED IN MARCH 2018 Bush House North West Wing Aldwych London WC2B 4PJ UK Tel: +44 (0) Registered in England No All rights reserved. No part of this publication may be reproduced, stored in a retrieval system or transmitted in any form or by any means electronic, mechanical, photocopying, recording or otherwise without the prior written permission of the publisher. Figures and projections contained in this report are based on publicly available information only and are produced by the Research Division of Analysys Mason Limited independently of any client-specific work within Analysys Mason Limited. The opinions expressed are those of the stated authors only. Analysys Mason Limited recognises that many terms appearing in this report are proprietary; all such trademarks are acknowledged and every effort has been made to indicate them by the normal UK publishing practice of capitalisation. However, the presence of a term, in whatever form, does not affect its legal status as a trademark. Analysys Mason Limited maintains that all reasonable care and skill have been used in the compilation of this publication. However, Analysys Mason Limited shall not be under any liability for loss or damage (including consequential loss) whatsoever or howsoever arising as a result of the use of this publication by the customer, his servants, agents or any third party.