AFP Financial Planning & Analysis Learning System Session 1, Tuesday, April 4th (8:30-9:45) Cost Accounting Topics: Cost-Volume Profit Analysis
|
|
|
- Frank Caldwell
- 5 years ago
- Views:
Transcription
 Cost Accounting Topics: Cost-Volume Profit")
1 AFP Financial Planning & Analysis Learning System Session 1, Tuesday, April 4th (8:30-9:45) Cost Accounting Topics: Cost-Volume Profit Analysis
2 Chapters Covered Managerial and Cost Accounting: Part I, Domain B, Chapter 9 2
3 Financial vs. Managerial Accounting Financial Accounting Provides information for internal and external users Focuses on past results Follows GAAP or IFRS Reports on standard, externally mandated time spans Reports on the organization as a whole ManagerialAccounting Provides information for internal managers only Focuses on future results Follows rules to meet the particular needs of the organization Reports on various time spans dependent on the particular need Reports on any subset of the organization 3
4 Cost Classifications Direct Costs versus Indirect Costs DC are easily or directly traced to the cost object. E.g., direct materials and direct labor IC cannot be directly traced to the cost object. E.g., Manufacturing overhead Period versus Product Cost Period costs are expensed in period incurred. E.g., Marketing, selling & admin, interest expense. Product costs comprise inventory and CGS. E.g., Direct materials, direct labor, manufacturing overhead 4
5 Cost Allocation Methods Activity-based Costing Allocates per-unit overhead costs to products, services or customers Benefits-received Costing Allocates cost based on the benefit each cost objective received from the expense Equity or Fairness Method Based on a fair allocation price Subjective Ability-to-bear Allocates cost based on the object s ability to absorb the cost 5
6 Cost Behavior Patterns Cost Business Volume Fixed Variable Semi-Variable 6
7 More on Cost Behavior Patterns Over the short run or relevant range, Fixed costs drop per unit produced Variable costs per unit produced are constant Semi-variable costs drop per unit produced 7

8 Contribution Margin Revenue Variable Costs = Contribution Margin 8
9 Cost-Volume Profit Analysis Method of determining how many units need to be sold to break even or make a profit. break-even point sales $ profit loss total costs units 9
10 Break Even Quantity (BEQ) Break Even Quantity = Fixed Costs Contribution Margin Contribution Margin = Unit Sales Price (SP) Variable Costs per Unit (VC) 10
11 Example Variable $ Selling Price/Unit $0.50 Variable Cost/Unit $0.40 Fixed Costs $6,000 11
12 BEQ Example BEQ = $6,000 / ($0.50-$0.40) = 60,000 units Check operating income at a sales quantity of 60,000 units Operating Income = ($0.50*6,0000) ($0.40*6,0000) - $6,000 = $0 12
13 A More Difficult Version.. Selling Price/Unit $0.50 Variable Cost/Unit $0.40 Rent $1,000 Salary Paid for Periodic Servicing $4,500 Misc. Fixed Expenses $500 13
14 Break Even Revenues (BER) Break Even Revenues = Fixed Costs Contribution Margin Ratio Contribution Margin Ratio = (Selling Price-Variable Cost per Unit)/Selling Price Helpful when price per unit is not given 14
15 BER Example CMR = ($0.50-$0.40)/$0.50 = 0.20 BER = $6,000 / 0.20 = $30,000 in revenues is needed to breakeven 15
16 Noteworthy Relationships BEQ and BER vary directly with Fixed Costs BEQ and BER vary inversely with the Contribution Margin What about Targeted Operating Income? Just add Targeted Operating Income to Fixed Costs 16
17 BEQ: Noteworthy Relationships If fixed costs increase from $6,000 to $7,500, then BEQ = $7,500/$0.10 = 75,000 units If fixed costs decrease from $6,000 to $5,500, then BEQ = $5,500/$0.10 = 55,000 units 17
18 BEQ: Noteworthy Relationships If contribution margin increases to $0.20, then BEQ = $6,000/$0.20 = 30,000 units If contribution margin decreases to $0.05, then BEQ = $6,000/$0.05 = 120,000 units 18
19 Break Even with a Targeted Operating Income Assume that the goal is to earn operating income of $480 BEQ = $;,===>$?@= $=.B= = 64,800 units Break Even Revenues = $;,===>$?@= =.C= = $32,400 19
20 Graphical Analysis 20


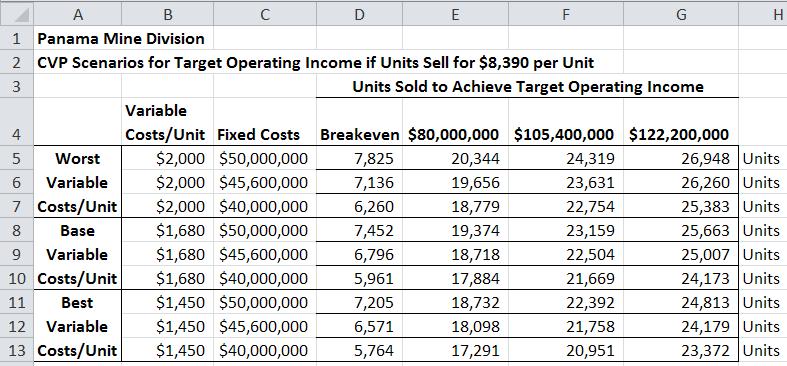
21 Scenario Analysis 21
22 Cautions The examples in the FP&A Learning System assume a single product line, but a multi-product line (i.e., a sales mix) is more likely in practice I don t think that you ll see a sales mix It is difficult to analyze the effect of multiple changes that occur at the same time Fixed costs increase as contribution margin increases, etc. 22