The Stabilities of phase
|
|
|
- Morgan Neal McBride
- 5 years ago
- Views:
Transcription


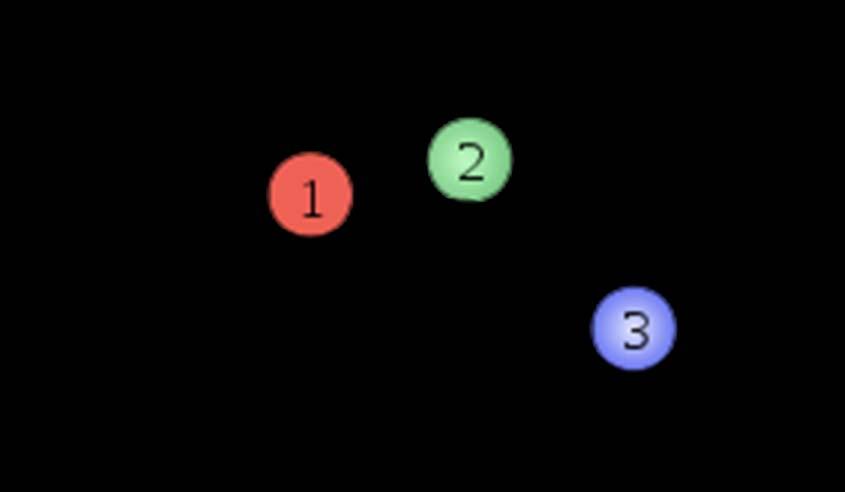
1 The Stabilities of phase What is a phase? A phase is a form of matter that is uniform throughout in chemical composition and physical state Example Fig 1. White phosphorus Fig 2.Black phosphorus Fig 3. Liquid phase

2 A phase transition is the spontaneous conversion of one phase into another phase,occurs at a characteristic temperature for a given presure Example Below 0 0 C At 1 atm Above 0 0 C Ice Fig 4. The example of phase transition Liquid water


3 The transition temperature,t trs, is the temperature at which the two phase are in equilibrium and the Gibbs energy is minimized at the prevailing presure Example Fig 5. The transition temperature of water

4 A metastable phase is a thermodynamically unstable phase that persists because the transition is kinetically hindered Example Diamond Graphite Fig 6. Metastable phase of carbon

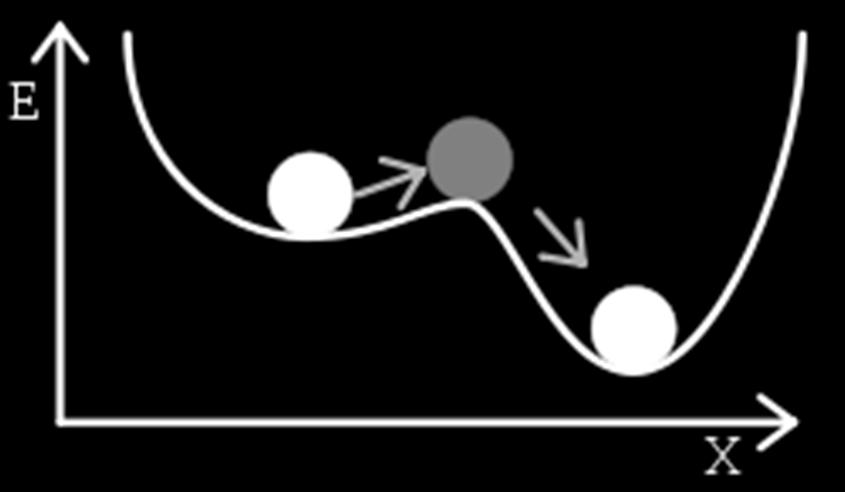
5 Fig 7. A metastable systems diagram

6 Phase boundaries A phase diagram is a diagram show the regions of pressure and temperature at which its various phase are thermodynamically stable Fig 8. A typical phase diagrams


7 Fig 10. The boiling process Heat The temperature at which the vapour pressure of a liquid is equal to the external pressure is called the boiling temperature


8 Fig 9. The experiment about vapour pressure

9 Heat Heat Fig 11. The experiment about critical temperature The temperature at which the surface disappear is the critical temperature


10 Melting Freezing The melting temperature (or freezing temperature) is the temperature at which, under the specified pressure, the liquid and solid phases of a substance coexist in equilibrium


11 Phase Diagrams ISSUES TO ADDRESS... When we combine two elements... what equilibrium state do we get? In particular, if we specify... a composition (e.g., wt% Cu wt% Ni), and a temperature (T) then... How many phases do we get? What is the composition of each phase? How much of each phase do we get? Phase A Phase B Nickel atom Copper atom
12 Phase Equilibria: Solubility Limit Introduction Solutions solid solutions, single phase Mixtures more than one phase Solubility Limit: Max concentration for which only a single phase solution occurs. Question: What is the solubility limit at 20 C? Answer: 65 wt% sugar. If Co < 65 wt% sugar: syrup If Co > 65 wt% sugar: syrup + sugar. Temperature ( C) Pure Water Sucrose/Water Phase Diagram L (liquid solution i.e., syrup) Solubility Limit C o =Composition (wt% sugar) L (liquid) + S (solid sugar) Pure Sugar

.")
13 Components and Phases Components: The elements or compounds which are present in the mixture (e.g., Al and Cu) Phases: The physically and chemically distinct material regions that result (e.g., and β). Aluminum Copper Alloy β (lighter phase) (darker phase)
14 Effect of T & Composition (C o ) Changing Tcan change # of phases: path A to B. Changing Co can change # of phases: path B to D. 100 B (100 C,70) 1 phase D (100 C,90) 2 phases watersugar system Temperature ( C) L (liquid solution i.e., syrup) L (liquid) + S (solid sugar) A(20 C,70) 2 phases C o =Composition (wt% sugar)
15 Phase Equilibria Simple solution system (e.g., Ni Cu solution) Crystal Structure electro negativity r (nm) Ni FCC Cu FCC Both have the same crystal structure (FCC) and have similar electronegativities and atomic radii (W. Hume Rothery rules) suggesting high mutual solubility. Ni and Cu are totally miscible in all proportions.
16 Phase Diagrams Indicate phases as function of T, Co, and P. For this course: binary systems: just 2 components. independent variables: Tand C o (P = 1 atm is almost always used). Phase Diagram for Cu Ni system T( C) L (liquid) (FCC solid solution) phases: L (liquid) (FCC solid solution) 3 phase fields: L L+ wt% Ni
17 Phase Diagrams: # and types of phases Rule 1: If we know Tand C o, then we know: the # and types of phases present. Examples: A(1100 C, 60): 1 phase: B (1250 C, 35): 2 phases: L+ T( C) L (liquid) B (1250 C,35) (FCC solid solution) Cu Ni phase diagram 1100 A(1100 C,60) wt% Ni
18 Phase Diagrams: composition of phases Rule 2: If we know Tand C o, then we know: the composition of each phase. Examples: C o = 35 wt% Ni At T A = 1320 C: Only Liquid (L) C L = C o ( = 35 wt% Ni) At T D = 1190 C: Only Solid ( ) C = C o ( = 35 wt% Ni ) At T B = 1250 C: Both and L C L = C liquidus C = C solidus ( = 32 wt% Ni here) ( = 43 wt% Ni here) T( C) T A T B T D 20 L (liquid) A B D C L C o Cu Ni system tie line (solid) 4 3 C wt% Ni
19 Phase Diagrams: weight fractions of phases Rule 3: If we know Tand C o, then we know: the amount of each phase (given in wt%). Examples: C o = 35 wt% Ni At T A: Only Liquid (L) W L = 100 wt%, W = 0 At T D : Only Solid ( ) At T B : W L = W = W L = 0, W = 100 wt% Both and L S R + S R R + S = = 27 wt% = 73 wt% T( C) T A 1300 T B 1200 T D 20 L (liquid) R A C L C o Cu Ni system B S D tie line (solid) 43 C wt% Ni
20 T( C) The Lever Rule Tie line connects the phases in equilibrium with each other essentially an isotherm 1300 T B 1200 L (liquid) R B tie line S (solid) How much of each phase? Think of it as a lever M L R S M 20 30C C L o C wt% Ni M S = M L R W L = M L ML + M = S R + S = C C C C 0 L W = R R + S = C C 0 C C L L

21 Fe Fe 3 C System 21