From sand to silicon wafer
|
|
|
- Bertha Lucy Smith
- 5 years ago
- Views:
Transcription


1 From sand to silicon wafer 25% of Earth surface is silicon Metallurgical grade silicon (MGS) Electronic grade silicon (EGS) Polycrystalline silicon (polysilicon)

2 Single crystal Czochralski drawing

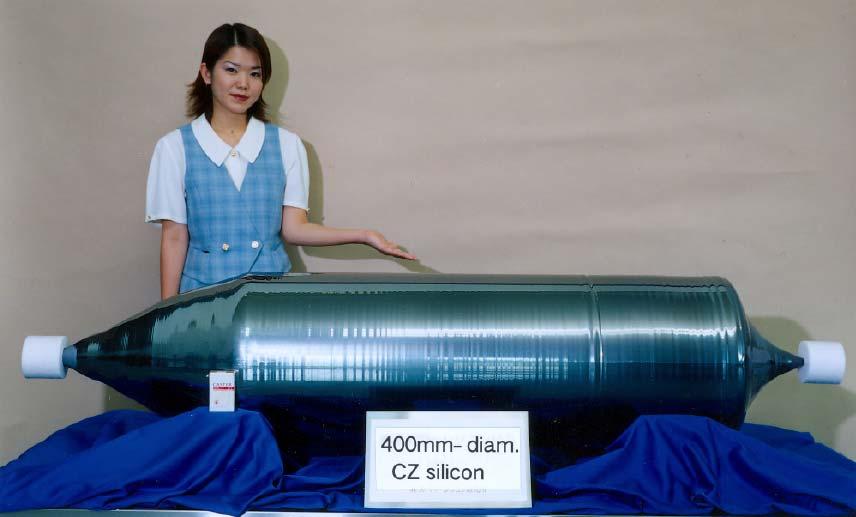
3 Single crystal Czochralski growth

4 Preparation of silicon wafers
5 Generation of vacancy in a perfect crystal (a) Perfect crystal without vacancies (c) An atom in the bulk diffuses to fill the vacancy thereby displacing the vacancy towards the bulk. (b) An energetic atom at the surface breaks bonds and jumps on to a new adjoining position on the surface. This leaves behind a vacancy. (d) Atomic diffusions cause the vacancy to diffuse into the bulk. Fig. 1.43: Generation of a vacancy by the diffusion of an atom to the surface and the subsequent diffusion of the vacancy into the bulk. Equilibrium concentration of vacancies n v = N exp E v kt n v = vacancy concentration, N = number of atoms per unit volume, E v = vacancy formation energy, k = Boltzmann constant, T = absolute temperature (T,K = t, 0 C ) In Si E v =3.6 ev / vacancy
6 Point defects in the crystal structure (a) A vacancy in the crystal. (b) A substitutional impurity in the crystal. The impurity atom is larger than the host atom. (c) A substitutional impurity in the crystal. The impurity atom is smaller than the host atom. (d) An interstitial impurity in the crystal. It occupies an empty space between host atoms. Fig. 1.44: Point defects in the crystal structure. The regions around the point defect become distorted; the lattice becomes strained.
7 Point defects in the ionic crystals Schottky defect Frenkel defect (a) Schottky and Frenkel defects in an ionic crystal. Substitutional impurity. Doubly charged (b) Two possible imperfections caused by ionized substitutional impurity atoms in an ionic crystal. Fig. 1.45: Point defects in ionic crystals
8 Edge dislocation Edge dislocation line (a) Dislocation is a line defect. The dislocation shown runs into the paper. In Si E D =100 ev / nm of dislocation Compression Tension Compare with E v =3.6 ev / vacancy!!! (b) Around the dislocation there is a strain field as the atomic bonds have been compressed above and stretched below the islocation line Fig. 1.46: Dislocation in a crystal is a line defect which is accompanied by lattice distortion and hence a lattice strain around it.
9 Screw dislocation A D C Dislocation line (a) A screw dislocation in a crystal. Dislocation line A B Atoms in the lower portion. Atoms in the upper portion. D (b) The screw dislocation in (a) as viewed from above. C Fig. 1.47: A screw dislocation involves shearing one portion of a perfect crystal with respect to another portion on one side of a line (AB).

10 Photographs of real dislocations
11 Mixed dislocation Dislocation line Fig. 1.48: A mixed dislocation.

12 Growth of screw dislocation with the growth of crystal In Si E D =100 ev / nm of dislocation Compare with E v =3.6 ev / vacancy!!!
13 Surface of the hypothetical 2-D crystal H 2 O Surface Dangling bond Reconstructed surface Absorbed Oxygen O H H 2 Surface atoms Bulk crystal Fig. 1.52: At the surface of a hypothetical two dimensional crystal, the atoms cannot fulfill their bonding requirements and therefore have broken, or dangling, bonds. Some of the surface atoms bond with each other; the surface becomes reconstructed. The surface can have physisorbed and chemisorbed atoms.

14 Reconstruction of the surface H 2 O Surface Dangling bond Reconstructed surface Absorbed Oxygen O H H 2 Surface atoms Bulk crystal Fig. 1.52: At the surface of a hypothetical two dimensional crystal, the atoms cannot fulfill their bonding requirements and therefore have broken, or dangling, bonds. Some of the surface atoms bond with each other; the surface becomes reconstructed. The surface can have physisorbed and chemisorbed atoms.
15 Model of the surface
 Fig. 1.")
 Nucleation. (b) Growth. (c) The solidified polycrystalline solid.")
16 Nuclei Growth of polycrystalline solid Crystallite A Liquid (a) (b) Grain Grain boundary B (c) Fig. 1.50: Solidification of a polycrystalline solid from the melt. (a) Nucleation. (b) Growth. (c) The solidified polycrystalline solid. For simplicity, cubes represent atoms. A B
17 Model of the grain boundaries Foreign impurity Self-interstitial type atom Void, vacancy Strained bond Grain boundary Broken bond (dangling bond) Fig. 1.51: The grain boundaries have broken bonds, voids, vacancies, strained bonds and "interstitial" type atoms. The structure of the grain boundary is disordered and the atoms in the grain boundaries have higher energies than those within the grains.
18 Non-stoichiometry (a) Stoichiometric ZnO crystal with equal number of anions and cations and no free electrons. O 2 Zn 2+ "Free" (or mobile) electron within the crystal. (b) Non-Stoichiometric ZnO crystal with excess Zn in interstitial sites as Zn 2+ cations. Fig. 1.54: Stoichiometry and nonstoichiometry and the resulting defect structure.
19 Crystalline vs. amorphous structure Silicon (or Arsenic) atom Oxygen (or Selenium) atom Continuous Random Network (SiO 2 ) 0.8 (Na 2 O) 0.2 (a) A crystalline solid reminiscent to crystalline SiO 2.(Density = 2.6 g cm -3 ) (b) An amorphous solid reminiscent to vitreous silica (SiO 2 ) cooled from the melt (Density = 2.2 g cm -3 ) Fig. 1.56: Crystalline and amorphous structures illustrated schematically in two dimensions. SiO 2, GeO 2 As 2 S 3 Ge-Ga-Se (S) : Er

20 Quenching of amorphous metals Cu 66 Zr 33 Fe 80 B 20 Pd 80 Si 20
21 Crystalline (c-si), amorphous (a-si) and hydrogenated (a-si:h) silicon Dangling bond (a) Two dimensional schematic representation of a silicon crystal (b) Two dimensional schematic representation of the structure of amorphous silicon. The structure has voids and dangling bonds and there is no long range order. H H H H H (c) Two dimensional schematic representation of the structure of hydrogenated amorphous silicon. The number of hydrogen atoms shown is exaggerated. H Fig. 1.58: Silicon can be grown as a semiconductor crystal or as an amorphous semiconductor film. Each line represents an electron in a bond. A full covalent bond has two lines and a broken bond has one line.
22 Amorphous silicon (a-si) and amorphous hydrogenated silicon (a-si:h) Heated substrate Deposition chamber VACUUM Silicon for deposition a-si film Evaporated Si atoms Crucible Electron beam guided by a magnetic field Electron gun Silane gas (SiH 4 ) Vacuum Electrode Plasma Electrode Heated substrate a-si:h film CVD Chamber VACUUM PUMP Fig. 1.59: Amorphous silicon, a-si, can be prepared by an electron beam evaporation of silicon. Silicon has a high melting temperature so that an energetic electron beam is used to melt the crystal in the crucible locally and thereby vaporize Si atoms. Si atoms condense on a substrate placed above the crucible to form a film of a-si. Vacuum Pump RF Power Generator Fig. 1.60: Hydrogenated amorphous silicon, a-si:h, is generally prepared by the decomposition of silane molecules in a radio frequency (RF) plasma discharge. Si and H atoms condense on a substrate to form a film of a-si:h.
23 Allotropy Covalently bonded layer Cubic crystal Covalently bonded network of atoms Layers bonded by van der Waals bonding Covalently bonded layer Hexagonal unit cell (a) Diamond unit cell (b) Graphite Polymorphism or allotropy = the ability to create more than one crystal structure The FCC unit cell of the Buckminsterfullerene crystal. Each lattice point has a C 60 molecule Buckminsterfullerene (C 60 ) molecule (the "buckyball" molecule) (c) Buckminsterfullerene Fig. 1.42: The three allotropes of carbon.
24 Solid solutions alloys (a) Disordered Substitutional Solid Solution. Example: Cu-Ni alloys ({100} planes) (b) Ordered Substitutional Solid Solution. Example: Cu- Zn alloy of composition 50%Cu-50%Zn. ({110} planes). (c) Interstitial Solid Solution. Example: Small number of C atoms in FCC Fe (austenite). ({100} planes) majority atoms = solvent minority atoms = solute Fig. 1.61: Solid solutions can be disordered substitutional, ordered substitutional and interstitial substitutional. There is only one phase within the alloy which has the same composition, structure and properties everywhere.
25 Solidification of pure Cu L 0 S 0 heat of fusion
26 Solidification of pure Cu and Ni Pure Ni L 100 S C 100
27 Solidification of 80% Cu + 20% Ni Pure Ni L 100 S C C L 20 L C S 20 S 0
28 1500 Pure Cu 80%Cu-20%Ni Liquid TEMPERATURE ( C) C 1195 C L 0 S 0 L C S 20 Liquid Solid Formation of first solid Heterogeneous mixture of liquid and solid. Solid Crystal grains (a) Time TEMPERATURE ( C) L 20 LIQUID LIQUIDUS LIQUID + SOLID SOLIDUS L 100 S S L 20 SOLID 0 S Ni Content (wt.%) Pure Cu Pure Ni (b) Fig. 1.62: Solidification of an isomorphous alloy such as Cu-Ni. (a) Typical cooling curves. (b) The phase diagram marking the regions of existence for the phases.
29 What is the composition of solid phase? L(20%Ni) S(36%Ni) L(20%Ni) S(28%Ni) L(13%Ni) Liquid L 3 L 2 LIQUID L 0 L 1 X S 3 S 2 LIQUIDUS S 1 SOLIDUS SOLID (α-phase) TEMPERATURE ( C) S(20%Ni) S Pure Cu C 0 wt.% Ni Fig. 1.63: Cooling of a 80%Cu-20%Ni alloy from the melt to the solid state.
30 X
31 Lever Rules C L C S W L = weight fraction of liquid W s = weight fraction of solid W L + W S = 1 (1) C 0 = total concentration of Ni C L = concentration of Ni in liquid C S = concentration of Ni in solid C L W L + C S W S = C 0 (2) T X W L = C S C O C S C L C L C S and W S = C O C L C S C L
32 Lever Rules W L = C S C O C S C L and W S = C O C L C S C L W L = the weight fraction of the liquid phase, W S = the weight fraction of the solid phase, C S = composition of the solid phase, C L = composition of the liquid phase, C O = overall composition.
33 What is the influence of fast cooling? Last solidification (S 3 ) Ni defficient First solidification (S 1 ) Ni rich Grain boundary L(20%Ni) S(36%Ni) L(20%Ni) S(28%Ni) L(13%Ni) Liquid L 3 L 2 LIQUID L 0 L 1 X S 3 S 2 LIQUIDUS S 1 SOLIDUS SOLID (α-phase) TEMPERATURE ( C) Fig. 1.64: Segregation in a grain due to rapid cooling (nonequilibrium cooling) S(20%Ni) S Pure Cu C 0 wt.% Ni Fig. 1.63: Cooling of a 80%Cu-20%Ni alloy from the melt to the solid state.
34
35 Melt Purified region B HEAT A Direction of travel C 0 Impure Solid Impurity concentration C 0 C B' C B Zone refined region x (a) Heat is applied locally starting at one end. The impurity concentration in the refrozen solid at B is C B < C 0. The impurity concentration in the melt is C L' > C 0. A' B' C 0 Impure Solid (b) As the torch travels towards the right, the refrozen solid at B' has C B' where C B < C B' < C 0. The impurity concentration in the melt is now even greater than C L' (c) The impurity concentration profile in the refrozen solid after one pass. Impurity concentration C 0 C Zone refined region (d) Typical impurity concentration profile after many passes. x Fig. 1.66: The principle of zone refining

36 Zone refining principles Temperature LIQUID 1412 C C L T B T B' B B' C L' L + S LIQUIDUS SOLIDUS SOLID C B C B' C 0 Impurity content Fig. 1.65: The phase diagram of Si with impurities near the low concentration region.
37 Isomorphous alloys X
38 Solvus TEMPERATURE Brine Brine Brine + Salt Brine Salt X 1 X s X 3 Wt.% Salt Fig. 1.67: We can only dissolve so much salt in brine (solution of salt in water). Eventually we reach the solubility limit at Xs which depends on the temperature. If we add more salt then the excess salt does not dissolve and coexists with the brine. Past Xs we have two phases, brine (solution) and salt (solid).
39 Non-isomorphous alloys 400 L α L α α β Temperature (oc) A α SOLVUS L M LIQUID N O P Q SOLIDUS LIQUIDUS α + L L+β C SOLIDUS E SOLIDUS D 19.2% 183 C 61.9% 97.5% SOLID 100 α + β LIQUIDUS Q' SOLVUS B SOLIDUS β R' R R'' 0 0 Pure Pb Composition in wt.% Sn 100 Pure Sn Fig. 1.68: The equilibrium phase diagram of the Pb-Sn alloy. The microstructures on the left show the observations at various points during the cooling of a 90%Pb-10%Sn from the melt along the dashed line (the overall alloy composition remains constant at 10 %Sn)
40 L α L Eutectic L (61.9%Sn) α (19%Sn) Primary α Eutectic T 235 C 183 C L M Temperature ( o C) 400 A Pb Cooling of a 60%Pb- 40%Sn alloy L+α N L+β+α O P β+α Q α SOLIDUS t C SOLVUS LIQUIDUS α+l L LIQUID M N O E 183 C P Q α + β L+β D 61.9% Composition in wt.% Sn L F G T 183 C LIQUIDUS L Cooling of 38.1%Pb- 61.9%Sn alloy E SOLVUS F Sn B SOLIDUS β L + Eutectic solid (β+α) Eutectic solid (β+α) G t L (61.9%Sn) L (61.9%Sn) Eutectic Eutectic α (light) and β (dark) Fig. 1.69: The alloy with the eutectic composition cools like a pure element exhibiting a single solidification temperature at 183 C. The solid has the special eutectic structure. The alloy with the composition 60%Pb-40%Sn when solidified is a mixture of primary α and eutectic solid.
41 Eutectic Transformation L 61.9% Sn α 19.2% Sn + β 97.5% Sn L = liquid phase α = Pb-rich solid phase of PbSn β = Sn-rich solid phase of PbSn