Nd:YAG Laser Welding of ZE41A-T5 Magnesium Sand Casting Alloy
|
|
|
- Rebecca Higgins
- 5 years ago
- Views:
Transcription
1 Nd:YAG Laser Welding of ZE41A-T5 Magnesium Sand Casting Alloy Haider Al-Kazzaz A Thesis In The Department of Mechanical and Industrial Engineering Presented in Partial Fulfillment of the Requirements for the Degree of Master of Applied Science (Mechanical Engineering) at Concordia University Montreal, Quebec, Canada April 2006 Haider Al-Kazzaz, 2006
2 ABSTRACT Nd:YAG Laser Welding of ZE41A-T5 Magnesium Sand Casting alloy Haider Al-Kazzaz Butt joints of ZE41A-T5 plates with two thicknesses (2 and 6 mm) were laser welded using 1.6 mm EZ33A-T5 filler wire and a continuous wave Nd:YAG system with variable laser process parameters; power (2.5 4 kw), welding speed (2 7 m/min), joint gap (0 0.6 mm) and defocusing distance (0 to -4 mm). Acceptable weld geometries with smooth top and bottom profiles and minor defects were produced with the open keyhole mode. The optimum laser power was 4 kw for both thicknesses, and the welding speed was 6 and 2 m/min for thin and thick plates, respectively. The suitable gap size for the 2 mm and 6 mm plates was found to be between 0.3 and 0.4 mm. The increase in welding speed reduced the FZ defects on a condition of having an open keyhole mode. The fusion zone showed significant grain refinement due to high cooling rate. No grain coarsening was observed in the HAZ. The microhardness test showed that fusion zone hardness was recovered to the value of the base metal after natural aging of around one year. The HAZ with a typical width between 1.5 and 2 mm, showed a drop in hardness compared with the BM. Tensile test showed that the optimum parameters had a joint efficiency between 85 and 95 %. Moderate and high Weibull moduli were obtained for the mechanical properties and weld geometry indicating that the laser welding process seems to have good repeatability. Simulation of laser welding process was developed through combining different models and concepts that enabled to describe the keyhole and weld profile. This model shows good agreement with the experimental results. iii
3 ACKNOWLEDGEMENTS I would like to dedicate this work to my beloved wife Arwa and to my family; I would like to thank them for their support and encouragement. Thank you my soul mate Arwa for sping a good time reviewing my presentations and posters, and many thanks for you and my great father for encouraging me to continue my study. I would like to thank my fri Mr. Faris Jasim for informing me about the availability of this opportunity at Concordia University. I am indebted to my supervisor Dr. M. Medraj for his advices; the excellent and useful supervision through the individual and group meetings and for supporting me during my study. His ideas and suggestions were very helpful to me, and it improved my experience and skills. I would like to thank Drs. X. Cao, M. Jahazi and M. Xiao of AMTC-NRC for their advices and the useful information. Their experiences were really a good help to me in order to complete this work. Finally, I would like to thank my group members for their suggestions and support during the whole period of my project. iv
4 TABLE OF CONTENTS LIST OF FIGURES...VII LIST OF TABLES...XII NOMENCLATURE... XIII CHAPTER INTRODUCTION OBJECTIVE... 4 CHAPTER 2 / LITERATURE SURVEY LASER WELDING MODES KEYHOLE STABILITY LASER TYPES EFFECTIVE PARAMETERS IN LASER WELDING PROCESS Laser Power and Welding Speed Focusing Parameters Shield Gas Parameters WELDABILITY OF MAGNESIUM ALLOYS Microstructure Fusion Zone (FZ) Heat Affected Zone (HAZ) Porosity Formation Cracks formation Mechanical properties Oxide Inclusion Weld Geometry LASER WELDING WITH FILLER WIRE Continuous wire feed system Filler Wire and Gap Size Wire Feed Delivery Angle Feeding Direction Filler Wire Position Laser Welding With Filler Wire for Mg Alloys...30 CHAPTER 3 / EXPERIMENTAL PROCEDURE MATERIAL AND EQUIPMENTS KEY EXPERIMENTS...33 CHAPTER 4 / RESULTS AND DISCUSSIONS EFFECT OF WELDING SPEED ON THE WELDABILITY OF 2 MM PLATES Weld Geometry Microstructure Porosity Crack Formation Micro-Indentation Hardness Tensile Strength EFFECT OF JOINT GAP ON THE WELDABILITY OF 2 MM PLATES Weld Geometry Microstructure Porosity Crack Micro-Indentation Hardness EFFECT OF LASER POWER ON WELDABILITY OF 2 MM PLATES...60 v
5 4.3.1 Weld Geometry Microstructure Porosity Crack Formation Micro-Indentation Hardness REPEATABILITY OF LASER WELDING PROCESS Weld Geometry Microstructure Defects Mechanical Properties Summary of Repeatability LASER WELDING OF THICK PLATES (6 MM THICKNESS) Weld Geometry Porosity Cracks Mechanical Properties CALCULATION OF LASER EFFICIENCIES FROM THE EXPERIMENTAL FZ GEOMETRY Method Results MODELING OF KEYHOLE LASER WELDING Energy Balance at the Keyhole Wall for First Fresnel Absorption Heat Flow Equation at the Keyhole Wall Intensity Distribution for the Laser Beam Fresnel Absorption Coefficient Plasma Absorption Multiple Reflection of the Laser Ray Method of Calculation Comparison between the Model and the Experimental Results CHAPTER SUMMARY AND CONCLUDING REMARKS Laser Welding of 2 mm Thin Plates Reliability of Laser Welding Process Effect of Casting Quality on Weldability Laser Welding of 6 mm Plates Coupling and Melting Efficiencies Simulation of Laser Welding Process CONTRIBUTIONS TO KNOWLEDGE RECOMMENDATIONS FOR FUTURE WORK REFERENCES: APPENDIX A.1 SUMMARY OF LITERATURE SURVEY A.2 WEIBULL DISTRIBUTION A.3 SOLIDIFICATION CRACKS FOR 6 MM LASER WELDED PLATES A.4: PHYSICAL PROPERTIES FOR PURE MG, ZE41A AND PURE AL A.5: SIMULATION OF LASER WELDING PROCESS USING MATLAB PROGRAMMING vi
6 LIST OF FIGURES Literature Survey Figure 2.1 Effect of laser type on penetration depth 9 Figure 2.2 Effects of laser power and welding speed on the weld geometry 11 Figure 2.3 Effects of laser power and welding speed on porosity 12 Figure 2.4 Focusing parameters 13 Figure 2.5 Schematic diagram showing the effect of physical properties on weld geometry 27 Results and Discussion Effect of Welding Speed on Weldability Figure Effect of Welding Speed on Weld Geometry. 36 Figure Effect of Welding Speed on (a) joint size and (b) weld area 36 Figure Micrograph Showing the FZ, PMZ and HAZ. 37 Figure Effect of Welding Speed on FZ Grain Morphology 38 Figure Effect of Welding Speed on Porosity. 39 Figure Porosity Distribution 39 Figure Figure Figure Figure Figure Effect of Welding Speed on Crack Length and Number of Solidification Cracks in the FZ. Solidification Cracks in the FZ initiated by Various Sources Observed in Laser Welding of ZE41A-T5 Mg alloy. HAZ Liquation Cracks Observed in Laser Welding of ZE41A-T5 Mg alloy. Vickers Microindentation Hardness for Welding Speed at (a) 4, (b) 5, (c) 6, and (d) 7 m/min. Joint Efficiency of Laser Welded ZE41A-T5 Mg Alloy Using Filler Wire Effect of Gap Size on Weldability Figure Effect of Gap Size on Weld Geometry 47 Figure Effect of Gap Size on (a) joint size and (b) weld area. 48 Figure Micrograph Showing the FZ, PMZ and HAZ 49 Figure Effect of gap size on the FZ microstructure 50 vii
7 Figure Effect of gap size on Porosity. 51 Figure Porosity distribution. 51 Figure Large porosity near the PMZ for the sample welded at 0.2 mm gap 52 Figure Figure Figure Effect of Gap Size on Crack Length and Number of Solidification Cracks in the FZ Solidification Cracks in The Sample Welded at 0.1 mm gap Middle Section Solidification Cracks in The Sample Welded at 0.2 mm gap Middle Section Figure Solidification Cracks in the Sample Welded at 0.3 mm gap End Section 55 Figure Solidification Cracks in the Sample Welded at 0.4 mm gap End Section 55 Figure Solidification Cracks in the Sample Welded at 0.5 mm gap Start Section Figure Solidification Cracks in the Sample Welded at 0.6 mm gap End Section 57 Figure Effect of Gap size on Hardness Profile Effect of Laser Power on Weldability Figure Effect of Laser power on (a) joint size and (b) weld area. 61 Figure Effect of Laser Power on Weld Geometry 62 Figure Micrographs Showing the FZ, PMZ and HAZ. 64 Figure Effect of laser power on the FZ microstructure 65 Figure Effect of power on Porosity. 66 Figure Figure Porosity Distribution 66 Figure Figure Effect of Laser Power on Crack Length and Number of Solidification Cracks in the FZ. Solidification Cracks in The Sample Welded at 2.75 kw Ending Section Figure Solidification Cracks in the Sample Welded at 3 kw Middle Section 70 Figure Solidification Cracks in the Sample Welded at 3.5 kw Start Section 71 Figure Solidification Cracks in the Sample Welded at 3.75 kw Start Section / Part -1 Figure Solidification Cracks in the Sample Welded at 3.75 kw Start Section / Part -2 Figure Solidification Cracks in the Sample Welded at 4 kw Ending Section 73 Figure Effect of Laser Power on Hardness Profile 75 Figure Effect of Laser power on the Average Hardness Measured in the Center Line of the FZ viii
8 Repeatability of Laser Welding Process Figure Repeatability of Laser Welding Process for 2 mm Plate 78 Figure Repeatability of FZ Weld Geometry (a) Distribution of Weld Bead Width (b) Distribution of Total FZ Area Figure Cumulative Plot of (a) Weld Bead Width (b) Total FZ Area 80 Figure Weibull Plots Obtained From (a) Weld Bead Width (b)total FZ Area 80 Figure FZ Microstructure for the Repeated Samples 82 Figure Micrographs Showing the PMZ for the Repeated Laser Welded Samples 83 Figure Figure Figure Figure Figure Figure Figure Figure Figure Defects Distribution for the Repeated Laser Welded Samples a) Porosity Area Percentage b) Solidification Cracks Length Cumulative Plot of (a) Porosity Area Percentage (b) FZ Solidification Crack Length Weibull Plots Obtained From (a) Porosity Area Percentage (b) FZ Solidification Crack Length Microindentation Hardness Test for the Repeated Welded Samples (As Welded Condition) Microindentation Hardness Test for the Repeated Welded Samples (Heat Treated Condition) Weibull Statistical Analysis for the Average Vickers Hardness Measured in the Center Line of the FZ in the as Welded and Heat Treated Conditions a) Cumulative Plots of Vickers Hardness b) Weibull Plots of Vickers Hardness Tensile Strength Distribution for a) as Welded Condition b) Heat Treated Condition Weibull Statistical Analysis for Tensile Strength a) Cumulative Plots of Tensile Strength b) Weibull Plots of Tensile Strength Weibull Statistical Analysis for Elongation a) Cumulative Plots of Elongation b) Weibull Plots of Elongation Figure Mechanical Tensile Properties / Stress Strain Curve for sample # 19 a) as Welded Condition b) Heat Treated Condition Laser Welding of 6 mm thick Plate Figure Laser Welding of 6 mm Thick Plate 95 Figure Effect of Defocusing on Weld Geometry a) Joint size b) FZ Area. The Defocusing for the Samples 25, 26 and 27 were 0 mm, -2 mm and -4 mm, respectively 96 ix
9 Figure (A) Figure (B) Top and Bottom Surface Morphology for 6 mm Laser Welded 97 Top and Bottom Surface Morphology for 6 mm Laser Welded 98 Figure Microstructure for Sample # Figure Microstructure for Sample # Figure Microstructure for Sample # Figure Microstructure for Sample # Figure Microstructure for Sample # Figure Microstructure for Sample # Figure Porosity Formation during Laser Welding of 6 mm Plates a) Porosity Area Percentage b) Pores Distribution Figure Pore with a diameter 50 µm formed near the PMZ for sample# Figure Solidification Crack length for the 6 mm 113 Figure Solidification and Liquation Cracks for Sample # Figure Solidification Cracks for Sample # Figure Solidification Cracks for Sample # 29. Figure Solidification and Liquation Cracks for Sample # 30 Figure Solidification Cracks for Sample # 31 Figure Solidification Cracks for Sample # 33 Figure Microhardness Profile for the Full Penetrated 6 mm Laser Welded Plated in a) as Welded Condition b) Heat Treated Figure Joint Efficiency of the full Penetrated 6 mm laser Welded Plates 119 Figure Weibull Statistical Analysis for Tensile Strength for Samples 29, 31 and 33 a) Cumulative Plots of Tensile Strength b) Weibull Plots of Tensile Strength Figure Calculating Laser Efficiencies from the Experimental FZ Geometry Schematic Diagram Showing the Power Balancing during the Keyhole Laser Welding Figure Polar coordinate for the Keyhole and the Moving Line Source 123 Figure Effect of Welding Speed on Coupling, Thermal and Process Efficiencies 126 Figure Simulation Showing the Effect of Welding Speed on the Keyhole Shape x
10 and the Multiple Reflections Figure Effect of gap size on Coupling, Thermal and Process Efficiencies 127 Figure Effect of Laser Power on Coupling, Thermal and Process Efficiencies 128 Figure Simulation Showing the Effect of Laser Power on Keyhole Shape and the Multiple Reflection Figure Effect of Defocusing on Coupling, Thermal and Process Efficiencies 129 Figure Effect of Penetration Depth and Welding Type on the Coupling, thermal and Process Efficiencies Modeling of Keyhole Laser Welding Figure The coordinate system for the Keyhole Layers 132 Figure Energy Balance for First Fresnel Absorption. 132 Figure Intensity Distribution for the Laser Beam [43] 133 Figure Calculated Absorptivity of Al to Nd:YAG Laser Beam at Different Incident Angles at Room Temperature. Figure Geometrical Analysis for Multiple Reflections inside the Keyhole 137 Figure Model Flow Chart for Keyhole Laser Welding 139 Figure Figure Figure Figure Figure Comparison between the Experimental results and the Model for Laser Welding of 6 mm Plates Comparison between the Experimental results and the Model for Laser Welding of 2 mm Plates Weld Geometry Comparison between the Experimental and the Model for 6 mm Laser Welded Plates Weld Geometry Comparison between the Experimental and the Model (Effect of Laser Power on Laser Welding of 2 mm Plates) Weld Geometry Comparison between the Experimental and the Model (Effect of Laser Power on Laser Welding of 2 mm Plates) xi
11 LIST OF TABLES Literature Survey Table 2.1 Effect of f - number on focusing characteristics [19]. 15 Table 2.2 Optimization of shield gas parameters 18 Results and Discussion Effect of Welding Speed on Weldability Table Key experiments / effect of welding speed on the weldability 35 Table Tensile Strength Property for the 2-mm Plates Laser Welded at Variable Welding Speeds 45 Effect of Gap Size on Weldability Table Key experiments / effect of gap size on the weldability 46 Table Effect of Gap Size on the Average Hardness Measured in the Center Line of the FZ 59 Effect of Laser Power on Weldability Table Key experiments / effect of laser power on the weldability 60 Table Effect of Laser Power on the Average Hardness Measured in the Center Line of the FZ 76 Table Table Table Repeatability of Laser Welding Process Average Vickers Hardness in the Center Line of the FZ for the Repeated Welded Samples Tensile properties of the repeated welded samples in the as welded condition Tensile properties of the repeated welded samples in the heat treated condition Table Reliability Assessment for the Repeatability of Laser Welding Process Laser Welding of 6 mm thick Plate Table Parameters Used in the Laser Welding of 6 mm Thick Plates 94 Table Weld Geometry Size for 6 mm Laser Welded Plates 102 Table Average Vickers Hardness in the Center Line of the FZ for the full penetrated 6 mm laser welded plate 116 xii
12 Table Tensile properties of the Full Penetrated 6 mm Laser Welded Plates 119 Table Tensile Properties of ZE41A-T5 BM 119 Calculating Laser Efficiencies from the Experimental FZ Geometry Table Laser Efficiencies for the experimental tested samples 125 NOMENCLATURE BM Base metal HAZ Heat affected zone PMZ Partial melted zone FZ Fusion Zone Porosity% Porosity area percentage T5 Artificial aging heat treatment E Heat input (J/m) f f-number = F/D P Total laser power (W) or (kw) A wire Cross sectional area of filler wire (mm 2 ) V Welding speed (m/sec) or (m/min) A gap Cross sectional area of joint gap (mm 2 ) d Focal spot diameter (mm) Laser = E/d (J/mm 2 ) fluence Wave length (mm) HV Vickers hardness measured with 200 g at 15 sec dwell time F Focal length (mm) m Weibull modulus D Beam diameter on the optic Z r Rayleigh length (mm) (mm) M Laser beam mode TS Tensile strength beam Beam convergence angle El Fracture elongation (radian) L Depth of focus (mm) I s Threshold surface intensity (W/mm 2 ) T v Vaporization temperature (K) A Absorptivity at normal incidence P ref Reflecting power outside the keyhole due to filler wire (kw) Coupling efficiency = P A abs / P th p P plume Absorbed laser power by plasma plume (kw) Thermal efficiency = P melting / P abs Process efficiency = melting MR Melting ration = p efficiency = P melting / P A w Total FZ area (mm 2 ) Density (kg/m 3 ) C p Specific heat J T ( ) mp Solidus temperature (K) kg. K xiii
13 T o Room temperature (K) H Latent heat of fusion (J/kg) f ( r, ) Polar coordinate of the keyhole T ( r, ) Temperature at any location (K) P` Line source strength (W/m) k W Thermal conductivity ( ) m. K P e Peclet number Kd Thermal diffusivity (m 2 /s) K o Modified Bessel function of Pd Penetration depth (mm) second kind and zero order q Heat flow (W/m 2 ) I ab Absorbed intensity at the keyhole wall (W/mm 2 ) Keyhole angle with the vertical direction (radian) K 1 Modified Bessel function of second kind and first order I Intensity at any location r f Beam radius at any plane (mm) (W/mm 2 ) I 00 Maximum peak intensity at the r o Focal radius (mm) focal plane with radius zero (W/mm 2 ) Z o Defocusing distance (mm) Fresnel Fresnel absorption coefficient Parameter used to calculate I plasma L I Fr-MR r k Fresnel Absorbed intensity by the plasma inside the keyhole (W/mm 2 ) Path length of the ray inside the plasma Absorbed intensity during the multiple reflections (W/mm 2 ) Keyhole top radius (mm) Angle between incidence ray and normal to keyhole surface (radian) Bremsstrahlung coefficient (1/m) IB I Fr1 h Absorbed intensity by first Fresnel absorption(w/mm 2 ) Angle between the reflected ray with the horizontal (radian) xiv
14 Chapter Introduction Magnesium alloys are becoming some of the most important alloys in the 21 st century. They are interesting alloys for automobile and aerospace industries. Having specific characteristics magnesium alloys are competitive with aluminum and steel alloys. The most important characteristics of magnesium alloys can be summarized as follows: having high strength to weight ratio [ 1, 2], low density [ 2, 4], fatigue resistance [ 2], excellent damping capacity (impact resistance and noise reduction) [ 1, 2, 5], high thermal conductivity [ 1], high recycleability [ 1, 5] and dimensional stability [ 2]. The low density of Mg alloys and thus the low total mass of the product results in a low fuel consumption in the automotive and aerospace applications (ex. for automobile industries the vehicle mass is responsible for 60% of fuel consumption, and a 10% reduction in weight can produce a drop in fuel consumption of 5% as a rough estimation [ 4].). For this reason and because of the high specific strength of Mg alloys, they are important alloys for lightweight structure components. The application of magnesium alloys is increasing rapidly: for automotive in addition to the current use of Mg as a gearbox housing and in some vehicle interior parts [ 4], Mg is finding new applications in the automobile industry such as for engine blocks and the car body. For aerospace industries, ZE41A-T5 sand cast Mg alloy has been used in aircraft engine casings, auxiliary gearboxes, and gearbox casings [3]. Most of these applications are as-cast products but extrusion sections are also used; like the vehicle 1
15 interior design. Because of the HCP crystal structure of Mg the mechanical deformation is limited at room temperature but the extrusion sections can be produced easier at higher temperature. This increase in Mg applications highlights the need to develop a proper joining technology [ 6]. Welding is considered one of the important joining technologies implemented in automotive and aerospace industries [ 7]. In general Magnesium alloys are difficult to weld due to the following reasons: Inflammability that produces oxide film during the welding process [ 8, 9]. Porosity formation, that is generated during the welding process and directly affects the mechanical properties of the weld joint [ 8-12]. Crack formation especially when the Mg alloy contains more than 6 wt% Al and 1 wt% Zn elements [ 8-10]. A low viscosity of molten Mg leads to drop-through (sag) of the weld pool and this drop-through becomes significant for large pools with thick sections resulting in the notch effect [ 6, 12]. Further, the low thermal conductivity of Mg alloys (when compared with Al alloys) combined with the low viscosity effect contribute to the formation of a large weld pool with inadmissible root drop-through, especially when the welding parts are subjected to excessive heat input [ 6, 8, 12]. The classical inert gas welding techniques are limited in the case of Mg alloys because they produce large heat affected zones [ 6]. Also, the high heat input involved in these process cause embrittlement due to the grain coarsening in the heat affected zone and the precipitation of brittle phases in both the heat affected zone and fusion zone. 2
16 Moreover, these factors worsen the mechanical properties [ 13] and thus the need for post weld heat treatment becomes essential [ 14]. Welding difficulties of Mg alloys can be reduced by applying low heat input with high power density and by applying shielding gas to protect the metal from being oxidized [ 1]. The most suitable techniques that provide these characteristics are the laser welding and electron beam welding. Nevertheless laser beam welding has the important advantage over the electron beam technique represented in the possibility of being performed under ambient pressure. Therefore a lot of attention is directed towards using laser welding for Mg alloys applications. Focusing on laser welding technology, this process has many advantages over the conventional welding processes. This is because laser welding is a low heat input process [ 14-18], has high energy density [ 14, 15], high welding speed [ 2, 15-17] narrow heat affected zone [ 14, 15, 18], low distortion [ 11, 15, 18], ease of automation [ 14, 15], the penetration is deeper and thus high aspect ratio is obtained [ 14, 15], excellent focusing ability [ 14], well controlled and accurate process [ 16], and laser beam provides line heating source through the thickness (keyhole formation) rather than point heating source in conventional welding processes [ 2]. In addition to the ability to weld with or without filler wire, laser welding is an important tool used in tailor weld blank strategy which is widely used in auto body manufacturing [ 2, 15, 17]. Weldability of Mg alloys is affected by different types of parameters. To reach a full optimization for a certain Mg alloy, requires understanding of the influence of each parameter on the weldability and weld result. These parameters are: laser power, welding 3
17 velocity, focusing parameters and shield gas parameters. Weld defects like porosity formation and cracks formation can be minimized by selecting the proper laser parameters. This can be done by understanding the mechanisms that produce the weld defects and through experimental work. Each alloy interacts differently with the laser welding process because the alloy parameters such as: composition, physical properties, thickness, defects and mechanical properties are different for each alloy. Hence process optimization may result in different parameters for different alloys. Little information is available about utilizing filler wire in laser welding of Mg alloys. 1.2 Objective This project is conducted to investigate the laser weldability of ZE41A-T5 (Mg-4.2Zn- 1.2Ce-0.7Zr) using filler wire EZ33A-T5 (Mg-3Re-2.5Zn-0.6Zr) with the objective to develop a reliable welding process. The weldability of this alloy will be studied through analyzing the effect of laser welding process parameters on the weld geometry, microstructure, defects and mechanical properties. This study will focus on laser welding of 2 and 6 mm butt joint parts. Another important objective is to simulate the laser welding process using MATLAB software that can describe the keyhole and weld geometry profiles also to estimate the laser process, thermal and coupling efficiencies. 4
18 Chapter 2 / Literature Survey Laser welding is in general keyhole fusion welding technique that provides line-heating source through the material thickness [ 2, 19]. Compared with the conventional welding processes, laser welding produces higher penetration depth in a single pass, this is obtained because the heating source through the material thickness is more uniform than the heating distribution in the conventional welding processes, and thus the production rate is higher and the cost of welding is lower [ 19]. The keyhole can be described as a vapor capillary tube surrounded by a molten metal [ 8]. This keyhole occurs if the laser power absorbed by the metal is at least equal to the material specific intensity threshold [ 8, 17], that means the critical intensity limit for keyhole formation must be overcome by the intensity of laser beam. Hence the objective of laser welding process is to create a moving keyhole surrounded by a molten metal by absorption of incident radiation laser beam [ 20]. Because of the relative velocity between the keyhole and the molten metal [ 8], the molten metal is cooled rapidly behind the moving keyhole and gets solidified to create the joint between the welding parts (refer in Appix A.1). The heating power is obtained by focusing the laser beam into a very small spot of the material surface, and that gives very high power density [ 8, 18-20]. The range of power density that creates the keyhole is between 10 3 to 10 5 Watt/ mm 2, and above this range cutting and drilling are achieved [ 19]. 5
19 2.1 Laser Welding Modes Laser welding modes dep on the laser power absorbed by the metal, if the laser power density is less than the threshold value conduction mode is obtained. In the conduction mode the workpiece surface remains unbroken (vapor capillary tube will not form) during the welding process. If the laser density is greater than the threshold value, the keyhole mode is obtained and evaporation takes place during the welding process [ 20]. Zhao et al [ 10, 17] reported that mixed mode could be produced during laser welding, which results in the instability in the keyhole and leads to spiky under bead and might produce porosity. They compared laser welding modes produced during the welding of Al alloys (5182 and 5754) and Mg alloy (AM60B), and found that the mixed mode is responsible for the instability observed in the Al alloys [ 10, 17, 21]. The mixed mode was produced when the laser power density is just above the threshold value. 2.2 Keyhole Stability The focused laser beam heats the workpiece till it creates liquid metal. When the threshold power density is overcome by the laser beam density, small amount of metal is removed by vaporization process to initiate the keyhole which penetrates through the workpiece thickness. The vapor pressure inside the keyhole is preventing the keyhole wall from collapsing [ 19]. The stability of the keyhole deps on the equilibrium balance between the keyhole and the molten metal around it, and this can be described by the following equation: P v + P l = P + P g + P h (2.1) 6
20 Where P v : vaporization pressure, P : surface tension, P h : hydrodynamic pressure, P g : hydrostatic pressure, P l : radiation pressure [ 20]. Because of small amount of (P l, P g, P h ) the equation can be simplified to: Pv = P (2.2) This means the stability of the keyhole deps on the balance between the vapor pressure and the surface tension pressure; this conclusion is also reported in the experimental results of Zhao et al. [ 10, 17] and Punkari et al. [ 21]. The vapor pressure ts to open the keyhole whereas the surface tension pressure ts to close it. The collapse of the keyhole takes place when there is a sudden drop in the vapor pressure causing the molten metal to slump into the keyhole center [ 17]. This can be experienced when laser-welding Al alloys having high Mg contents like 5182 and 5754 alloys. The high vapor pressure produced during the welding is due to Mg [ 17, 21], and because of the high excessive heat input, Mg may be depleted from the surface causing sudden pressure drop in the keyhole [ 17]. Comparing Mg alloys with Al alloys, Mg has lower surface tension and higher vapor pressure which gives more stability to the molten pool. Another advantage for Mg alloys is that there is no risk of collapse of the keyhole, because Mg is the major element and the vapor pressure will be high enough which provides a stable keyhole through the welding process [ 10, 17]. 7
21 2.3 Laser Types There are two laser types used for welding process, CO 2 and Nd:YAG lasers. The CO 2 laser is largely used in industry in which the primary laser medium is carbon dioxide. The laser is produced at (10.6 m) wave - length [ 19]. The advantages of the CO 2 laser are: wide range of power ( kw), high electrical efficiency and low operation cost [ 20]. Nd:YAG is a solid-state laser of Neodymium glass which produces laser with output wave - length equal to (1.06 m) [ 20]. The characteristics of Nd:YAG laser are: average laser power between (0.3 4 kw), enhanced coupling to reflective metals, higher processing efficiency compared to CO 2 laser when the same power is used. The primary advantage of Nd:YAG is that the laser light can be delivered through fiber optic, this ability makes the Nd:YAG laser attractive for industries; because of the high flexibility obtained during welding process which enables automation [ 19, 20]. The weldability of Mg alloys have been investigated using the two laser types with continuous and pulse modes, and the researchers concluded that Nd:YAG laser is more efficient than the CO 2 laser [ 5, 8, 22, 23] as indicated in Figure 2.1. This is obtained because the laser beam delivered by Nd:YAG is highly absorbed by Mg alloy which leads to higher penetration comparing with the CO 2 laser. For instance, Haferkamp et al. [ 8] studied the weldability of Mg wrought alloys using CO 2 and Nd:YAG laser with the same welding speed V=5 m/min and laser power P=1.5 kw. They reported that Nd:YAG produced 2 mm penetration depth whereas CO 2 laser produced 0.7 mm penetration depth. 8
22 Welding Speed (m/min) CO 2 Nd:Yag Penetration Depth (mm) Figure 2.1 : Effect of laser type on penetration depth [ 20]. Also, Z. Sun et al. [ 5] investigated the weldability of Mg wrought alloy AZ31 using Nd:YAG, CO 2 and tungsten inert gas. They found that the finest weld microstructure formed when using Nd:YAG laser. This fine grain size improves the strength of the weld joint. 2.4 Effective Parameters in Laser Welding Process Laser welding is a complex process that is affected by different types of parameters like laser parameters, alloy parameters and process parameters. The weldability of Mg alloy deps on the interaction between these parameters. Good understanding of these parameters will help find the solution for welding difficulties and defects. Some of these parameters are controllable like laser parameters and other are fixed and dep on the alloy characteristics. Optimization of laser welding process can be done by defining a set of experimental conditions that lead to acceptable, reproducible, sound weld results. The 9
23 most important laser parameters are: laser power, welding speed, focusing characteristics, and shield gas characteristics [ 19, 20] Laser Power and Welding Speed Laser power and welding speed determine the total energy per unit length that is applied to the work piece [ 19]. For continuous wave operation: E = P / V (2.3) Where: P : laser power (watt) V : welding velocity (m/s) E : total energy per unit length (J/m) [ 1] Effect of laser power and welding speed on the weld geometry As described in laser welding modes, P and V values can change the welding process from keyhole mode to conduction mode and consequently from full penetration to partial penetration. The penetration, weld width, and weld area increase by increasing the total energy (E) provided by the laser beam, and this can be done by increasing laser power and / or decreasing welding speed [ 1, 14, 20]. Weishet et al. [ 14] examined the affect of laser power and welding speed on the weld geometry (Figure 2.2) for different Mg wrought and cast alloys using CO 2 laser welding. They found that to join thin plates with full penetration the welding speed range of m/min was required at a laser power of 1.5 kw; for thick plates (5 mm 10
24 Width (mm) 2 Weld area (mm ) Penetration Depth (mm) Penetration Depth (mm) thickness) the welding speed should be reduced to m/min and laser power must be increased to 2 kw. V = 3 m/min V = 5 m/min P = 2 Kw P = 1 Kw Power (kw) Velocity (m/min) P = 2 kw P = 2 kw P = Ikw P = Ikw Velocity (m/min) Velocity (m/min) Figure 2.2 : Effects of laser power and welding speed on the weld geometry [ 1, 14, 20] Effect of Laser Power and Welding Speed on the Microstructure, Defects and Mechanical Properties Grain size: during the laser welding process new grains will be created. But because of the high cooling rate during laser welding process, the grain growth is minimized. The grain growth deps on the amount of heat energy supplied to the workpiece. The increase in heat energy either by increasing the laser power or decreasing the welding speed leads to increase in average grain size [ 10, 22]. Porosity: porosity can be reduced by increasing welding speed or by decreasing the laser power as shown in Figure
25 Porosity Voulme % P = 3 Kw P = 1.5 Kw 10 FZ Welding Speed ( mm/min) Figure 2.3 : Effects of laser power and welding speed on porosity [ 17]. Evaporation and alloy elemental losses: high excessive power may lead to reduction in some alloy elements that have low boiling temperature and high vapor pressure. As an Example of that, when laser welding of Mg alloy AZ31D-H24, Mg and Zn are lost during the process compared with Al, which has a lower vapor pressure [ 22]. Reducing the welding speed has a similar effect on the loss and evaporation of alloying elements. Hardness: the hardness in the fusion zone and heat affected zone is affected by the grain size and the solidification of intermetallic phases during the laser welding. High speed welding may lead to an increase in hardness in the fusion zone because small grain size results in higher average hardness [ 10, 22]. Similar effect can be obtained through reducing the laser power. Residual stresses: high welding speed and lower heat input result in reducing residual stresses [7]. 12
26 2.4.2 Focusing Parameters The main focusing parameters are shown in Figure 2.4 and can be summarized as: focal spot, focus spot depth, f number and focal spot location [ 19, 20]. Optimization of these parameters means providing higher laser energy that gives higher penetration depth and an acceptable sound weld. Focus spot: when light is focused by the optic, the rays converge to very small waist diameter (d) before diverging again. This minimum waist diameter called focus spot that Laser beam F: Focal length L: Depth of focus f number = F / D has maximum power intensity. The smallest the focus spot the highest laser density Focal spot : min. waist diameter (d) Max. laser intensity which provides highest penetration depth. Fiber Working head Output Coupling optic +Z f -Z f work piece Figure 2.4 : Focusing parameters [ 19, 20]. For a CO 2 laser, the focal spot diameter can be calculated through the following equation: d = 2.44* * F *(2M 10) D (2.4) Where: : Wave length (mm) F: focal length (mm) D: beam diameter incident on optic (mm) M: laser beam mode, which deps on the transverse electromagnetic mode (TEM) that describes- the profile of power distribution across the beam diameter. (ex. TEM 01 M = 0.01, TEM 20 M = 0.2) [ 19]. 13
27 For Nd:YAG laser focal spot can be calculated using the following equation: d = 2 * * F (2.5) Where: : Beam convergence angle (radian) F: Focal length (mm) d: Focal spot diameter (mm) [ 19]. Although the highest power density is achieved by using the smallest focal spot diameter that leads to some restrictions; as the focal spot becomes too small the convergence angle becomes too large causing high variation in power density for a small change in focal spot location. In this way, the process becomes less stable and that may lead to reduction in penetration depth. Also, when the focal spot is too small it will result in very narrow weld geometry which is sensitive to the alignment accuracy of the welding pieces. Futher, significant underfill may occur due to high evaporation rate that took place in this small area causing unacceptable weld geometry [ 19, 20]. Depth of focusing: at the focus depth region the beam diameter should not be more than 5% larger than the focal spot diameter and the corresponding laser power density should not be less than 10% of the highest power density at the focal spot location. The bigger the focus depth the more stability achieved during the welding process [19, 20]. Focus depth can be calculated by the following equation [20]: L = 2 * 2 * F ( ) 2 (2.6) D 14
28 f number: the ratio of focus length (F) to the beam diameter (D) is defined as f number. The optic focusing characteristic can be define by f-number as shown in Table 2.1. Table 2.1 : Effect of f - number on focusing characteristics [ 19]. Higher f - Number Lower f - Number Higher focus length (F) Lower focus length (F) Higher focus depth (L) Lower focus depth (L) Smaller convergence angle Larger convergence angle Larger focal spot diameter (d) Smaller focal spot diameter (d) More stable welding process Less stable welding process Since focus depth (L) increases with increasing f-number as can seen in Table 2.1, the highest f-number is desirable in laser welding process. Common values of f number for CO 2 laser are from 6 to 7, and for Nd:YAG near 4 [ 20]. Focal spot position: the focal spot should be positioned in a place relative to the work piece surface that gives the highest penetration depth. In general the work piece surface should be located within the focus depth region because after this region the variation in power density will be very high. For autogenous laser welding of Al alloys, the experiments show that when the focal spot is located below the work piece surface; more penetration was achieved than when the focal spot was on the surface [ 20]. For Mg alloys, however, the surface focal spot is desirable for thin plates of 2.5 to 3 mm in thickness, and for thick plates with 5 to 8 mm in thickness experimental results showed that pointing the focal spot below the work piece by 2 mm resulted in better weld quality [ 5, 14, 13]. This observation was based on weld geometry (i.e. penetration depth, aspect 15
29 ratio and underfill). On the other hand, Dhahri et al. [ 1] reported that suitable weld results were obtained for Mg alloy WE43 with 4 mm thickness plates when the focal spot position was on the surface or 1 mm under. Laser welding modes are also affected by the degree of defocusing, Zhao et al. [ 17, 10] examined the weldability of die cast Mg alloy AM60B, they reported that as the degree of defocusing increased the laser welding mode changed from keyhole to conduction mode. This is because the power density in the defocusing case was less than the threshold value of keyhole formation. As a conclusion, for a given laser power and welding speed optimization of focusing parameters deps mainly on focal spot diameter, f-number and focal spot position. The high value of f number yields more stable laser welding process but in the same time it results in a reduction in laser power density. Therefore larger f number consistent with the required laser power intensity at a chosen welding speed must be used [ 20]. Surface focal spot position can be used when laser welding (autogenous welding) Mg alloys with thin plates (< 4 mm). For thick plates (greater than 4 mm) the focal spot must be pointed under the work piece surface to give better weld geometry Shield Gas Parameters Shield gas is used during laser welding process for two important reasons [ 19, 20]: 1. To protect the weld keyhole and the molten metal from oxidation and hence reduce the porosity and oxide inclusions. 16
30 2. To suppress plasma formation that is created by the ionized vapor over the weld zone which will lead to higher transmission efficiency for laser beam. The Most important parameters in shield gas are: shield gas type, gas flow rate and nozzle geometry [ 19, 20] Shield Gas Types Helium (He) is widely used with CO 2 and Nd:YAG laser because it has the highest ionization potential that gives high ability to suppress the plasma formation during the welding process. Another advantage, He is lighter than air and thus the shielding device has higher ability to remove the gases from above the welding area [ 19]. Nitrogen (N 2 ) has good ability to prevent plasma formation but it can cause embrittlement in certain alloy [ 19, 20]. Whereas argon (Ar) has high ability to prevent oxidation, good ability to suppress plasma formation and compared with He, Argon provides substantial cost saving for large production process. One disadvantage in using Ar is that the shield gas device must provide high capability to remove the gases from above the weld area because Ar is heavier than air. If the shield device is not efficient, Ar may stagnate above the weld area causing high dense gas that reduce the transmission efficiency of the laser beam [ 19] Shield Gas Flow Rate Gas flow rate is an important factor in term of weld quality and cost. It deps on the amount of laser power, the accessibility to the joining parts, nozzle geometry and nozzle height [19,20]. 17
31 Gas Shield Device Side flow and co-axial flow are commonly used devices with CO 2 and Nd:YAG laser. Side flow device provides good visual access to the target area but its alignment with welding seam is critical. Co-axial device is more practical mechanism for robotic purposes and its alignment is not critical as in the side flow device, but the co-axial flow may produce a negative pressure be exerted along the beam axis causing drawing of some material elements from the welding area. Also, for high power laser more than 5 kw the co-axial flow may form plasma above the welding area affecting the focusing of the laser beam. In this case side flow device can be used to reduce the effect of plasma formation [ 19, 20]. Table 2.2 lists the optimized shield gas parameters that used for different Mg alloys during laser welding process: Table 2.2: Optimization of shield gas parameters Ref # Mg alloy Laser Power (KW) Shield gases Optimum gas flow rate Shield gas device 14 cast & wrought 2.5KW CO2 He, Ar, N2 12 l/min co-axial 9, 17 AM60B 3KW Nd: Yag He 94 l/min side flow Ø8mm 22, 23 AZ31B-H24 2KW Nd: Yag Ar 40 l/min side flow: 1cm 6KW CO2 He 25 l/min side flow: 1cm 12 AZ91HP 3KW Nd: Yag AM50HP 6KW CO2 He 12 l/min co-axial 24 cast & wrought 2.5KW CO2 He, Ar, N2 10 l/min WE43 RZ5 5KW CO2 He 50 l/min
32 2.5 Weldability of Magnesium Alloys The weldability of alloy can be defined as the ability to produce sound and acceptable weld joints using a certain set of laser parameters. In addition to laser welding and process parameters, the weldability of magnesium alloys are affected by alloy composition, the metallurgical properties, mechanical properties and the physical properties of the base metal. The criterion of sound weld area can be described by producing full penetration weld with no significant weld defects (i.e. cracks or porosity), good weld surface quality, and acceptable metallurgical and mechanical properties [ 13, 19, 20, 23] Microstructure The welded area is divided through microstructure analysis into two regions, the fusion zone (FZ) and heat affected zone (HAZ). The fusion zone is the main region of the weld joint where melting takes place due to absorption of laser power. Adjacent to the FZ is the heat affected zone, which separates the FZ from the base metal. The laser welding process as described before has an important advantage in that it produces a small HAZ. The HAZ is a result of the heat transfer from the FZ to the base metal. The heat induced during the laser welding process may cause unacceptable metallurgical changes in the microstructure like cracking, grains coarsening, brittleness and pore formation Fusion Zone (FZ) Weisheit et al. [ 14, 13] examined the weldability of different Mg alloys. They observed that most Mg alloys formed cellular structure in the FZ and this was attributed to the 19
33 increased segregation effect of the melt caused by the high cooling rate during the welding process. This observation was not for all Mg alloys used in their study, for instance; alloy WE54 showed more globular grain shape, alloys AZ61 and AZ91 showed more dritic fine grained and alloy AZ31 showed grain coarsening in the FZ and HAZ as a result of low alloy content. On the other hand, Weisheit et al. [ 14, 13] reported that the investigated Mg alloys except AZ31 showed grain refinement in the fusion zone as a result of high cooling rate. The grain growth in alloy AZ31 was also reported by Sanders et al. [ 22], they mentioned that using higher welding speed could reduce the grain growth effect. Haferkamp et al. [ 8] examined the effect of welding speed on the grain refinement for alloy AZ91D. They observed that high speed welding caused a significant grain refinement whereas low welding speed yielded microstructure nearly the same as in the base metal. Pastor et al. [ 10] studied the microstructure of AM60B alloy, they observed that both FZ and base metal consist of cored grains of Mg rich solid solution surrounding by Mg 17 Al 12 intermetallic phase. They also found that the intermetallic phase in the FZ was greater than that in the base metal caused by non-equilibrium solidification during the welding process. The morphology in the FZ changed from equiaxed to dritic when welding speed was increased Heat Affected Zone (HAZ) Weisheit et al. [ 14, 13] reported that no grain coarsening was observed in cast and wrought alloys except wrought alloy AZ31 that showed significant grain coarsening in the HAZ. The grain size was increased about 10 times in the direction of the heat flow and 3 times in the direction perpicular to the heal flow. They also reported that in the 20
34 investigated casting alloys, except alloy WE54, change in the microstructure of the HAZ occurred through a liquation of the grain boundaries eutectics and intermetallics that have low melting temperatures. Many researchers [ 14, 15, 18] reported that one of the important characteristics of laser welding process is the small HAZ compared with the conventional welding processes and consequently lower possibility for metallurgical damages in this region Porosity Formation Porosity occurred when bubbles of gas are trapped during weld solidification. The presence of porosity in the weld pool may lead to reduction in weld cross-section area resulting in a bad effect on the mechanical properties of the joint. Some of the process conditions may lead to porosity formation like unsuitable shield gas device which may cause air or moisture to be trapped in the weld pool. Another source of porosity formation is the surface contamination in the plate edges (e.g. grease, moisture and paint). Nonoptimum laser parameters in addition to alloy parameter may result in porosity formation in the weld area (FZ and HAZ). Weisheit et al. [ 13, 14] reported that the porosity formation in the sand cast and extruded Mg alloys were very low, whereas a few large pores were formed with Mg alloys having high contents of Zn or Al elements (e.g. alloy AZ91 and alloy ZC63). They also reported that, the porosity formation was affected by the type and condition of the alloy. For example, AZ91 and AM60 alloys that were high pressure die casted (HPDC) under non vacuum process, formed extremely high area percentage of porosity and this was attributed to the trapped gaseous elements during the manufacturing of these alloys. Haferkamp et al. [ 8] compared the porosity formation 21
35 between Mg alloy AM60B (non vacuum HPDC) and alloy AZ91 (vacuum die cast). They found that alloy AM60B has more pre-existing pores in the base metal because it was not produced under vacuum causing high concentration of gases in the base metal. The high content of the pre-existing pores in the base metal was the reason for the high porosity formation during the welding process. Zhao et al. [ 10, 17] examined the weldability and porosity formation of Mg alloy AM60B (HPDC). They observed that the porosity content in the FZ was greater than the porosity content in the base metal. The increase in the porosity content in FZ was attributed to one or more of the following reasons: first - the keyhole stability was responsible for the porosity formation, second - the coalescence and expansion of preexisting pores in the base metal, third - the rejection of hydrogen from the intermetallic compounds during the welding process. They concluded that the keyhole stability was not responsible for the porosity formation during the process because changing the laserwelding mode from keyhole to conduction mode by defocusing the laser beam did not eliminate the porosities. The mixed unstable mode between the keyhole and conduction mode was not found in Mg alloy AM60B comparing with Al alloys that showed unstable mixed mode when the laser power density is just above the threshold value. The coalescence and the expansion of the small pre-existing pores (also reported by [8,12]) in the base metal was the main mechanism of porosity formation and they compared the experimental results with the mathematical model, which showed good agreement. The remedy for the porosity formation was by reducing the heat input (reduce the laser power or increase the welding speed) and also the porosity can be reduced more by re-melting the welded joint using second run keyhole mode laser welding. 22
36 Mikucki et al. [ 24] reported that the porosity formation in AZ91 Mg alloy was depent on the amount of dissolved hydrogen in the alloy. They also found that the rejection of hydrogen from intermetallic compounds such as Mg 17 Al 12 assisted in the nucleation and growth of micro porosity during the last stage of solidification during the process Cracks formation There are three basic types of cracks that form in the fusion or heat affected zones [ 19]: A. Solidification cracking (hot cracking): happens in the liquid films which surround the solidifying grains. These films have low melting temperature and have brittle characteristic (after solidification) causing cracking when subjected to high transverse contracting stresses induced during the rapid solidification process. B. Heat affected zone liquation cracking: the low melting films which surround the grain boundaries may also present in the HAZ causing cracking due to thermal stresses induced during the welding process. C. Heat affected zone cold cracking: this type of cracking can occur after or during the welding process and it is caused by the dissolved hydrogen in the alloy, the brittle intermetallic phases and the residual stresses. Weisheit et al. [ 13, 14] reported that most of Mg alloys could produce crack-free weld area by applying the optimum laser parameters except QE22 alloy that showed high sensitivity to solidification cracking. On the other hand, Baeslack et al. [ 25] observed that fine cracks formed in the grain boundaries in the HAZ for Mg alloy WE54, and was 23
37 caused by the liquation of the intermetallic phases. Whereas Weisheit et al. [ 13, 14] reported that no cracking caused by liquation of the grain boundaries for the same alloy. Sun et al. [ 5] reported that the solidification crack sensitivity was high for Mg alloy AZ31. They observed that the solidification crack formation was reduced when applying high welding speed to reduce the laser heat input, which may cause simultaneous solidification of the low melting phases with the other alloy phases. On the other hand, Lathabai et al. [3] reported that solidification crack formation does not appear to be a problem during laser welding of Mg alloy AZ31. Further, Haferkamp et al. [ 8] reported that micro cracks may occur in weld area when laser welding Mg alloys which have high Al (more than 6% wt.) alloy elements or Zn (more than 1% wt) alloy elements Mechanical properties Heat treatment induced during the laser welding process in the FZ and HAZ may cause a change in the mechanical properties of the weld area such as hardness, toughness, tensile strength, yield stress, fatigue strength and formability. Many researchers examined the changes in hardness in the weld area for the Mg alloys but very few studies were directed subjected towards the other mentioned mechanical properties Hardness Weisheit et al. [ 13, 14] investigated the effect of laser welding on the hardness of Mg cast alloys, wrought alloys and age hardened alloys. For the as cast alloys the hardness was increased in the FZ due to the fine grain structure produced by the rapid cooling during the process. However, in the HAZ there was no change in hardness because there was no 24
38 change in the microstructure. For the wrought alloys the hardness was in the same range for the base metal, HAZ and FZ. They attributed the absence of any changes in hardness for the wrought alloys to the complete compensation of the loss in work hardening effect by grain refinement effect. For the age hardened Mg alloys, the hardness in the FZ remained at the same level as the base metal for AZ91, ZC63 and WE54 alloys, but it decreased in alloy QE22. In the HAZ there was no change in hardness for alloys (ZC63 and WE54) whereas it decreased for alloys (AZ91 and QE22). Weisheit et al. did not explain the inconsistent behaviors for Mg age hardened alloys. Similar conclusion was reached by Pastor et al. [ 10] for high pressure die cast alloy AM60B which showed an increase in hardness in the FZ and that was attributed to grain refinement and the presence of intermetallic phase Mg 17 Al 12. Also, Haferkamp et al. [ 8] examined the change in hardness for different cast alloys. They reported that high welding speed has a significant effect on grain refinement and thus increase in hardness occurred in the FZ whereas at low welding speed the hardness in the FZ was in the same level as the base metal. On the other hand, Dhahri et al. [ 9] reported that there was no significant change in micro hardness in the FZ for Mg cast alloys WE43 and ZE41. For AZ31 wrought alloy, which showed grain growth in FZ and HAZ, Weisheit et al. [ 13, 14] and Haferkamp et al. [ 8] reported that there was no change in hardness in FZ and HAZ, whereas Sanders et al. [ 22] and Sun et al. [ 5] reported that the hardness decreased in FZ and HAZ due to the grain growth effect. 25
39 Tensile Mechanical Properties Lehner et al. [ 12] reported that the mechanical properties of the weld area for Mg alloys AZ91 and AM50 (HPDC under vacuum) were in the same range as the base metal. Although the weld area had an underfill which reduced the weld area, the tensile strength was in the same level as the base metal which proved that the weld area had better mechanical properties than the base metal. The tensile strength was mainly affected by the gaps between the parts. Significant decrease in the tensile strength occurred when the gap becomes relatively large compared with the plate thickness. Haferkamp et al. [ 8] examined the mechanical properties of the welded area for different types of cast and wrought Mg alloys. For autogenous laser welding the fracture location was in the FZ. At high welding speeds of 8 m/min the fracture strain of the welded area was reduced by 64% compared with the base metal. They also reported that small volume pores with uniform distribution through the weld cross-section showed higher strength than those with few large pores. Fracture occurred in the plane, which had maximum area percentage of porosity Oxide Inclusion Weisheit et al. [ 13, 14] reported that although Mg alloy has a high affinity for oxygen, the oxidation in the welded area for most Mg alloys was not severe. The only exception was alloy WE54 that showed increase in oxide inclusion in the FZ, which was attributed to the high content of yttrium element in this alloy. Sanders et al. [ 22], also, reported that there was no increase in the oxide inclusion when laser welding Mg alloy AZ31B which indicated that the shielding device was effective. 26
40 2.5.8 Weld Geometry Full penetration autogenous laser welding of Mg alloys leads to underfill in the weld pool which is small for the thin plates and significant for the thick ones. Also, the underfill deps on the alloying elements. The underfill is small for Mg alloys that have high amounts of Zn and tangible for Mg alloys that have high amount of Al element [ 13, 14]. The underfill becomes significant when a large gap between the welding parts is used. If the overfill is present during full penetration autogenous laser welding, the FZ has a large amount of area percent of porosity that forces the melt to perform the overfill shape. Overfill can be reduced using higher welding speed [ 10]. As discussed in the keyhole stability, Mg alloys produced stable keyhole during the welding process because of high vapor pressure and low surface tension of Mg element. The low thermal conductivity of Mg alloy comparing with Al alloy, leads to larger weld area and more penetration through the thickness [ 8, 17, 21]. The effect of thermal conductivity, surface tension and vapor pressure is represented schematically in Figure 2.5. Effect of surface tension High K High K Low K Low K Effect of vapor pressure Figure 2.5: Schematic diagram for the effect of physical properties on weld geometry 27
41 2.6 Laser welding with filler wire The development of using filler wire in laser welding process is still in its infancy, but it is getting more attention since it might solve many of the problems facing autogenous welding. The most important advantages of using filler material are: to improve weld properties [ 6, 15, 19], to increase the gap between the welding parts [ 6, 15, 19], and to weld thick sections using a multi-pass technique [ 15, 19]. Compared with other welding techniques laser welding requires less filler wire per meter of welded seam [ 6], underfill and notching effect can be overcome by using filler wire [ 6], and finally the porosity of the welded joint can be reduced using filler metal [ 8] Continuous wire feed system The most important method of applying the filler wire is the use of continuous wire feed system. In this process, part of the laser beam will be reflected by the wire [ 15] and the interaction between laser beam, filler wire, welding parts become a complicated process. Non optimum feeding rate may cause an increase in side wall porosity and it ts to increase with increasing the gap size. Root porosity may also result when using multi pass welding. Wire feed rate is depent on the welding speed (V), gap cross section area (A gap ) and cross section area of the filler wire (A wire ) as can be seen through the volumetric flow rate constancy and as shown by the following equation [ 19]: Wire feed rate = V A welding A wire gap (2.7) 28
42 2.6.2 Filler Wire and Gap Size When laser welding of the butt joints, it is recommed to use a joint gap slightly wider than the diameter of the filler wire. If the gap was narrower than the wire diameter the following problems may be encountered: The need for precise control to place the wire right on the gap edges and that yields small positioning tolerance between the filler wire and the gap edges. Any change in the wire s location relative to the gap edges may cause an excessive spatter and vaporization of the weld pool. In autogenous laser welding, the maximum gap size that can be used is roughly 10% of the plate thickness whereas the gap size can be equal to the filler size when using filler wire [ 15] Wire Feed Delivery Angle The recommed angle between filler wire and laser axis is between (30 60 o ) and according to [ 15, 14] 45 o is preferable. A smaller angle causes the wire to intersect with a large area of the laser beam, which may lead to high reflection in the laser beam causing melting and vaporization of the wire without interaction with the weld pool [ 19] Feeding Direction The recommed feeding direction is the front edge of the leading laser side. The trailing edge may cause incomplete mixing of the wire into the pool [ 15, 19]. 29
43 2.6.5 Filler Wire Position The position of the filler wire in respect to the focal spot and weld pool surface is an important parameter in the process. Intersection of the filler wire with the laser beam above the weld pool surface must be avoided because it might cause an excessive spatter of the filler martial and reduce the penetration ability of the laser beam, also it may cause tooling damage [19]. Jokinen and Kujanpaa [ 16] and Dawes [ 19] reported that for thick section plate of stainless steel, wire position should be below the focal spot. Positioning the filler wire above the focal spot may cause poor penetration, material spattering and weld defects [ 16, 19] Laser Welding With Filler Wire for Mg Alloys Regarding Mg alloys, the minimum available diameter of the filler wire is 1.6 mm (because of the poor formability of Mg alloys) which allows very small positioning tolerance leading to difficult welding process [ 6]. Haferkamp et al. [ 6] reported that a 1.2 mm diameter of filler wire has been developed in Germany. This might lead to a significant development in Mg laser welding with filler wire. Haferkamp et al. [ 8] observed that the fracture strain of the weld joint of AZ31B Mg alloy which was welded using filler wire increased two times compared with autogenous laser welding. This was attributed to the absence of the notching effect and the fracture took place in the HAZ rather than the FZ. The summary of this literature survey can be seen in Appix (A.1). 30
44 Chapter 3 / Experimental Procedure 3.1 Material and Equipments The experimental material was sand cast ZE41A-T5 (Mg-4.2Zn-1.2Ce-0.7Zr) magnesium alloy used generally for engine casings. The cast plates had sizes of approximately 300 x 150 x 3 to 4 or 6 mm. The plates with original thickness of 3 to 4 mm were cut into four small pieces for laser welding, each with approximate sizes of 150 x 75 x 3-4 mm. The magnesium castings were machined to 2 mm and 6mm thickness. The joint faces were also machined along the length for all the specimens. Prior to laser welding the joint faces and their surroundings were carefully cleaned by acetone to remove any contaminations. The plates were laser welded at Aerospace Manufacturing Technology Center (AMTC NRC) Located in Montreal Quebec. The laser welding machine used in this study is a continuous wave (CW) 4 kw HL4006 Nd:YAG (neodymium-doped yttrium aluminum garnet) laser system equipped with an ABB robotic and magnetic fixture system. A focal length of 150 mm and a fiber diameter of 0.6 mm were employed. Helium was used to shield the top surface and argon was used for the bottom surface of the workpieces. The flow rates were 18.9 and 21.2 l/min (40 and 45 cubic feet per hour) for the top and bottom surfaces respectively. The shielding gas was directed to the top surface of the workpiece at an angle of 30 o (with the horizontal) and was vertically and uniformly directed to the bottom surface. The workpieces were positioned and clamped in a fixture and the butt joint with a different 31
45 gap size between 0 to 0.6 mm. Defocusing range was between 0 and -4 mm with 0.45 mm focal spot diameter. A filler wire of EZ33A-T5 (Mg-3Re-2.5Zn-0.6Zr) Mg alloy with 1.6 mm diameter and 990 mm length was used through a continuous feeding mechanism. The position of the filler wire was just above the surface of the workpiece. A delivering angle of 60 o was used between the filler with and the laser beam axis to reduce the contact area between the filler and laser beam. During laser welding, the workpieces were stationary while the laser beam scanned at a various power between 2.5 to 4 kw and different speed (2-7 m/min). Wire feeding rate was calculated using volume flow rate constancy equation (3.1): Wire feed rate = weldingspeed x gaparea fillerwire area (3.1) The laser weldability of sand cast ZE41A-T5 magnesium alloy was examined through microstructure and mechanical tests. A length of approximately mm was cut from both s of each joint to exclude the unstable segments at the start and of laser welding. Cross-sectional samples for metallurgical examination were cut from the weld joints at three locations (start, middle and ). These cut specimens were mounted using hot and cold-setting resin and polished to a mirror-like finish. The polished samples were then etched in Nital solution. The microstructure details were examined using an Olympus optical microscope equipped with Discover Essential image analyzer software. The average values were calculated from the quantitive measurements of the three specimens (start, middle and ). One of these specimens was also used for the Vickers 32
46 microindentation hardness test performed by Duramin A-300 hardness Tester, under a test force of 200 g and dwell period of 15 seconds. Several tensile-specimens cut from weld joint were prepared according to ASTM standards (B557M-02A). The samples were examined for the tensile test at constant displacement rate (0.01 mm/sec) using an MTS- 100 KN tensile test machine. 3.2 Key Experiments The weldability investigation of the 2 mm butt joint plates using filler wire was divided into the following stages: Effect of welding speed on weldability The objective of this stage was to investigate the weldability for high welding speed; therefore the laser power was fixed at the maximum value (4 kw). The gap size was 0.4 mm which is quarter the size of the filler wire. Variable welding speed between 4 to 7 m/min was used in the process. Effect of gap size on weldability The optimized welding speed found in first stage was used to investigate the effect of variable gap size (between 0.1 to 0.6 mm) on the weldability. The laser power was fixed at the maximum value (4 kw). Effect of laser power on weldability Variable laser power between 2.5 to 4 kw was used in this stage. The optimized welding speed and gap size found in the first and second stages, respectively, were used. The literature survey showed that the optimized defocusing used for 33
47 thin plate was zero for autogenous welding; therefore this was used in laser welding of the 2 mm plates. Repeatability of laser welding process The reliability of laser welding process was assessed by producing repeatable welded joints utilizing the optimized parameters in the above mentioned stages. Better quality of casting was used for this purpose. Laser welding of 6 mm plate Due to the limited laser power this stage was challenging to produce full penetration sound weld by single pass. Because of the thick plate, the laser power was kept at 4 kw. Bead-on-plate welding was used to optimize the defocusing parameter. Autogenous laser welding was used to weld 6 mm butt joint plates to optimize the welding speed since it is easier in preparation and optimization. The starting welding speed was chosen to be one degree lower than the optimized welding speed for 2 mm plate. After producing a full penetration welding in autogenous process, the welding speed was adjusted to weld with filler wire using the optimized gap size found in the welding of 2 mm plate. The objective of welding the 6 mm plate was not limited to produce sound weld, but also to give better understanding of laser welding of thick plates. 34
48 Chapter 4 / Results and Discussions 4.1 Effect of welding speed on the weldability of 2 mm plates The plates were laser welded at 4 kw laser power, 0.4 mm gap size, surface defocusing and with various welding speeds as shown in Table Table 4.1.1: Key experiments : effect of welding speed on the weldability Sample Gap Size Laser Power Welding Speed Wire feeding rate Defocusing # mm kw m/min m/min mm Weld Geometry To analyze the weld geometry of the tested samples, the average weld width (average of top and root bead width), penetration depth, crown height, root height, crown area, root area, and total weld area were measured. The effect of welding speed on the width, height and weld area are shown in Figures and As expected, the weld dimensions decreased with increasing welding speed. As the welding speed increases the laser fluence (eq. 4.1) decreases implying that less heat was delivered to the workpiece resulting in smaller melted weld area and joint size. The sample tested at 7 m/min shows slight deviations due to the large misalignment of the work-pieces. At high welding speed, it was found that the 1.6 mm filler wire was difficult to melt due to the small diameter of beam laser. The aspect ratios (penetration depth / top width) for all sections 35


 133 107 89 76 4 Laser Fluence (J/mm 2 )")


49 Joint Size (mm) Area (mm 2 ) End Sectional position Middle Start were greater than 1.2 indicating that the keyholes were established during the welding [ 26]. Laser Fluence Focal Laser Power Spot Diam. x Welding Speed (4.1) Welding Speed (m/min) Figure Effect of Welding Speed on Weld Geometry. 3 Laser Fluence (J/mm 2 ) Laser Fluence (J/mm 2 ) Total Depth Weld Width Root Height Crown Height Total FZ area Middle area Root area Crown area Welding Speed (m/min) a) b) Welding Speed (m/min) Figure Effect of Welding Speed on (a) joint size and (b) weld area. Higher crown and root heights were observed in the starting section of the sample welded at 4 m/min as shown in Figure The excessive crown and root heights might 36
![increase the stress concentration in these areas [ 27]. The large crown obtained in this sample is probably due to the expansion and flotation of the gas pores [5] as demonstrated in Figure 4.1.](/docs-images/89/100978452/images/50-0.jpg "1 where gas porosity has longer time to form and grow at lower welding speed. As well known, the use of filler wire might reduce the tency to form underfill.")
50 increase the stress concentration in these areas [ 27]. The large crown obtained in this sample is probably due to the expansion and flotation of the gas pores [5] as demonstrated in Figure where gas porosity has longer time to form and grow at lower welding speed. As well known, the use of filler wire might reduce the tency to form underfill. The sample welded at 5 m/min (middle section as shown in Figure 4.1.1) showed a root underfill near the base metal (BM), probably due to a BM defect. The sample welded at 7 m/min (ing section as shown in Figure 4.1.1) showed a shrinkage groove at the root. The sample welded at 6 m/min showed smooth top and root bead surface with narrow and uniform weld width, which was the optimum weld geometry obtained among the tested samples Microstructure Figure shows that laser welding also produces three distinct regions: fusion zone (FZ), partially melted zone (PMZ) and heat-affected zone (HAZ). It was observed that the grains in the FZ were significantly finer than those in the BM and HAZ, which can be attributed to the high cooling rate ( o C/s) obtained in laser welding process compared with the low cooling rate ( o C/s) obtained in arc welding [ 28]. PMZ FZ HAZ Figure Micrograph Showing the FZ, PMZ and HAZ. 37

![It was reported that grain refining of magnesium alloys seems to be based on a peritectic reaction on Zr nuclei [ 28].](/docs-images/89/100978452/images/51-1.jpg "Originally, the grains nucleate as small spheres around the initiating Zr particles.")
51 4 m/min 5 m/min 0.02 mm Figure Effect of Welding Speed on FZ Grain Morphology The fusion zone microstructure was found to be fine equiaxed or rosette grains as shown in Figure Although the welding speed increased from 4 to 7 m/min, no significant change in grain size in the FZ was observed. The fine equiaxed grains obtained in the laser process can also be attributed to Zr in the ZE41A-T5 alloy. It was reported that grain refining of magnesium alloys seems to be based on a peritectic reaction on Zr nuclei [ 28]. Originally, the grains nucleate as small spheres around the initiating Zr particles. Because the nucleation is so prolific, many grains are nucleated at once (simultaneously) and the grains cannot grow far before they mutually impinge. Figure shows that the partial melting zone (PMZ) is rather narrow; only one or two grains wide. This figure also shows the cellular growth from the large grains in the PMZ. The length of the cellular growth is approximately similar to the grain size in the FZ. This limited cellular growth can be attributed to the high cooling rate and the presence of prolific Zr nuclei. It was difficult to distinguish the difference in microstructure between the HAZ and BM indicating the absence of any grain coarsening in the HAZ. For this 38
52 Porosity % Number of Micro Pores Number of Pores reason the HAZ was identified by the microindentation hardness as will be discussed later Porosity The relation of porosity area percentage and number with welding speed is shown in Figure The porosity area percentage decreased from 1.26% to 0.57% as the welding speed increased from 4 to 7 m/min. Although it was difficult to find the tr between welding speed and number of pores, in general increasing the welding speed reduces the number of pores. Figure shows the average pore size distribution for all samples. It was observed that the majority of pores were smaller than 75 µm, with typical size about 20 µm. Laser Fluence (J/mm 2 ) Porosity% Number of Pores Welding Speed (m/min) m/min 5 m/min 6 m/min 7 m/min above Figure Effect of Welding Speed on Porosity. Figure Porosity Distribution Keyhole instability is considered to be one of the most important reasons for porosity formation in Al alloys. The stability of the keyhole deps on the balance between the vapor pressure and the surface tension [ 20]. The vapor pressure ts to open the keyhole whereas the surface tension ts to close it. The collapse of the keyhole takes place when there is a sudden drop in vapor pressure, causing the molten 39
53 metal to slump into the keyhole. Compared with Al-alloys, Mg alloys have low surface tension and high vapor pressure (due to evaporative elements such as Zn, Mg, etc.) leading to the formation of a more stable keyhole [ 17]. In addition, Mikucki et al. [ 24] reported that the porosity in AZ91 Mg alloy was depent on the amount of dissolved hydrogen in the alloy. The rejection of hydrogen from the solid-liquid interface assisted in the nucleation and growth of micro porosity during solidification. Regarding ZE41A-T5 Mg alloy (which contains Zr element) hydrogen reacts with zirconium to form ZrH 2. Hence, hydrogen should not be the main source for the formation of porosity in the experimental alloy ZE41A-T5 [ 28]. Zhao et al. [ 10, 17], Haferkamp et al. [ 8] and Lenhner et al. [ 12] reported that the coalescence and expansion of pre-existing pores in the BM are responsible for the porosity formation. The applied heat by the laser beam may increase the pressure inside the pores, causing the expansion and coalescence to form bigger pores especially at lower welding speed as shown in Figure The maximum porosity percentage measured was 1.26% at 4 m/min but it is considered to be low compared with the published data for other Mg alloys [ 10]. The main reason may be due to the use of filler wire, which has low pre-existing pores since it was produced by extrusion process Crack Formation Weld cracks were observed for ZE41A-T5 alloy. For all tested samples the area of solidification cracks was less than 1 mm 2, thus these cracks are micro-cracks [ 30]. The maximum total crack length in the fusion zone was 1.47 mm, and the maximum average 40
54 Crack Length (mm) Number of Cracks width was 2 µm for the sample welded at 4 m/min. It was observed that increasing the welding speed from 4 to 7 m/min reduced the total crack length from 1.47 to 0.68 mm and reduced number of cracks from 9 to 5, as shown in Figure The higher welding speed reduces solidification cracks, which seems to agree with the published results of AZ31 Mg alloy [ 5]. Increasing the welding speed reduces laser heat input, which may cause simultaneous solidification of the low melting phases of the grain boundary with the primary solidifying phase (alloy matrix phase) because of the increase in cooling rate. The low crack formation experienced here may be attributed to the followings: (i) formation of fine microstructure in the FZ (which reduces the susceptibility for cracking), (ii) using the filler wire EZ33A-T5, since the filler wire helps to reduce evaporative losses of alloying elements and reduce the porosity formation, and (iii) rare earth elements in the experimental alloy and the filler wire, which beneficially narrow the freezing range and thus reduce the tency of crack formation. Laser Fluence (J/mm 2 ) Crack Length Number of Cracks Welding Speed (m/min) Figure Effect of Welding Speed on Crack Length and Number of Solidification Cracks in the FZ. Solidification crack occurs in the liquid films which surround the solidifying grains. These films have low melting temperature and appear to be brittle after solidification [ 19], causing cracking when subjected to high transverse contracting 41

 can increase solidification cracking susceptibility by promoting a large freezing")
![temperature range [ 33]. The ZE41A-T5 alloy has a wide solidification temperature range (120 o C) [ 28].](/docs-images/89/100978452/images/55-2.jpg "Thus, the occurrence of a solidification crack is possible during the laser welding.")

55 stresses induced during the rapid solidification process (Figure 4.1.8a). According to Borland's theory [ 31, 32], alloying elements with high solubility and low partitioning coefficients (e.g. Zn in Mg alloys) can increase solidification cracking susceptibility by promoting a large freezing temperature range [ 33]. The ZE41A-T5 alloy has a wide solidification temperature range (120 o C) [ 28]. Thus, the occurrence of a solidification crack is possible during the laser welding. Weld cracks may start from the area of high tensile stresses or stress raisers. Therefore, the cracks may initiate from oxide film, gas and shrinkage porosity and defects from the base metal as can be seen in Figure (a) (c (b) (d) mm Figure Solidification Cracks in the FZ initiated by Various Sources Observed in Laser Welding of ZE41A-T5 Mg alloy. 42

56 The liquation cracks were observed in the HAZ due to the liquation of some low melting intermetallics in the grain boundaries. Figure shows a HAZ liquation crack observed in a sample welded at welding speed of 5 m/min Figure HAZ Liquation Cracks Observed in Laser Welding of ZE41A-T5 Mg alloy Micro-Indentation Hardness Vickers microindentation hardness was measured across the weld joints as shown in Figure These samples have had a natural aging over a period of approximately 12 months after the welding. The hardness values in the fusion zone have recovered to or even been higher than those in the base metal, probably due to the grain refinement in the FZ. However, there was a drop in the hardness in the heat affected zone. The width of the heat affected zone as indicated in Figure varies from 2 to 0.5 mm as the welding speed increased from 4 to 7 m/min. As the welding speed increased the total heat input 43
57 HV hardness HV hardness HV hardness HV hardness decreased and thus the heat transferred from FZ to the base metal was reduced resulting in smaller HAZ. The softening of the HAZ in the precipitate-hardenable alloys probably involves the dissolution of the strengthening phase Mg 9 Ce and the formation and growth of nonstrengthening phases [ 28]. The scattered data of the hardness in the base metal are probably due to the low load used in the test (200 g), cast micro-defects, and non-uniform cooling rate during casting HAZ FZ HAZ HAZ a) Position (mm) b) Position (mm) HAZ FZ HAZ c) d) Position (mm) Position (mm) HAZ FZ HAZ Figure Vickers Microindentation Hardness for Welding Speed at (a) 4, (b) 5, (c) 6, and (d) 7 m/min. FZ - HAZ Tensile Strength Four tensile specimens were prepared from each joint except the one welded at 7 m/min because of the large misalignment. The joint efficiency and the tensile strength property of the test samples are shown in Figure and Table 4.1.2, respectively. The joint 44
58 Joint Efficiency % efficiency is defined as the ratio of the tensile strength of the weld joint to that of the base metal (here 179 MPa according to AMS 4439). It is found that the weld joints have a joint efficiency of approximately 75-90%. Only two specimens out of 12 failed in the FZ, whereas all the other fractured in the base metal at a distance of 4 to 22 mm from the PMZ. Most of the samples were fractured in the base metal indicating that the FZ is stronger than the BM. One of the samples failed in the FZ shows low tensile property due to a visible big defect in the FZ Welding Speed (m/min) Figure Joint Efficiency of Laser Welded ZE41A-T5 Mg Alloy Using Filler Wire. Table Tensile Strength Property for the 2-mm Plates Laser Welded at Variable Welding Speeds. Experimental Tensile TS Sample Specimen Mpa T m/min T2 82 T3 157 T4 176 Faliure location BM FZ BM BM 5 m/min T1 164 T2 171 T3 157 T4 146 BM BM BM BM 6 m/min T1 92 BM T FZ T3 143 BM T4 166 BM 45
59 4.2 Effect of joint gap on the weldability of 2 mm plates The plates were laser welded using 4 kw laser power, 6 m/min (based on the results presented in section 4.1), surface defocusing and with variable gap sizes as shown in Table Sample Gap Size Laser Power Welding Speed Wire feeding rate Defocusing # mm kw m/min m/min mm Table 4.2.1: Key experiments / effect of gap size on the weldability Weld Geometry The effects of gap size on the width, height and weld area are shown in Figures and As indicated in Figure 4.2.1, there was a tency to form irregular FZ geometry as the gap size became smaller than 0.3 mm and larger than 0.4 mm. Excessive crown height was observed in the sample welded with 0.2 mm gap, and large shrinkage groove and underfill were observed when the gap was larger than 0.4 mm. Gap size smaller than 0.3 mm may cause difficulties in mixing of the melted filler wire with the melted sides of the BM. On the other hand, when the gap size was larger than 0.4 mm, there was a tency to form large drop through (root height) because of the high fluidity (low surface tension) and low viscosity of the Mg alloys [ 2]. The hourglass weld geometry was not found when the gap size was larger than 0.4 mm. Although there was a slight deviation in the average weld width and total area, it is noticed from the joint size charts 46

")


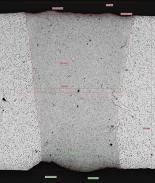
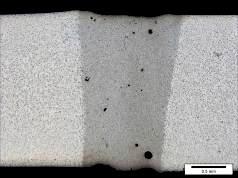
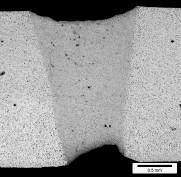
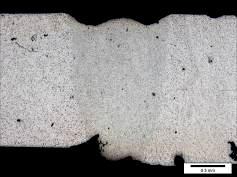
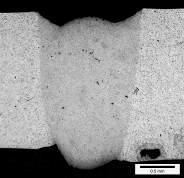
60 Gap Size (mm) Figure Effect of Gap Size on Weld Geometry Sectional Position End Middle Start 47
61 Area (mm 2 ) Joint Size a) Total Depth Root Height Crown Height Average weld width Gap Size (mm) b) Gap Size (mm) Total FZ area Middle area Root area Crown area Figure Effect of Gap Size on (a) joint size and (b) weld area. (Figure a) and the corresponding cross sections (Figure 4.2.1) that increasing the gap size more than 0.4 mm may cause a slight decrease in the FZ area due to the loss of molten drops through defects. The contribution of the filler wire in the FZ area was increased from 7% to 50% as the gap size increased from 0.1 to 0.6 mm. The operational range of the gap size can be increased using a smaller filler wire (here smaller than 1.6 mm) [ 6, 34] since the wire for conventional arc welding was relatively big for laser application. Haferkamp et al. [ 6] reported that a 0.2 mm gap size can be used in butt joint laser welding of Mg plates using experimental filler wire with 1.2 mm diameter. In this 48

62 work, good joint quality (refer to section 4.4) was obtained at 0.4 mm gap size during laser welding with 1.6 mm filler wire Microstructure The fusion zone microstructure was observed to be fine equiaxed grains, Figures and 4.2.4, but there was a tency to form a rosette grains as the gap size increased greater than 0.4 mm as shown in Figure The grain refinement in the FZ has been discussed earlier in section 4.1. Figure shows that the PMZ was very narrow, and there was no grain coarsening observed in the HAZ when compared to with the BM. 0.5 mm gap HAZ FZ PMZ Figure Micrograph Showing the FZ, PMZ and HAZ. 49


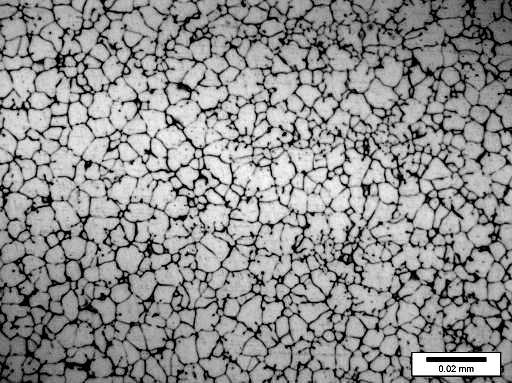
63 0.1 mm gap 0.2 mm gap 0.3 mm gap 0.4 mm gap 0.5 mm gap 0.6 mm gap Figure Effect of gap size on the FZ microstructure 50
64 Porosity % Number of Micro Pores Number of Pores Porosity The relationship of porosity area percentage and number of pores with the gap size is shown in Figures and The porosity area percentage decreased from 0.75% to 0.27% as the gap size increased from 0.1 to 0.4 mm, but almost remained constant above 0.4 mm. Gap size smaller than 0.3 mm may cause difficulties in mixing of the melted filler wire with the melted sides of the BM; which might have resulted in entrapment and expansion of large pores. Another possible reason is that using smaller gap size means an increase in the contribution of the BM to the FZ which may have pre-existing pores more than the filler wire. It was reported that FZ weld quality deps directly on the cast quality [ 35]. Figure shows a large pore near the PMZ for the sample welded at small gap size. It was observed that the majority of pores were smaller than 75 µm, with typical size about 15 µm as shown in Figure Porosity % Number of Pores Gap = 0.1 mm Gap = 0.2 mm Gap = 0.3 mm Gap = 0.4 mm Gap = 0.6 mm above Gap Size (mm) Figure Effect of gap size on Porosity. Range of Pore Size (micron) Figure Porosity distribution. 51

65 Crack Length (mm) Number of Cracks Figure Large porosity near the PMZ for the sample welded at 0.2 mm gap Cracks Weld cracks were observed in laser welded ZE41A-T5 alloy. In all samples the area of solidification cracks was less than 1 mm 2, thus these cracks are micro-cracks [ 30]. The maximum total crack length in the fusion zone was 1.41 mm (for the sample welded with 0.2 mm gap), and the maximum average width was 1.6 µm (for the sample welded with 0.5 mm gap). It was observed that the increase in the gap size slightly reduced the total crack length in the FZ as shown in Figure Gap Size (mm) Crack Length Number of Cracks Figure Effect of Gap Size on Crack Length and Number of Solidification Cracks in the FZ
66 Figures show the microstructures for some of the specimens welded with various gap size. It was found that there are four major groups of cracks: (i) the first group that initiated from or around large pore (Figures B, A, C and C), (ii) second group cracks initiated from the casting defects in the BM and grew to reach the FZ (Figures B, B), (iii) third group cracks initiated from high stress zones at crown and root (Figures B, B), (iv) last group includes cracks initiated near the PMZ (Figures A, A, A, A,B,C,D,E). Therefore the solidification cracks in these groups were mainly initialed due to irregular weld geometry, pores and BM defects since the laser heat input were constant [ 36]. At 0.3 and 0.4 mm gap size the crack length was reduced significantly since they had less porosity and defects in the crown and root areas. 53


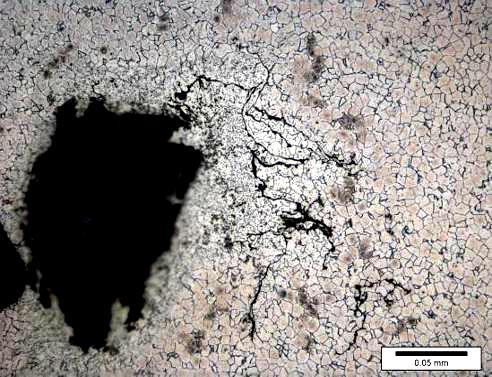
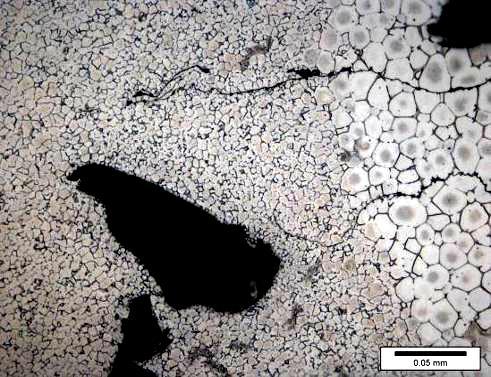
67 A B Figure Solidification Cracks in The Sample Welded at 0.1 mm gap Middle Section C A B Figure Solidification Cracks in The Sample Welded at 0.2 mm gap Middle Section 54


68 A B Figure Solidification Cracks in the Sample Welded at 0.3 mm gap End Section C A B Figure Solidification Cracks in the Sample Welded at 0.4 mm gap End Section 55


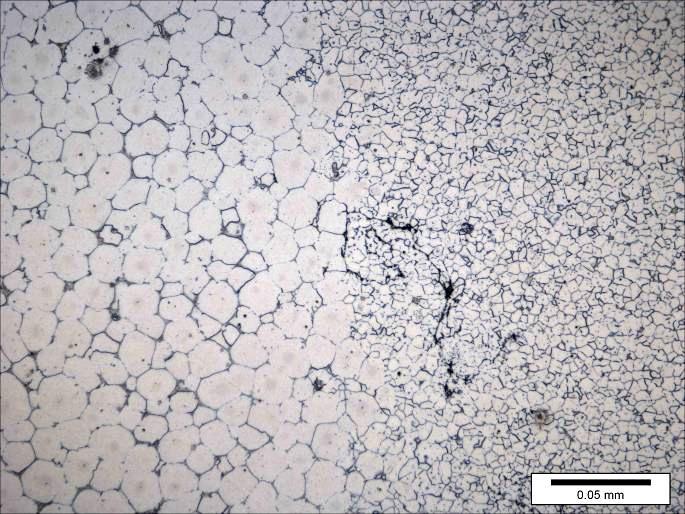
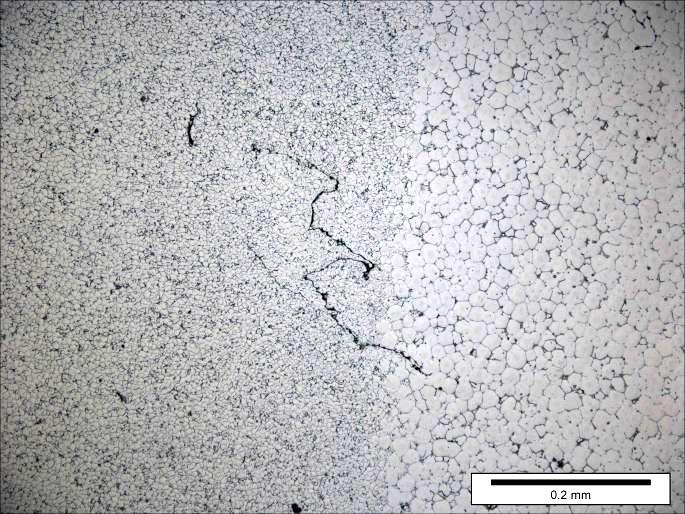
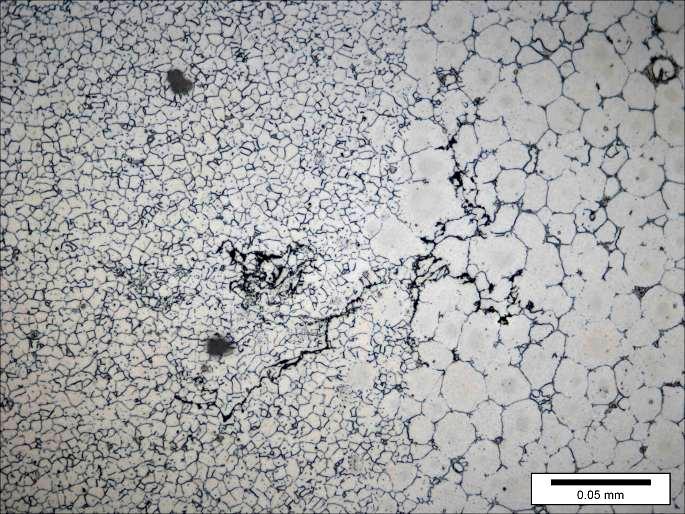
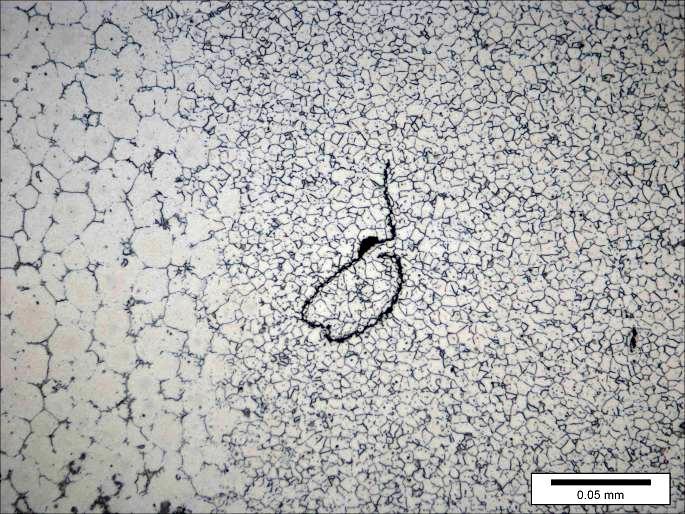
69 A A B C D B C D E Figure Solidification Cracks in the Sample Welded at 0.5 mm gap Start Section 56


70 A B C Figure Solidification Cracks in the Sample Welded at 0.6 mm gap End Section Micro-Indentation Hardness The hardness profiles for different gap sizes are shown in Figure These samples were tested after a natural aging of 18 months, therefore the FZ hardness was recovered to the BM values [ 37] except the one welded with 0.6 mm gap which showed higher hardness at the FZ. There was no significant change in the FZ hardness due the variation in the gap sizes as shown in Table The HAZ shows a decrease in the hardness by 3 to 5 HV compared with BM, with a typical width between 1.5 and 2 mm for all gap sizes. 57
71 HV hardness HV hardness HV hardness HV hardness HV hardness HV hardness mm Gap Size FZ HAZ HAZ Position (mm) mm Gap Size FZ HAZ HAZ Position (mm) mm Gap Size FZ HAZ HAZ Position (mm) mm Gap Size FZ HAZ HAZ Position (mm) mm Gap Size FZ HAZ HAZ Position (mm) mm Gap Size FZ HAZ HAZ Position (mm) half section only Figure Effect of Gap size on Hardness Profile 58
72 Gap Size Average Hardness in the FZ Table Effect of Gap Size on the Average Hardness Measured in the Center Line of the FZ 59
73 4.3 Effect of laser power on weldability of 2 mm plates The plates were laser welded using a welding speed of 6 m/min (section 4.1), 0.4 mm gap size (section 4.2), surface defocusing and with varying laser power as shown in Table Sample Gap Size Laser Power Welding Speed Wire feeding rate Defocusing # mm kw m/min m/min mm Table : Key experiments / effect of laser power on the weldability Weld Geometry The effect of laser power on joint width, height and weld area are shown in Figure and The FZ geometry changed from partial to full penetration also the keyhole changed from closed (blind) to open profile at root when the laser power increased from 2.5 to 4 kw. The sample welded at 2.5 kw showed a partial penetration FZ as a result of partial closed keyhole, and the width of the root was smaller than the top weld width. As the power increased to 2.75 kw, full penetrated joints were obtained but the keyhole was unstable because of the fluctuation between open (start and middle section) and close ( section) at the root. The increase in penetration depth in the sample welded at 2.75 kw caused the increase in the FZ area. At 3 kw laser power there was a drop in FZ area as a consequence of the change in the keyhole profile from closed to open mode. This change from closed to open keyhole caused to reduce the energy coupling efficiency 60
74 Joint Size (mm) Area (mm2) between the laser beam and Mg plate because of the increase in laser losses at the keyhole root and the reduction in the multiple reflections inside the keyhole. The hourglass FZ profile started to form at 3.5 kw but with underfill and shrinkage groove at the root. The increase in laser power to 3.5 kw caused an increase in the root width and as a consequence of that it caused an increase in the laser beam losses at the root which caused more decrease in the FZ area. For the samples welded at 3.75 and 4 kw, the FZ area increased proportionally with the increase in laser power since the heat gain was larger than the loss of laser power at the root. This variation in melting efficiency of laser welding process and the corresponding variation in weld geometry during the change from partial to full penetration passing through the transitional region from blind to open keyhole was also reported by Krasnoperov et al. [ 38]. Smooth profiles at the top and root, with uniform hourglass shapes were observed as the laser power was higher than 3.5 kw Total Depth Average weld width Root Height Crown Height Total FZ area Middle area Root area Crown area Laser Power (kw) Laser Power (kw) Figure Effect of Laser power on (a) joint size and (b) weld area. 61
75 Laser Power (kw) Figure Effect of Laser Power on Weld Geometry Sectional Position End Middle Start 62
76 4.3.2 Microstructure The fusion zone microstructure was observed to be fine equiaxed grains as shown in Figures and The partial melting zone (PMZ) was narrow for all samples. It was difficult to distinguish the difference in microstructure between the HAZ and base metal because grain coarsening was not observed in the HAZ. Figure shows that the FZ grain size varies as a result varying the laser power. As discussed earlier, different laser power values result in different laser coupling efficiencies which, according to [39], affect the amount of heat available for the work piece. However, not all the absorbed heat by the keyhole will be available for melting since portion of the absorbed heat will be lost through the BM. In this case, the weld pool size will mainly dep on the process efficiency (melting efficiency); the higher the melting power the larger the weld pool will be. Due to this variation in coupling efficiency, the cooling rates were different in these samples. The sample which exhibited higher absorbed melting power or larger FZ area would have lower cooling rate due to the increase in the mass of the molten metal (larger weld pool). The lower cooling rate would have caused longer time for the grains to grow. This behavior can be seen in Figure 4.3.4, the grain size increased as the laser power increased from 2.5 to 2.75 kw because of the increase in laser coupling efficiency and melting efficiency, whereas the sample welded at 3.5 kw showed a decrease in the grain size although there was an increase in laser heat input. This is attributed to the decrease in the coupling and the corresponding melting efficiencies due to laser beam losses at the root and to the reduction in the multiple reflections of the laser beam inside the keyhole. 63


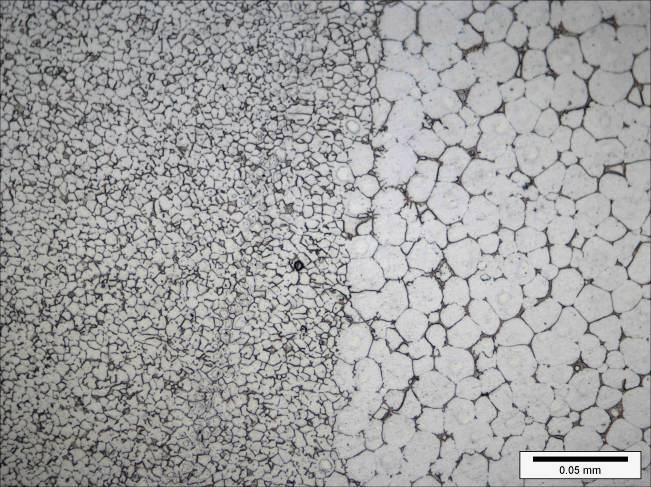
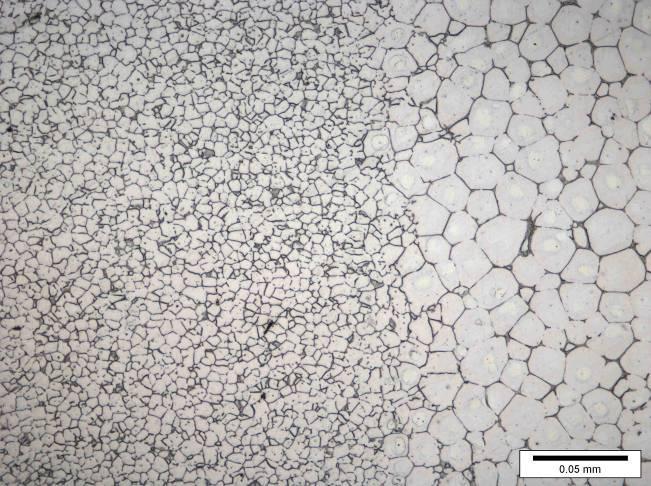
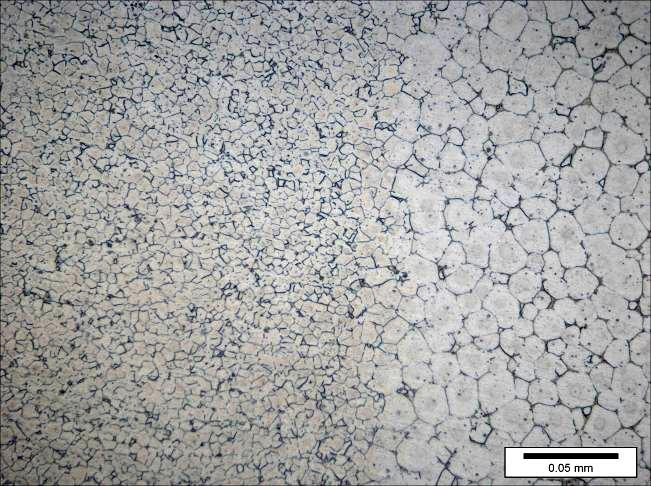
77 2.5 kw 2.75 kw 3 kw 3.5 kw 3.75 kw 4 kw Figure Micrographs Showing the FZ, PMZ and HAZ. 64


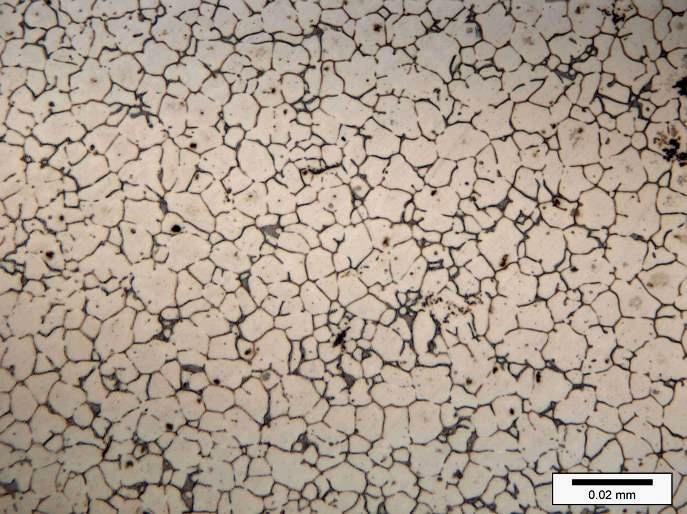
78 2.5 kw 2.75 kw 3 kw 3.5 kw 3.75 kw 4 kw Figure Effect of laser power on the FZ microstructure 65
79 Porosity % Number of Micro Pores Number of Pores Porosity The relationship between porosity area percentage and number of pores with the laser power is shown in Figure The porosity area percentage decreased from 3.4% to 0.27% as laser power reached 3 kw. Large pores were observed in the samples welded at 2.5 and 2.75 kw as shown in Figure As described earlier these two samples had a fluctuation between full and partial penetration as a consequence of low laser power density. When close keyhole mode occurs, the vapor had only one way to escape from the FZ which was the top keyhole opening [ 38], and because of that the expanded pores had to travel all the way to the top. The high welding speed caused an entrapment of the pores during this floating time. When the power reached to 3 kw, the keyhole became open at the root which resulted in having another escaping way for the vapor, and that significantly reduced the porosity. Figures shows the average pores size distribution for all samples. It can be seen that the majority of pores were smaller than 75 µm, with typical size about 15 µm Laser Power (kw) Figure Effect of power on Porosity. Porosity % Number of Pores Laser Power 2.5 kw Laser Power = 2.75 kw Laser Power = 3 kw Laser Power = 3.5 kw Laser Power = 3.75 kw Laser Power = 4 kw above Range of Pore Size (micron) Figure Porosity Distribution 66
80 4.2.4 Crack Formation The maximum total crack length in the fusion zone was 2.17 mm (for the sample welded at 3.75 kw power), and the maximum average width was 1.4 µm (for the sample welded at 2.5 kw). The minimum solidification crack was observed for the sample welded at 4 kw as shown in Figure In general, the solidification cracks can be reduced by applying less heat input as observed earlier when discussing the effect of welding speed. It is known that, the laser heat input or laser fluence can be reduced either by increasing the welding speed or decreasing the laser power. The general observation from Figure is that the crack length increased by increasing the laser power and the peak crack length was reached at laser power equal to 3.75 kw. Laser fluence of 89 J/mm 2 seems to be suitable to weld the 2 mm plate at 6 m/min which produced the minimum crack length. Abbaschian and Lima [ 36] reported that cracking susceptibility of Al alloys was mainly affected by the welding speed; the higher the welding speed the lower susceptibility for cracking. Whereas the effect of laser power showed different behavior than the welding speed; at low welding speed, the decrease in laser power led to decrease in cracking susceptibility, but at high welding speed the laser power showed opposite behavior. The crack defects for selective samples are shown in Figures to It is noticed in Figure (B and D) that the microstructure around the crack was different than the regular grain morphology in the FZ. 67
81 Crack Length (mm) Number of Cracks Laser Fluence (J/mm 2 ) Laser Power (kw) Crack Length Number of Cracks Figure Effect of Laser Power on Crack Length and Number of Solidification Cracks in the FZ. 68


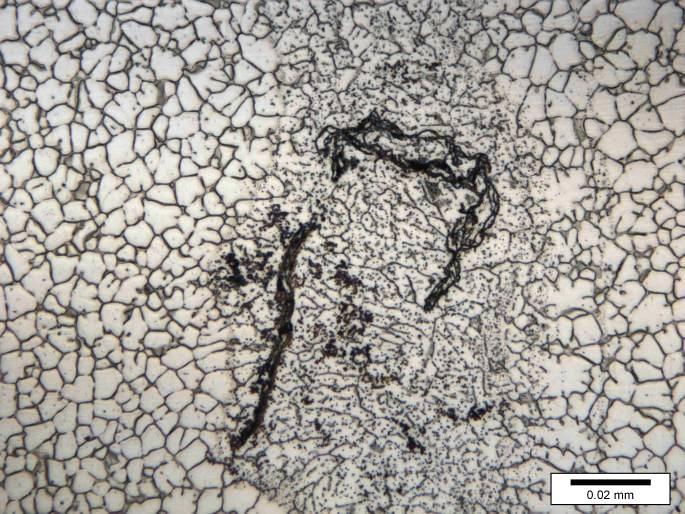
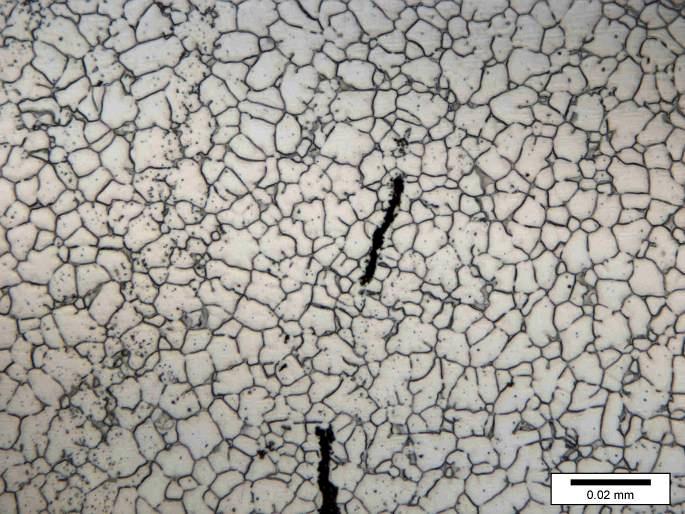
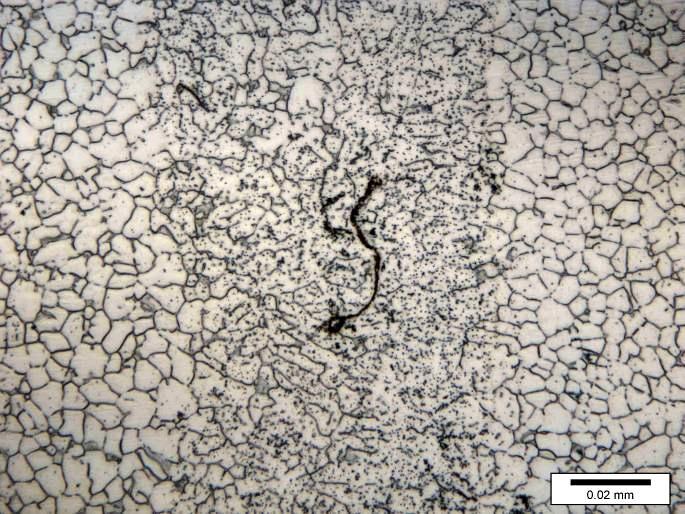
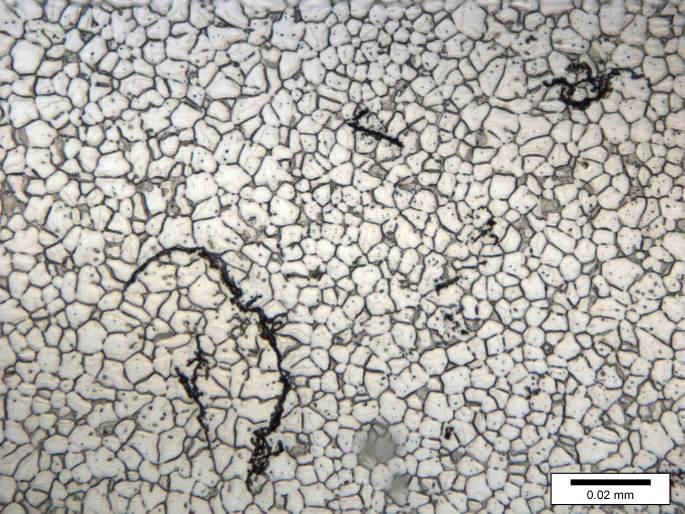
82 A A B D C E B C D E Figure Solidification Cracks in The Sample Welded at 2.75 kw Ending Section 69


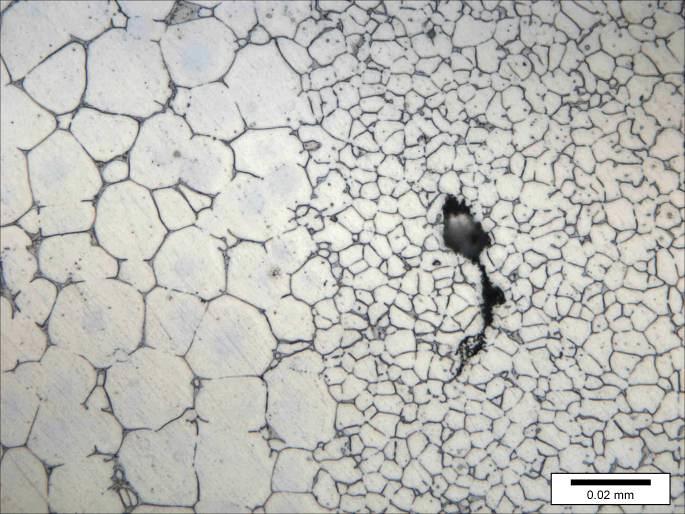
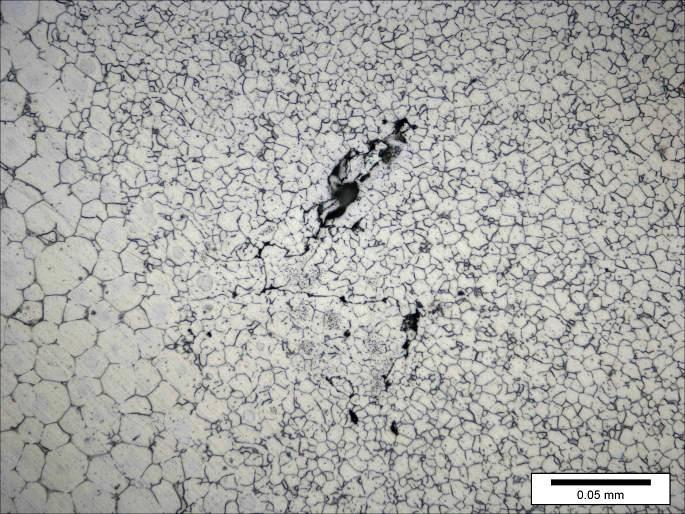
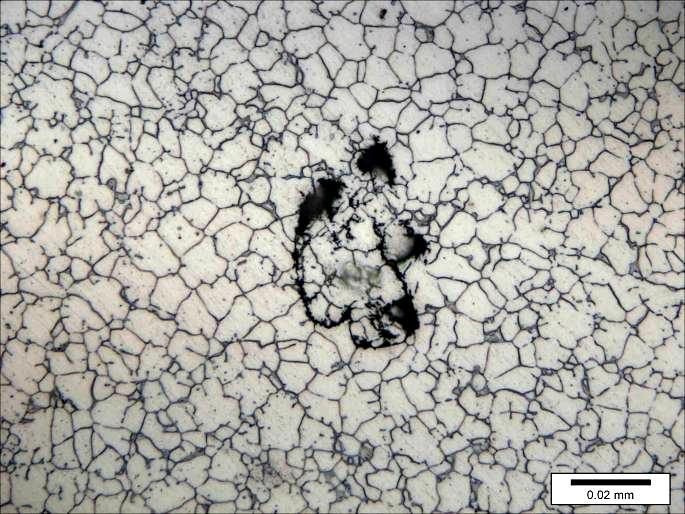
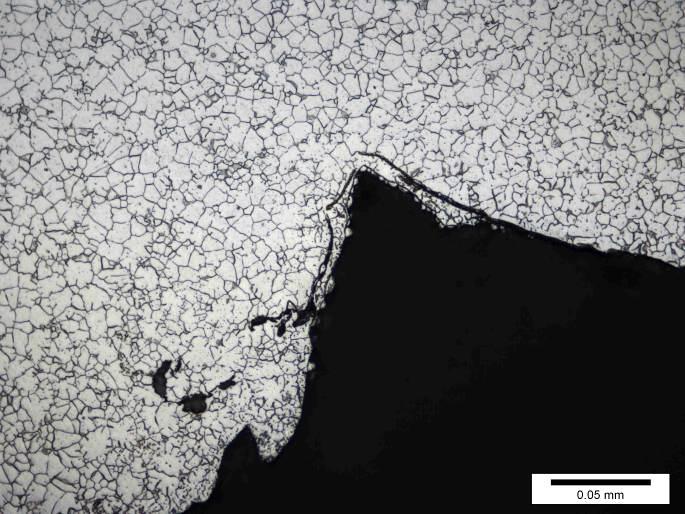
83 A A B C E D B C D E Figure Solidification Cracks in the Sample Welded at 3 kw Middle Section 70


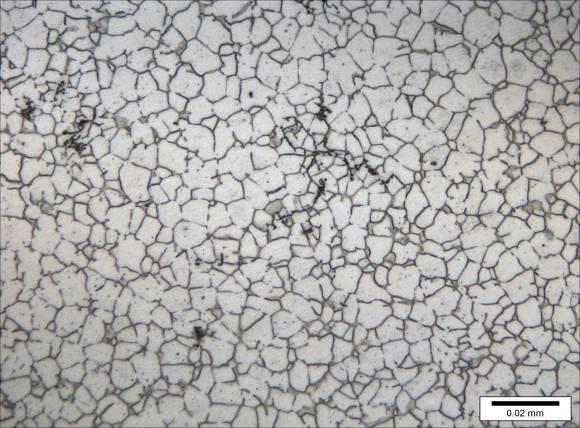
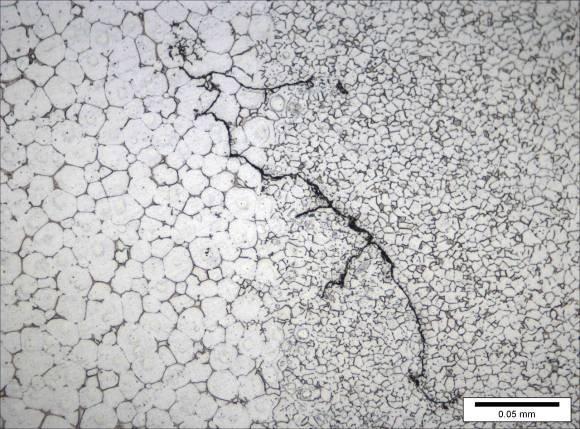
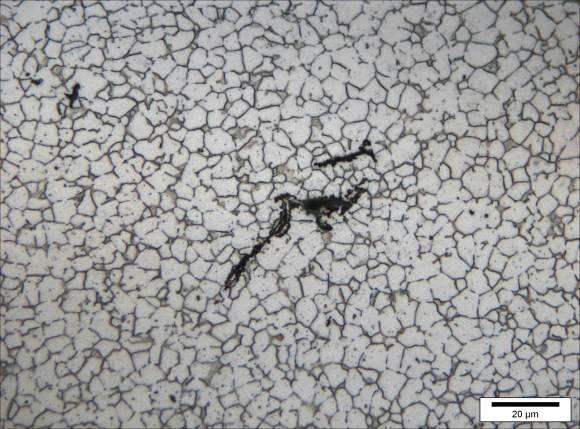
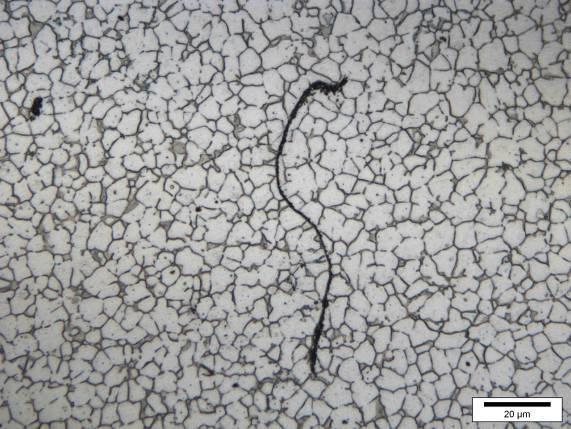
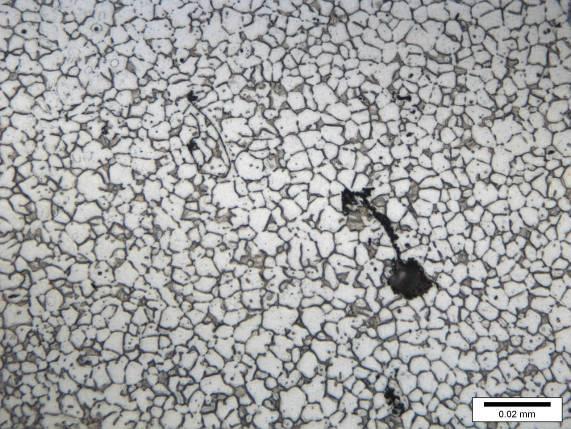
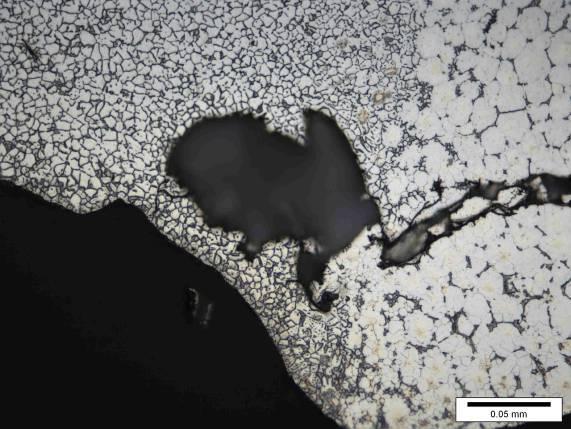
84 A C D E A B F G B C D E R F G Figure Solidification Cracks in the Sample Welded at 3.5 kw Start Section 71

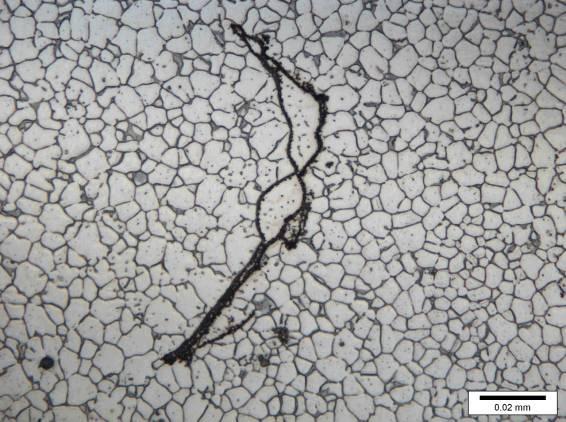
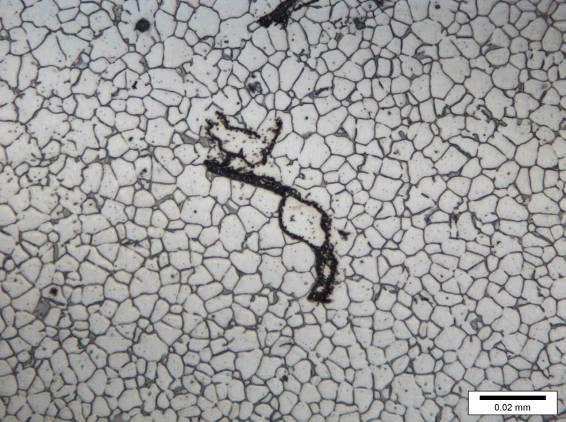
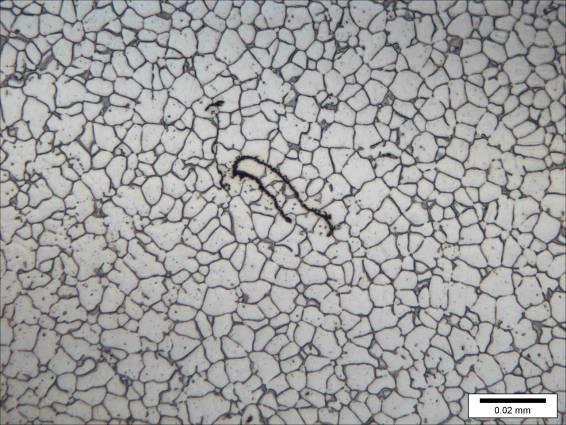
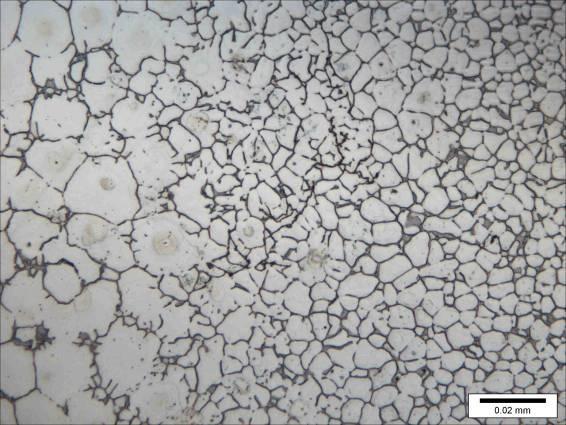
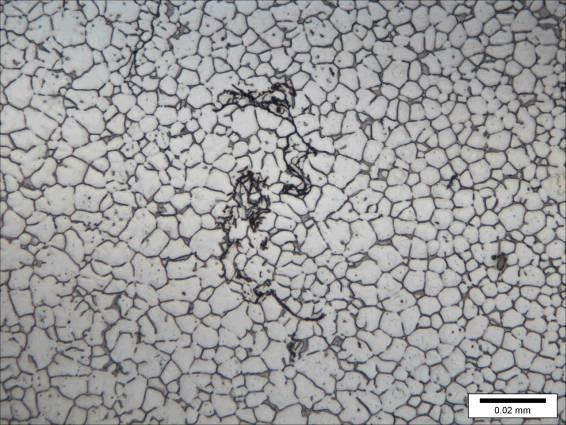
85 Figure Solidification Cracks in the Sample Welded at 3.75 kw Start Section / Part -1 72


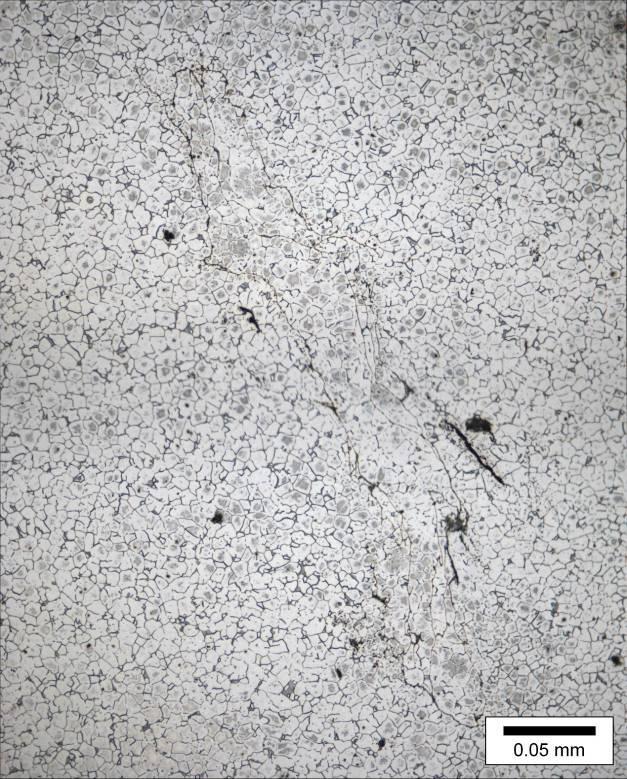
86 Figure Solidification Cracks in the Sample Welded at 3.75 kw Start Section / Part -2 Figure Solidification Cracks in the Sample Welded at 4 kw Ending Section 73
87 4.3.5 Micro-Indentation Hardness Figure shows the effect of laser power on hardness profile for the welded joints. Vickers microindentation hardness was measured after a natural aging over a period of approximately 18 months after the welding. Most of the samples showed a recovery in the hardness values in the fusion zone which became comparable with those in the base metal. However, there was a drop in the hardness in the heat affected zone. The width of the heat affected zone as indicated in Figure was between 1.5 and 2 mm. As the laser power increased from 2.5 to 4 kw the average hardness value in the FZ fluctuated within 6 HV as indicated in Table and Figure The purpose of showing the middle FZ area in Figure is to locate the transition zone between blind to open keyhole and also to give an indication of the weld pool size. The hardness decreased as the profile of the keyhole was changing from blind to open keyhole, whereas the hardness increased as the keyhole became open at the root. The hardness variation deps on the variation in the grain size which is function of the cooling rate inside the weld pool as discussed in section
88 HV hardness HV hardness HV hardness HV hardness HV hardness HV hardness Laser Power = 2.5 kw FZ HAZ HAZ Position (mm) Laser Power = 2.75 kw FZ HAZ HAZ Position (mm) Laser Power = 3 kw FZ HAZ HAZ Position (mm) Laser Power = 3.5 kw FZ HAZ HAZ Position (mm) Laser Power = 3.75 kw FZ HAZ HAZ Position (mm) Laser Power = 4 kw FZ HAZ HAZ Position (mm) Figure Effect of Laser Power on Hardness Profile 75
89 FZ Average Vickers Hardness Middle FZ Area (mm 2 ) Table Effect of Laser Power on the Average Hardness Measured on the Center Line of the FZ Laser Power ( kw ) Average Hardness in the FZ Blind Keyhole Area Blind - Open Keyhole Hardness Open Keyhole {56} {67} {78} {89} Laser Power (kw) or {Laser Fluence J/mm 2 } Figure Effect of Laser Power on the Average Hardness Measured on the Center Line of the FZ 76
90 4.4 Repeatability of Laser Welding Process From the previous sections (4.1, 4.2, and 4.3), it was found that the laser parameters that produced sound welds for the 2 mm ZE41A-T5 butt joints using EZ33A-T5 filler wire are as follows: 1. Laser Power = 4 kw 2. Welding Speed = 6 m/min 3. Gap Size = 0.4 mm 4. Defocusing = 0 mm These optimized parameters were used to check the repeatability of laser welding process using the same alloy and filler wire but with better BM quality that has less casting defects in comparison with the BM plates used for samples 1 to 16. The use of better quality BM reduces the influence of BM defects on the quality of welded joints Weld Geometry Eight 2 mm plates were welded using the optimized process parameters, and the three cross sectional specimens (start, middle and ) for each joint are shown in Figure Most of the samples showed smooth profile on the top and root. Little porosity was observed for all the samples. However, misalignments defects occurred in some joints such as sample 22 and 23. Sag (drop through) defects were observed in joints 17 and 18 due to the inaccurate feed rate which was calculated based on the nominal filler diameter. Actual filler diameter was measured to recalculate the wire feed rate which led to reduced or eliminated sag defects for the rest of the samples. In this aspect, butt joint 77


91 Sample # Figure repeatability of Laser Welding Process for 2 mm Plate Sectional Position End Middle Start 78
92 Frequency Frequency configuration filler feed rate and accurate position of the filler wire were very important parameters to obtain repeatable weld geometry. Samples 23 and 24 Samples 23 and a) Distribution of Weld Bead Width (mm) b) Distribution of Total FZ Area (mm 2 ) Figure Repeatability of FZ Weld Geometry (a) Distribution of Weld Bead Width (b) Distribution of Total FZ Area Figure shows the distribution of the weld bead width and total FZ area for samples It is found that that samples 23 and 24 have significant deviations from other joints, probably as a result of misalignments defects and also due to the inaccurate sample preparation prior to laser welding process. The bead weld width and the total FZ area for the rest of the samples varies from 1.68 to 1.90 mm, and 2.74 to 3.66 mm 2, respectively. Weibull distribution (for more information refer to appix A.2) was used to describe the degree of the scatter represented by Weibull modulus (m) and to determine the characteristic weld bead width and FZ area, which approximately 63.2% of the population (examined sections) can record this value. The cumulative plots of weld bead width and total FZ area are shown in Figure Samples 23 and 24 were excluded from this evaluation since they showed 79
93 ln(ln(1/(1-pf))) ln(ln(1/(1-pf))) Probability Probability deviations from all other sections. The corresponding Weibull plots for the weld bead width and total FZ area are shown in Figure Weld Bead Width (mm) a) b) Figure Cumulative Probability Plots for (a) Weld Bead Width (b) Total FZ Area Total FZ Area (mm 2 ) y = x y = x R 2 = R 1 = ln(bead Width) ln(fz Area) a) b) Figure Weibull Plots for (a) Weld Bead Width (b) Total FZ Area From Figure the Weibull modulus for the weld bead width (top width) and total FZ area are and 16.63, respectively. The characteristic weld bead width and FZ area that 63.2 % of the examined sectioned were recorded values of 1.81 mm and 3.23 mm 2 respectively. The Weibeull modulus (m) for the weld bead width was higher than 80
94 that for the total FZ area, which means the scattering in the FZ area values was higher than in the bead width. The high m value for the bead width shows that weld bead width has good repeatability. The profile of the FZ geometry was affected by the interaction between the laser beam and the vapor liquid interface and the variation in the thermo physical properties of the BM like thermal conductivity, thermocapillary flow of the molten metal [40] Microstructure The fine equiaxed grains were observed in the FZ for samples as shown in Figure This Figure also shows that the microstructure appears to be slightly different for the last two samples 23 and 24 which had similar discrepancies in weld geometry compared with all other samples. The change in the microstructure in these two samples again may be correlated to the errors in sample preparation such as the gap size or filler positioning which may have affected the cooling rate and the temperature distribution inside the FZ. The PMZ and the HAZ for the repeated samples can be seen in Figure It is clear that the HAZ exhibited a significant liquation of some grain boundary near the PMZ which was not found during the laser welding of the casting used in the first round of experiments (refer to Figures 4.1.3, 4.2.3, 4.3.3). 81


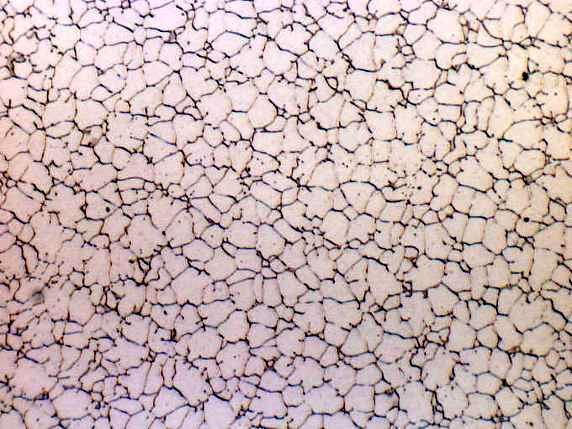
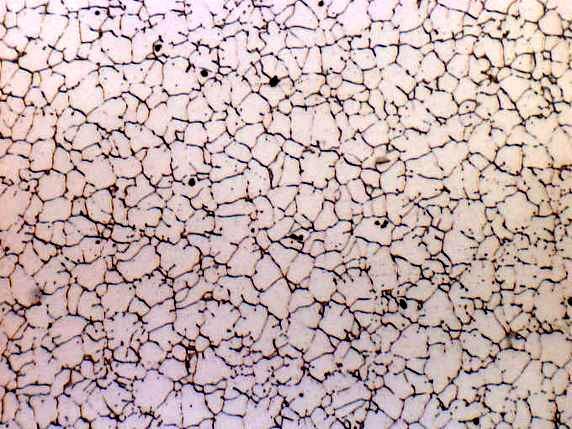
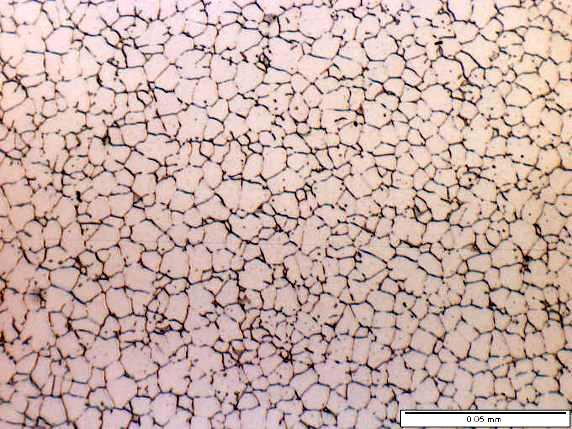
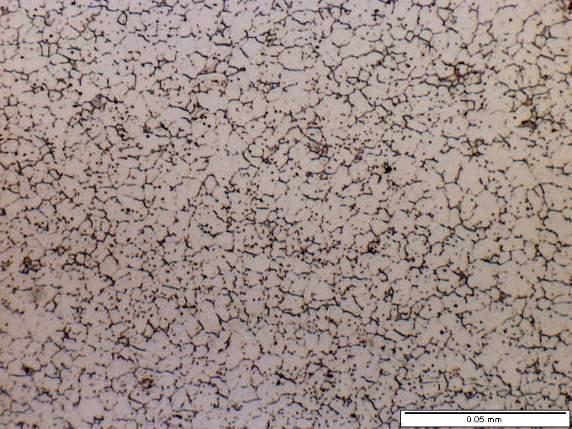
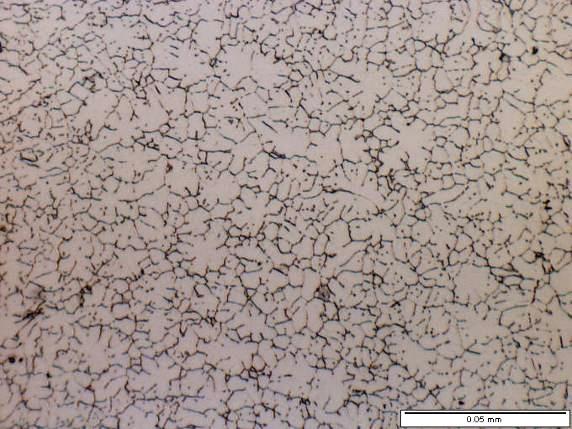
95 #17 #18 #19 #20 #21 #22 #23 #24 Figure FZ Microstructure for the Repeated Samples 82


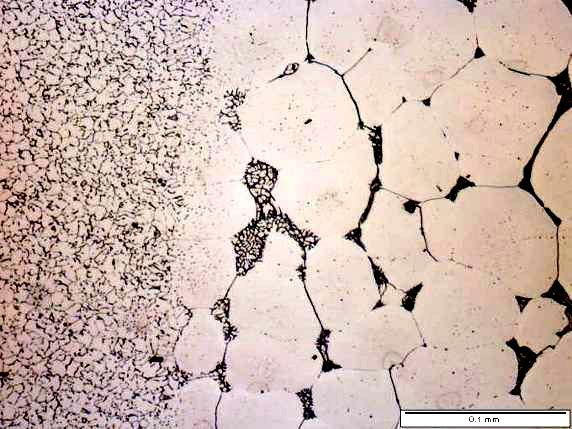

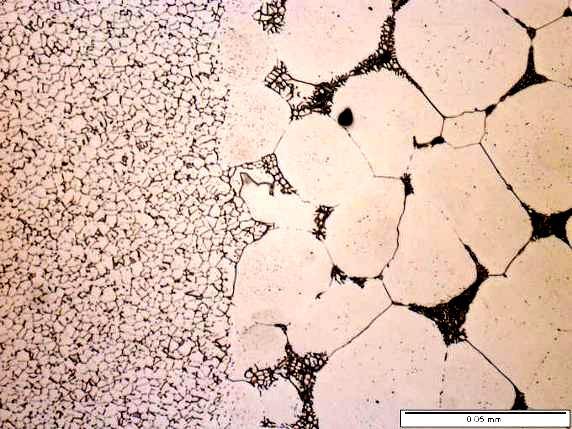
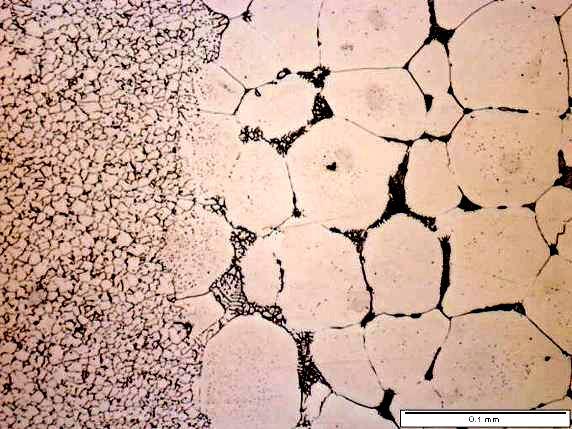
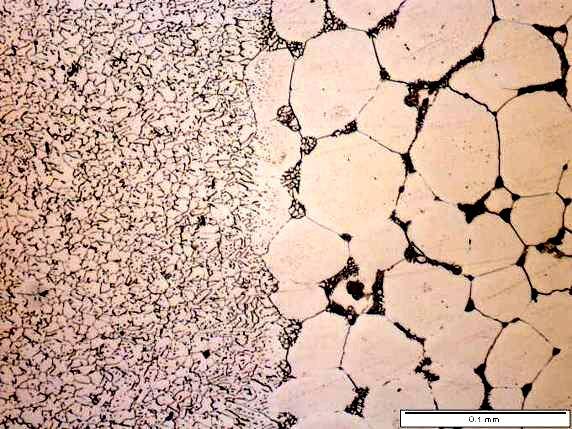
96 #17 #18 #19 #20 #21 #22 #23 #24 Figure Micrographs Showing the PMZ for the Repeated Laser Welded Samples. 83
97 Frequency Frequency Defects The distribution of porosity area percentage and FZ solidification cracks for samples are shown in Figure From this Figure it is obvious that the crack is neither Weibull nor normal distribution which may affect this assessment. The maximum porosity area percentage and the maximum solidification cracks observed among the 24 tested samples were 0.27 % and 0.41 mm, respectively. To evaluate the degree of scattering in the defects, Weibull distribution was used to calculate the Weibull modulus (m) and the characteristic values for the porosity % and the crack length Distribution of Porosity % a) b) Distribution of Cracks (mm) Figure Defects Distribution for the Repeated Laser Welded Samples a) Porosity Area Percentage b) Solidification Cracks Length The cumulative plot and the corresponding Weibull plots for the porosity area percentage and solidification crack length are shown Figures and 4.4.9, respectively. Referring to Figure the maximum porosity area percentage and crack length were very low. From Figure the Weibull modulus for the porosity area percentage and FZ solidification crack length area are 2.81 and 1.9 respectively. The characteristic porosity % and solidification crack length are 0.15% and 0.18 mm, respectively. Both types of defects showed lower m values than that for the weld 84
98 ln(ln(1/(1-pf))) ln(ln(1/(1-pf))) Probability Probability a) Porosity % b) Crack Length (mm) Figure Cumulative Plot of (a) Porosity Area Percentage (b) FZ Solidification Crack Length y = x R 2 = a) ln(porosity%) b) y = x R 2 = ln(crack Length) Figure Weibull Plots Obtained From (a) Porosity Area Percentage (b) FZ Solidification Crack Length geometry, indicating more scattering in the defects measurements may be caused by many factors. Furthermore, the effect of the scattering in the defects measurements on the repeatability of the tensile properties measurements will be verified in the next section. 85
99 4.4.4 Mechanical Properties To study the mechanical properties of the repeated samples, the specimens were divided into two groups: the first group was tested in the as-welded condition and the other was tested after T5 heat treatment (at 329 o C for 2 hr) which is an artificial aging heat treatment used for alloy ZE41A-T5 to produce a precipitating hardening phase Mg 9 Ce. The microhardness profiles for the welded samples in the as welded and heat treated conditions are shown in Figure and , respectively. In both cases the FZ showed a drop in hardness by 5 Hv and the effect of heat treatment on the hardness profile was insignificant. The HAZ width was in the range between 1.5 and 2 mm, with a variation in hardness between 65 and 70 Hv. Table shows the average hardness in the center line of the FZ. The Weibull distribution was used to evaluate the repeatability of the hardness in the FZ for as welded and heat treated conditions as shown in Figure Both cases show a high Weibull modulus, 39 for as welded condition and 67.8 for heat treated conditions. The high m values mean that the hardness results are not very scattered. The heat treated samples show higher m value compared with the as - welded samples. Table shows that the heat treatment resulted in slight increase in the hardness measurements of some samples which resulted in less scattering as can be seen in Figure (a). That means the post weld aging can improve the distribution of the hardness, i.e. more uniform hardness values can be obtained in the FZ. 86
100 HV hardness HV hardness HV hardness HV hardness HV hardness HV hardness HV hardness HV hardness Sample 17 HAZ Position (mm) Sample 19 HAZ FZ FZ HAZ HAZ Position (mm) Sample 21 HAZ FZ Position (mm) Sample 23 HAZ FZ HAZ HAZ Position (mm) Sample 18 HAZ FZ HAZ Position (mm) Sample 20 HAZ FZ HAZ Position (mm) Sample 22 HAZ FZ HAZ Position (mm) Sample 24 HAZ FZ HAZ Position (mm) Figure Microindentation Hardness Test for the Repeated Welded Samples (as -Welded Condition)
101 HV hardness HV hardness HV hardness HV hardness HV hardness HV hardness HV hardness HV hardness Sample 17 HAZ FZ HAZ Position (mm) Sample 19 HAZ FZ HAZ Position (mm) Sample 21 HAZ FZ HAZ Position (mm) Sample 23 HAZ FZ HAZ Position (mm) Sample 18 HAZ FZ HAZ Position (mm) Sample 20 HAZ FZ HAZ Position (mm) Sample 22 HAZ FZ HAZ Position (mm) Sample 24 HAZ FZ HAZ Position (mm) Figure Microindentation Hardness Test for the Repeated Welded Samples (Heat Treated Condition). 88
102 Probability ln(ln(1/(1-pf))) Table Average Vickers Hardness in the Center Line of the FZ for the Repeated Welded Samples Sample Vickers Hardness Vickers Hardness # as welded condition heat treated Heat Treated As Welded y = x R 2 = (Heat Treated Condition) y = x R 2 = (As Welded Condition) a) Average Vickers Hardness b) ln(hardness) Figure Weibull Statistical Analysis for the Average Vickers Hardness Measured in the Center Line of the FZ in the as Welded and Heat Treated Conditions a) Cumulative Plots of Vickers Hardness b) Weibull Plots of Vickers Hardness For tensile tests, maximum numbers of tensile specimens were extracted from the repeated welded samples (17 to 24), which were also divided into two groups: as welded and heat treated conditions. The tensile properties obtained for the two groups are shown in Tables and It was noticed that, the heat treatment caused to have larger number of specimens that fractured in the HAZ PMZ (in the HAZ but near the PMZ) rather than the BM comparing with the as welded condition. The tensile strength distributions are shown Figure which indicates that the trailing profile was longer 89
103 Frequency Frequency in the heat treated condition since more samples failed at lower tensile strength than in the as welded condition. Rank TS (Mpa) El% Failure location BM BM BM BM BM BM PMZ - HAZ BM BM PMZ - HAZ BM BM PMZ - HAZ PMZ - HAZ PMZ - HAZ BM BM PMZ - HAZ PMZ - HAZ PMZ - HAZ BM PMZ - HAZ Table Tensile properties of the repeated welded samples in the as welded condition Rank TS (Mpa) El% Failure location FZ FZ BM BM BM BM BM FZ BM PMZ - HAZ PMZ - HAZ PMZ - HAZ PMZ - HAZ PMZ - HAZ PMZ - HAZ BM PMZ - HAZ HAZ PMZ - HAZ PMZ - HAZ PMZ - HAZ PMZ - HAZ Table Tensile properties of the repeated welded samples in the heat treated condition as - welded condition heated treated condition a) b) TS Range (Mpa) TS Range (Mpa) Figure Tensile Strength Distribution for a) as Welded Condition b) Heat Treated Condition. The distribution profiles of TS results show asymmetry around the mean value. Figure shows the cumulative plot and the Weibull plot for the TS property. The 90
104 Probability of fracture ln(ln(1/(1-pf))) modulus values are 31.1 for the as welded condition and for heat treated condition with corresponding characteristic TS of 219 MPa and 218 MPa, respectively. The heat treatment resulted in more scattered TS values, whereas post weld heat treatment improved the uniform distribution of the hardness in the FZ. For ceramics the range of Weibull modulus varies from 5 to 20 reflecting the brittleness of the material [ 42]. In general the range of Weibull modulus for the TS property for casting alloys is between 10 and 40 [56]. For example, it was reported that the TS property for Mg alloy AZ91E has a Weibull modulus of 29.3 and 44, respectively for the alloy produced by low pressure lost foam and sand casting methods which both confirmed a narrow distribution [ 41]. Here, the welded specimens with m values of 31.1 and for as welded and heat treated conditions, respectively show similar repeatability and reliability with good casting quality. The Weibull modulus for elongation can be inferred from Figure (b). The m value is 3.4 for the as welded condition with characteristic elongation of 5.93%, and 3.3 for the heat treated condition with characteristic elongation of 6.99%. The characteristic elongation and cumulative chart (Figure a) show that heat treated specimens exhibited more ductility than those tested in the as welded condition as welded heat treated base metal a) TS (MPa) y = x R 2 = (Heat Treated Condition) y = x R2 = (As Welded Condition) Base Metal b) ln(ts) Figure Weibull Statistical Analysis for Tensile Strength a) Cumulative Plots of Tensile Strength b) Weibull Plots of Tensile Strength
105 Probability of fracture ln(ln(1/(1-pf))) a) heat treated as welded El% y = x R 2 = (As Welded Condition) Figure Weibull Statistical Analysis for Elongation a) Cumulative Plots of Elongation b) Weibull Plots of Elongation b) y = x R 2 = (Heat Treated Condition) ln(el%) Summary of Repeatability Table summarizes the repeatability of laser welding process. As mentioned earlier a Weibull modulus between 10 and 40 is usually considered a reliable mechanical properties of castings. Therefore, TS, hardness, weld width and FZ area are considered to have good repeatability in laser welding process. The defects data show less repeatability as indicated by the low m value which may be attributed to the high sensitivity of the porosity and crack formation to the process variables and the formation of these defects are dominated by many factors. However, the high value of m for tensile strength property shows that the defects in the tested samples were in the same level [ 41, 42]. The elongation also shows less reliability since a small deviation in the fracture or tensile strength leads to large change in fracture elongation due to small strain harndening coefficient of the investigated alloy as indicated in Figure The calculated joint efficiencies for 2 mm laser welded plates using the optimized parameters are 93 and 91.7 % for as welded and heat treated conditions, respectively. The joint efficiency for each condition was calculated by taking the average TS of the 92
106 Stress MPa Stress MPa welded specimens divided by the TS of the BM (for this good quality of casting, 232 MPa. Refer to Table 4.5.5). Table Reliability Assessment for the Repeatability of Laser Welding Process Investigating Parameters for Laser Welding Process Weld geometry / bead weld width Weld geometry / total FZ area Defects / porosity area percentage Defects / solidification crack length Mechanical properties / FZ hardness Mechanical properties / Tensile strength Mechanical properties / Fracture Elongation Weibull Modulus - m as welded heat treated Fracture at BM (7.8 mm from the center of the FZ ) Fracture at FZ a) Strain b) Strain Figure Mechanical Tensile Properties / Stress Strain Curve for sample # 19 a) as Welded Condition b) Heat Treated Condition. 93
107 4.5 Laser Welding of Thick Plates (6 mm thickness) Table lists the parameters used in laser welding of 6 mm thick plates. The procedure was divided into three main steps: 1. Optimizing the defocusing distance to get a good surface morphology (samples 25, 26, and 27). Bead-on-plate laser welding has been used for this purpose and the surface morphology was examined using stereoscope. 2. Optimizing the welding speed to get full penetrated autogenous (without filler wire) laser welded joints, samples 28 and Optimizing the welding speed and gap size to get full penetration laser welded 6 mm thick plates using filler wire (samples 30, 31, 32, 33). The corresponding FZ geometries for 6 mm laser welded samples are shown in Figure Table Parameters Used in the Laser Welding of 6 mm Thick Plates Sample Gap Size Laser Power Welding Speed Wire feeding rate Defocusing # mm kw m/min m/min mm


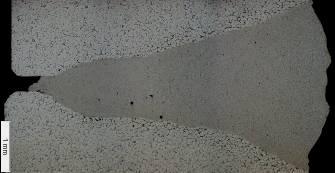
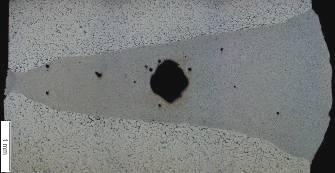
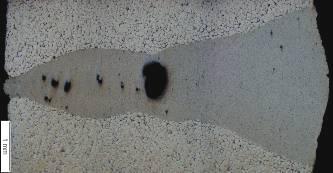
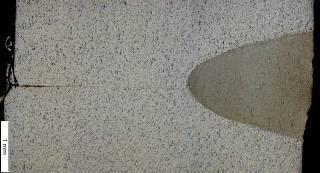
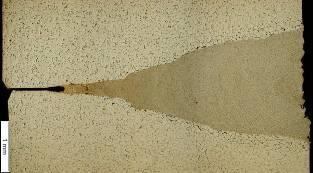

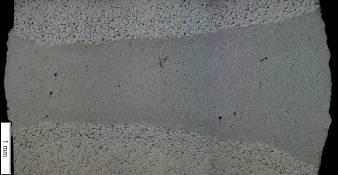
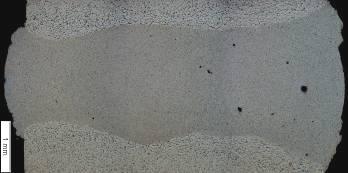
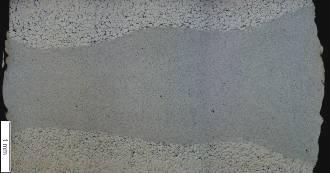
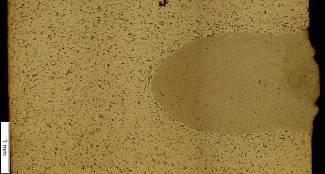
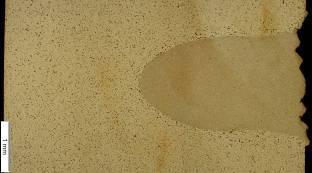
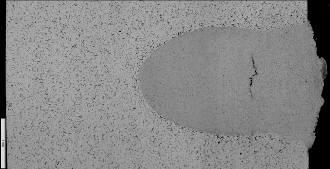
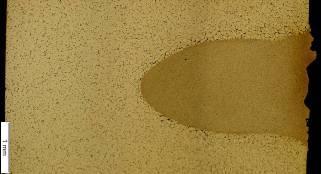
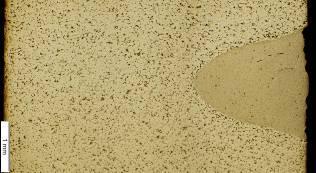
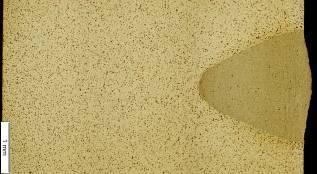
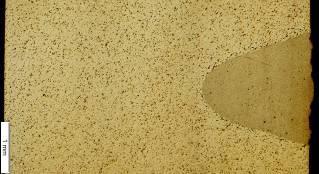
108 Sample # Figure Laser Welding of 6 mm Thick Plate. Sectional Position End Middle Start 95
109 Joint Size (mm) Area (mm 2 ) Weld Geometry The bead-on-plate welded samples were used to optimize the defocusing of the laser beam from 0 to -4 mm based on surface quality (the minus sign means the focal point of the laser beam was below the plate surface). The effect of defocusing distance on the joint size is shown in Figure The surface morphologies for samples are shown in Figure (A, B). 4 3 Total Depth Average weld width Crown Height 8 6 Total FZ area Middle area Crown area a) Defocusing (mm) -5-6 Figure Effect of Defocusing on Weld Geometry a) Joint size b) FZ Area. The welding Parameters are 4 kw Power and 5 m/min Welding Speed. Poor top weld surface was obtained for 0 and -2 mm defocusing (samples 25 and 26) as shown in Figure 4.5.3(A). The high power density obtained at 0 and -2 mm defocusing caused high vaporization and turbulent flow of the metal in weld pool which worsened the quality of weld surface. At -4 mm defocusing (sample 27 33), a smooth crown profile without major defects was obtained. Figures and indicate that the penetration depth increased slightly as the defocusing increased from 0 to -2 mm. When the defocusing reached to -4 mm, the penetration depth was decreased significantly to 2.2 mm. Similar behavior were also observed for the total FZ area. This observation can be 0 0 b) Defocusing (mm) -6 96


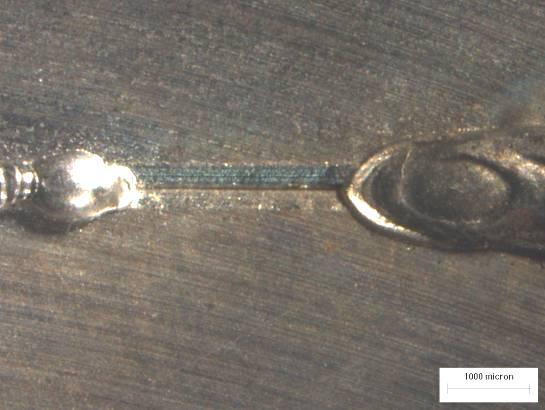
110 Sample# 25 - top Sample# 26 - top Sample# 27 - top Sample# 28 - top Sample# 29 - top Sample# 29 - bottom Sample# 30 top Sample# 30 bottom Figure (A) Top and Bottom Surface Morphology for Laser Welded 6 mm Plates. 97

 Top and Bottom Surface Morphology for")


111 Sample# 31 - bottom Sample# 31 top Sample# 32 -top Sample# 32 - bottom Sample# 33 top Sample# 33 - bottom Figure (B) Top and Bottom Surface Morphology for Laser Welded 6 mm Plates. explained as follows: the maximum intensity of laser beam is located in the focal point, and the peak intensity falls down as moving below or above the focal point. The effective intensities of the laser beam are located within +/- Rayleigh length (here in this setup it is equal to 2.34 mm); at a distance equal to +/- one Rayleigh length from the focal plane, 98
112 the peak intensity drops to one half the peak intensity at the focal plane [ 43]. Therefore when the defocusing distance increased from 0 to -2 mm, the effective intensities were located inside the material (plate) which increased the coupling efficiency between the laser beam and the plate, but in the same time the laser intensity available on the top surface was reduced because of the increase in laser beam diameter. The further increase in defocusing distance to -4 mm led to have the available surface intensity below or equal to the threshold value which was required to produce the keyhole [ 39, 43]. Therefore the laser welding process changed from the keyhole mode (samples 25, 26) to the conduction mode (sample 27) since the aspect ratio (depth / top width) for keyhole mode should be greater than 1.2 [ 26, 44]. At -4 defocusing the calculated surface power density was 1.6 x 10 6 W/cm 2 which is slightly higher than the published value for the keyhole threshold irradiance (1.5 x 10 6 W/cm 2 ) for the same alloy with machined surface condition [ 26]. At -4 mm defocusing distance the power density was near the threshold value but good surface quality was obtained. Thus this value (-4 mm defocusing) was used for follows tests. The defocusing distance of -4 mm for sample 27 has been used to weld the butt joint autogenously (without filler wire). The autogenous welding was conducted to compare the effect of filler wire on the laser coupling efficiency and weld quality. Figure shows that sample 28 (butt joint at zero gap) and 27 (Bead-on-plate) had almost the same FZ geometry in the start and middle sections; the start and middle sections exhibited a conduction mode welding whereas the ing section showed a keyhole mode welding. This confirms that the surface laser intensity was near the keyhole threshold value as mentioned earlier. To change the welding mode from conduction to keyhole and 99
113 to increase the penetration depth, it was required to decrease the welding speed below 5 m/min since the Nd:YAG laser power was limited up to 4 kw power and the defocusing was fixed at -4 mm as described above. It was found that 3 m/min welding speed was suitable to get a full penetrated joint (sample 29) and good surface morphology for top and under bead was obtained as shown in Figure (A). It is interesting to find that in the middle of the FZ geometry ts to be widened probably due to the multiple reflections and plasma absorption inside the keyhole. The multiple reflections can increase the coupling efficiency and increase the amount of molten material [ 38]. The optimum gap size found in section (4.2) was 0.4 mm to weld 2 mm thin plate using 1.6 mm filler wire. Here 0.2 and 0.4 mm gap sizes were used to weld the 6 mm plates with the same filler wire. Sample 30 was welded by applying a filler wire with 0.2 mm gap, other laser parameters except the feeding rate were the same as sample 29. Sample 30 encountered a fluctuation between full penetration and partial penetration welding as shown in the surface morphology of the bottom surface (Figure (A)). Although the laser fluence or laser heat input for the two samples 29 and 30 were the same, sample 30 showed a decrease in the FZ middle area from 11.4 to mm 2. Choosing the middle area for comparison rather than the total FZ area was due to the excessive root height which might lead to wrong conclusion. Applying the filler wire caused an increase in the reflection losses of the laser beam outside the keyhole because of the interaction between the laser beam and the filler wire above the plate surface [ 34]. Therefore it was necessary to decrease the welding speed to 2 m/min to increase the heat input. The corrected welding speed applied for sample 31 resulted in having full penetration welding as shown in Figures and (B). The same procedure was used to weld the plate with
114 mm gap (samples 32 and 33). In this case the full penetration welding was obtained by autogenous welding (sample 29) as well as by welding with filler wire (samples 31 and 33). Table summarizes the effect of the laser parameters on the weld geometry. It can be seen from this table that full penetration was obtained for both gap sizes of 0.2 and 0.4 mm only when the welding speed was reduced to 2 m/min. 101
115 Table Weld Geometry Profile for 6 mm Laser Welded Plates Sample Average Weld Width FZ middle Area Total FZ Area Total Penetration # mm2 mm2 mm2 mm Notes Bead on plate ( 0 Defocusing ) unstable surface and crown Bead on plate ( -2 Defocusing ) unstable surface and crown Bead on plate ( -4 Defocusing ) good surface morphology Autogenous butt joint (welding speed = 5 m/min) partial penetration Autogenous butt joint (welding speed = 3 m/min), full penetration Applying filler wire (welding speed = 3 m/min, gap = 0.2 mm) lack of penetration Applying filler wire (welding speed = 2 m/min, gap = 0.2 mm) full penetration Applying filler wire (welding speed = 3 m/min, gap = 0.4 mm) lack of penetration Applying filler wire (welding speed = 2 m/min, gap = 0.4 mm) full penetration 102
116 4.5.2 Microstructure The microstructures were analyzed for the 6 mm welded samples as shown in Figures to It was noticed that sample 28 has a rosette grains (Figure A, B, C) and there was a tency to form a dritic grains rather than equiaxed grains. The variation in the microstructure of the three regions inside the FZ (top, middle and bottom) was minor. Figures also shows the microstructure of the partially melted zone. Sample 29 which has a full penetration as shown in Figure 4.5.5, showed the microstructures of the three regions (A,B,C) as equiaxed rosette grains. Decreasing the speed from 5 m/min (sample 28) to 3 m/min (sample 29) changed the microstructure from dritic like to equiaxed rosette morphology. Also, it is evidence that the cooling rate was almost uniform across the thickness since the three regions in this sample have similar grain size. Sample 30, however, exhibited a slight variation in the grain size between the three regions; the bottom region shows smaller grain size than the top and middle one. The further decrease in the welding speed to 2 m/min for sample 31 which had a full penetration welding formed a uniform equiaxed grains globular like rather than the rosette morphology as can be seen in Figure The grain size was also similar for the three regions because of the full penetration opened keyhole welding. The variation in the grain size in sample 32 was more obvious as can be seen in Figure 4.5.8, since it showed a partial penetration (Figure (A)) blind keyhole welding. The microstructure morphology was equiaxed globular grains. The variation in the grain size at different depth in the fusion zone wad not found as the welding speed decreased from 3 to 2 m/min as can be seen in Figure The overall all behavior can be summarized to the following: the variation in the grain size across the FZ depth deps on the keyhole 103
117 shape which in turn affects the cooling rates across the plate thickness. The heat transfer between the keyhole wall and the base metal is carried out by thermal conduction and by the thermocapillary flow effect [ 40]. The Marangoni (thermocapillary flow) is induced by the surface tension gradient and the friction force between the vapor jet and the molten metal which caused the widening of weld geometry at the top and at the bottom in the case of open keyhole condition [ 38, 40]. The thermocapillary flow accelerates the heat transfer between the keyhole and the base metal causing larger amount of molten metal near the keyhole opening. Hence the amount of heat transferred in the top region is higher than the heat transferred by conduction only in the bottom of the closed keyhole [40]. In case of open keyhole at root the amount of heat transfer in the lower region will be increased due to existence of both heat transfer mechanisms. Behind the moving keyhole the weld pool will start to lose effectively the gained heat by conduction to the BM. For the blind keyhole the upper region will have lower average cooling rate than the lower one because of the excessive molten material. For the open keyhole the variation in the cooling rate will be less due to the fact that the mass distribution of the weld pool is more uniform across the thickness which will result in more uniform grain size. The lower cooling rate will give the grains more time to grow. The second issue is the change in the microstructure morphology due to varying the laser parameters. Increasing in welding speed (or reducing the laser heat input) has the effect of changing the morphology from equiaxed globular shape to equiaxed rosette grains. Farther increase in welding speed may result in dritic like morphology rather than equiaxed grains. The HAZ exhibited a liquation between some grains near the PMZ which wasn t observed while welding with original casting that used in the first round. 104
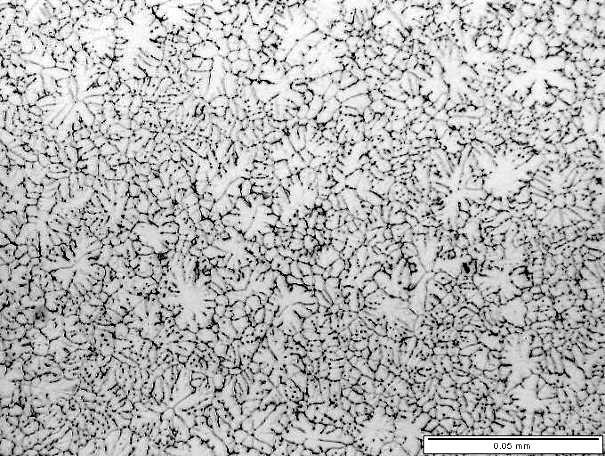
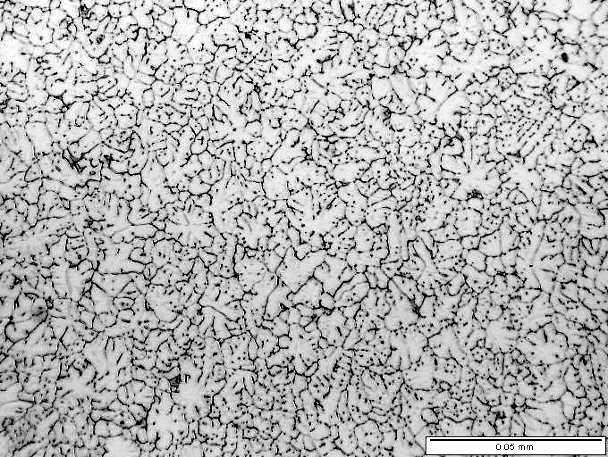
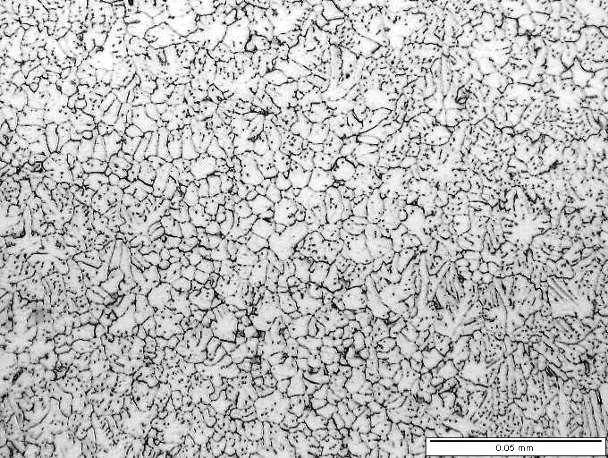
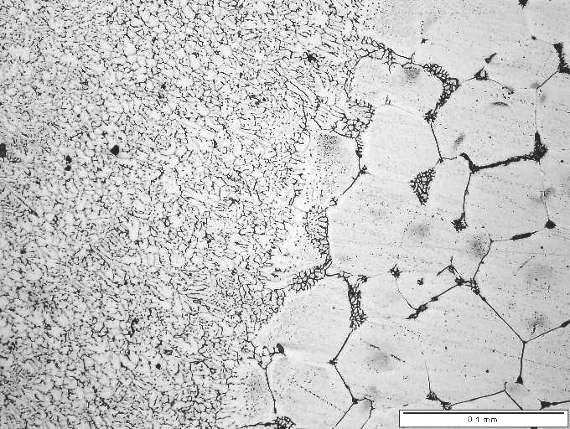
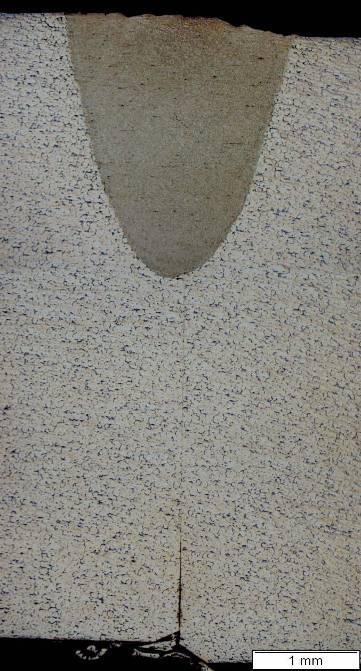
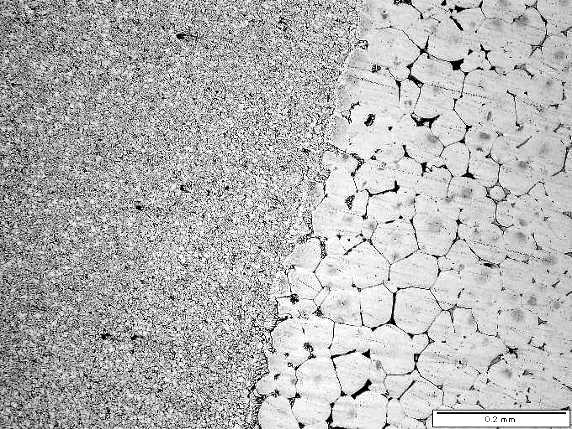
118 A B C FZ Microstructure - A FZ Microstructure - B PMZ Microstructure PMZ Microstructure FZ Microstructure - C Figure Microstructure for Sample
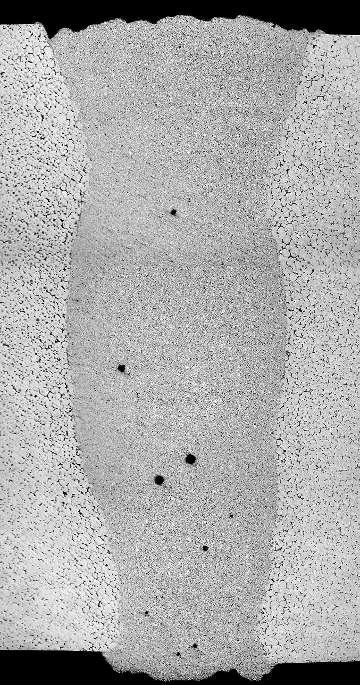
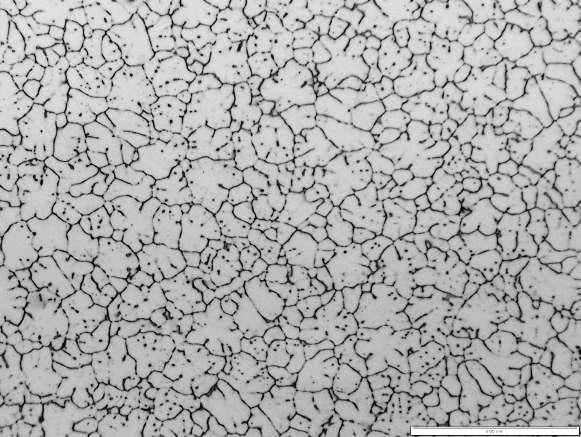
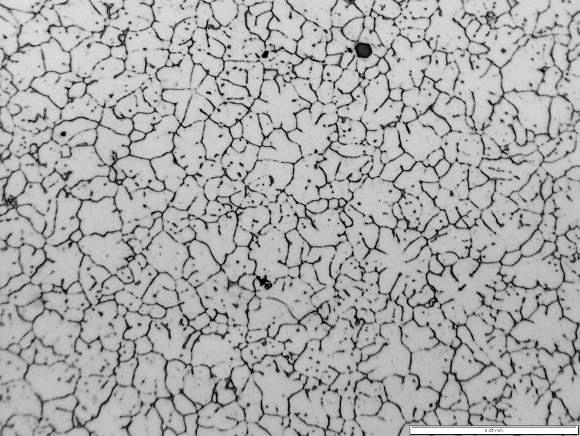
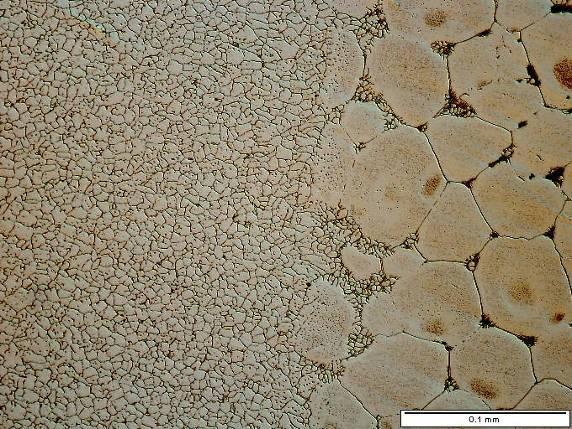
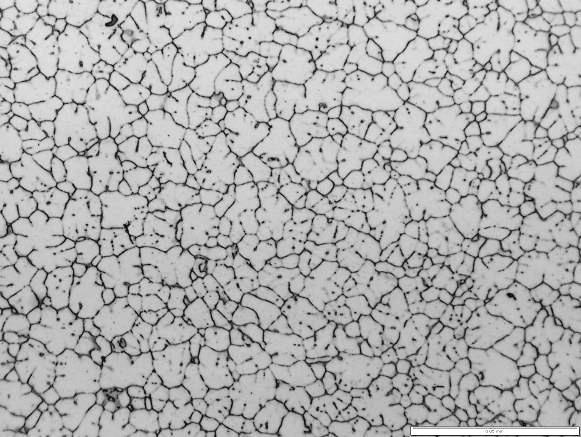
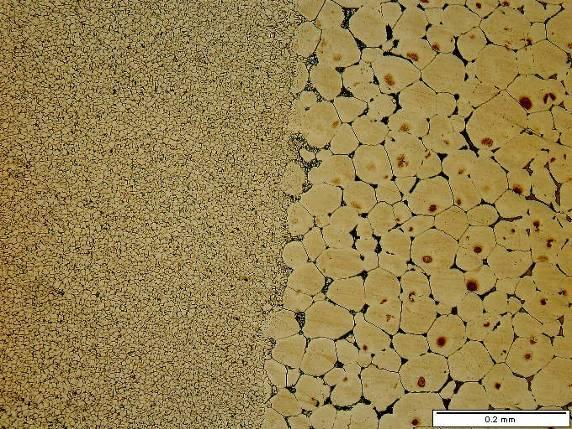
119 A B D FZ Microstructure - A C FZ Microstructure - B PMZ Microstructure - D PMZ Microstructure - D FZ Microstructure - C Figure Microstructure for Sample
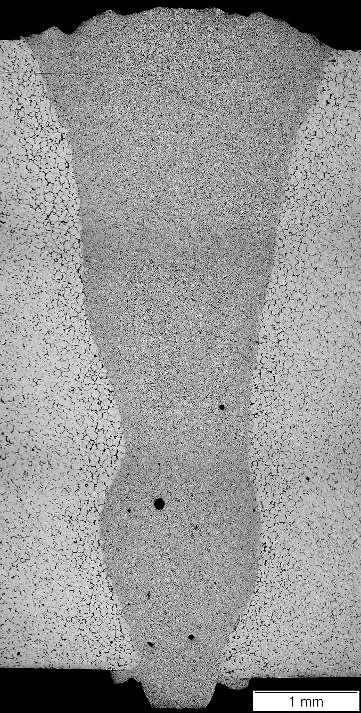
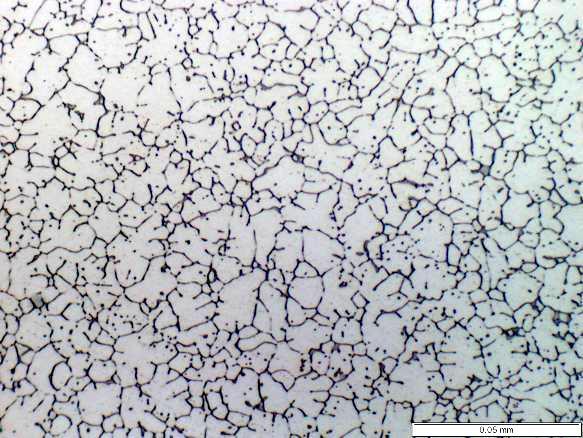
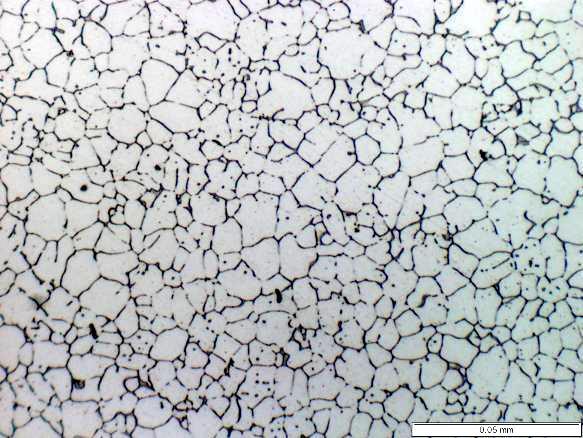
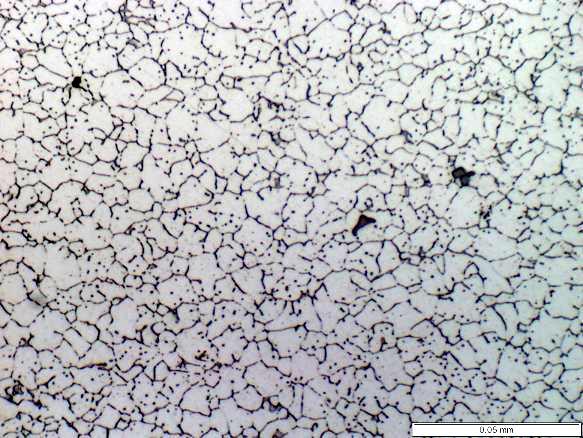
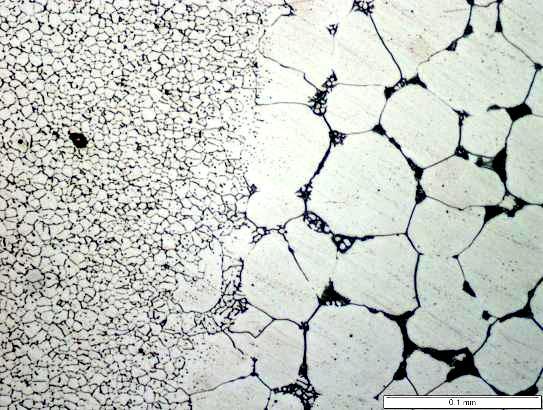
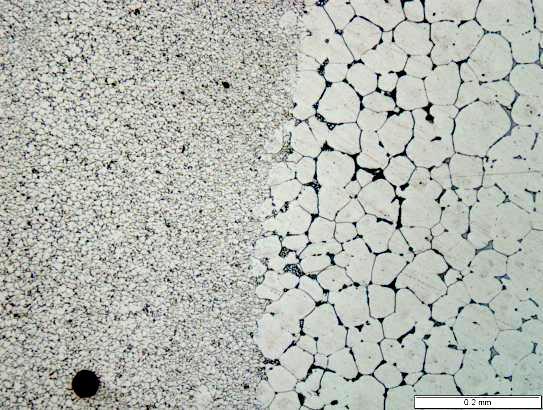
120 A B FZ Microstructure - A C FZ Microstructure - B PMZ Microstructure PMZ Microstructure FZ Microstructure - C Figure Microstructure for Sample
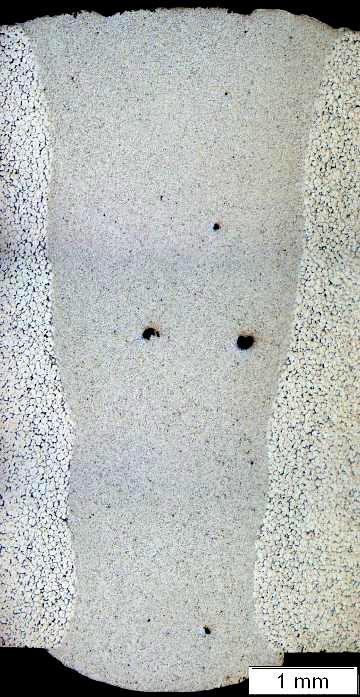
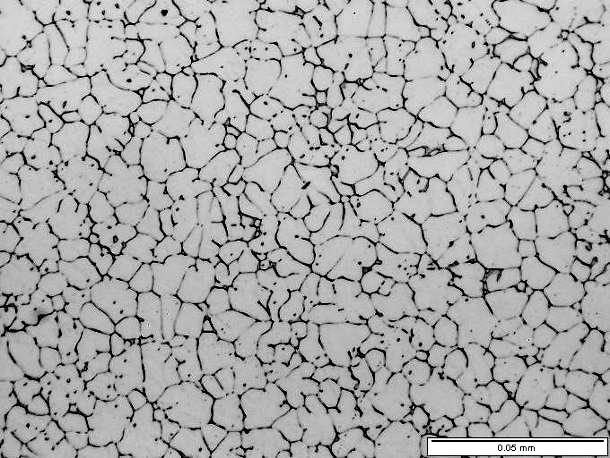
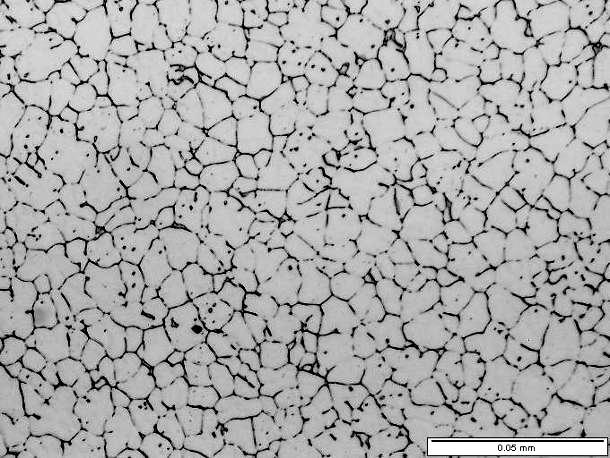
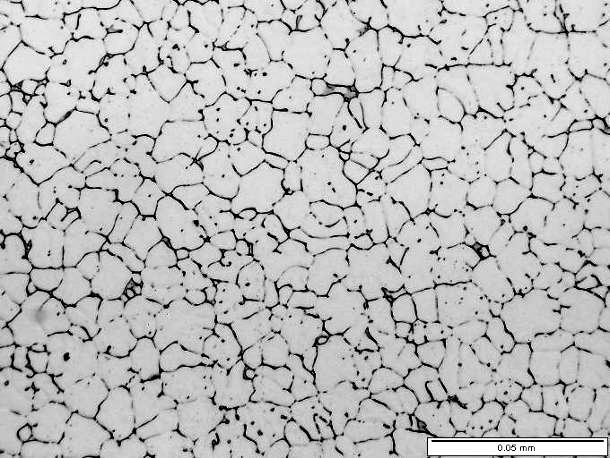
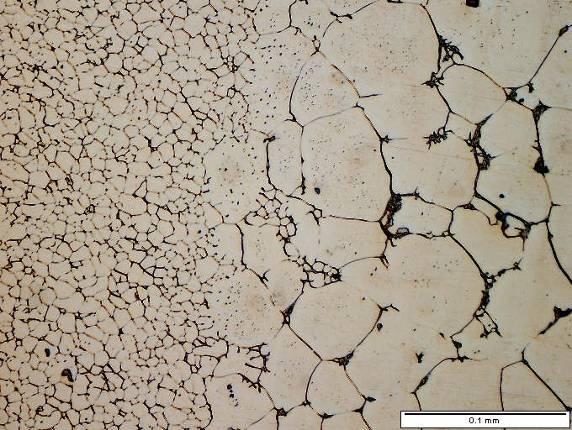
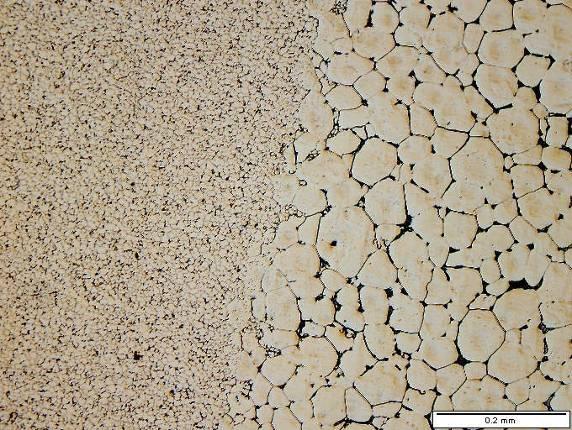
121 A B FZ Microstructure - A C FZ Microstructure - B PMZ Microstructure PMZ Microstructure FZ Microstructure - C Figure Microstructure for Sample
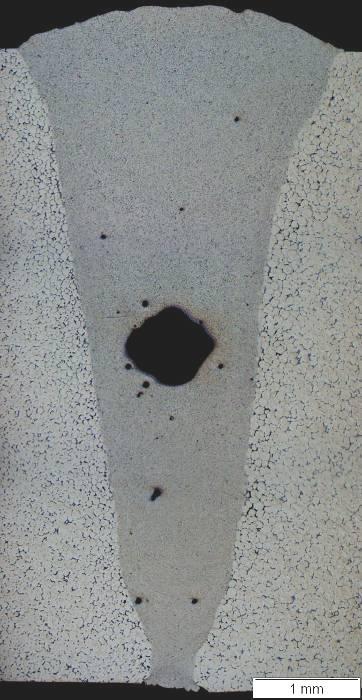
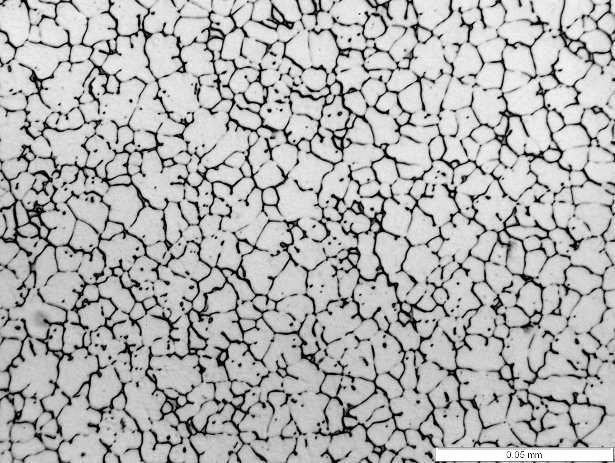
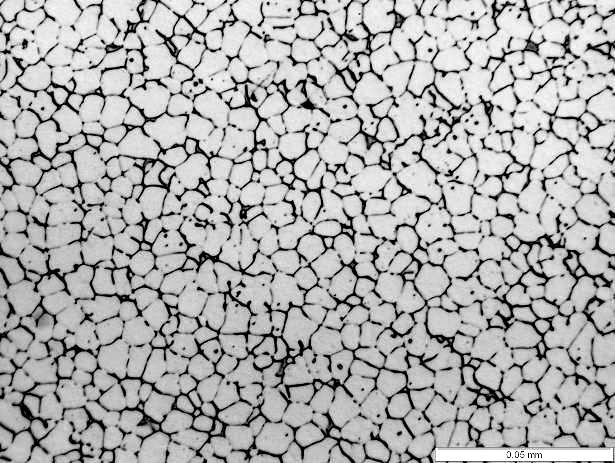
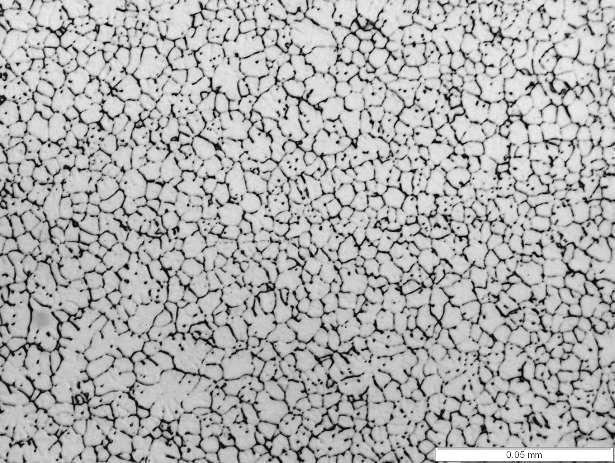
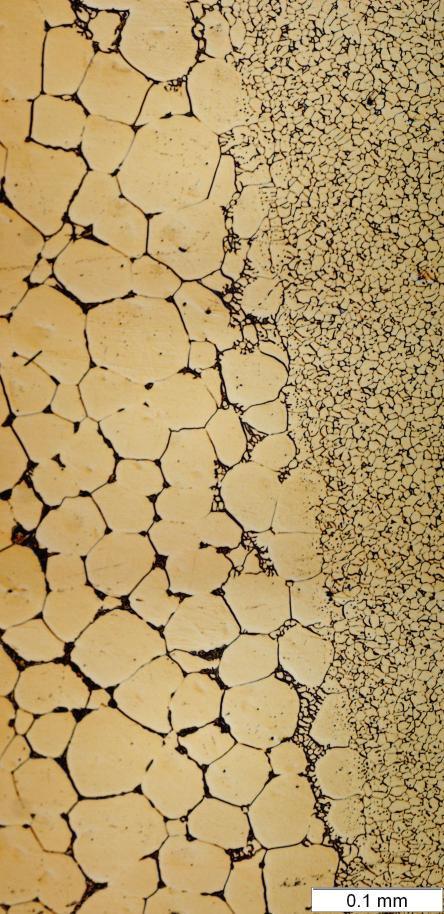
122 A B C FZ Microstructure - A FZ Microstructure - B PMZ Microstructure FZ Microstructure - C Figure Microstructure for Sample


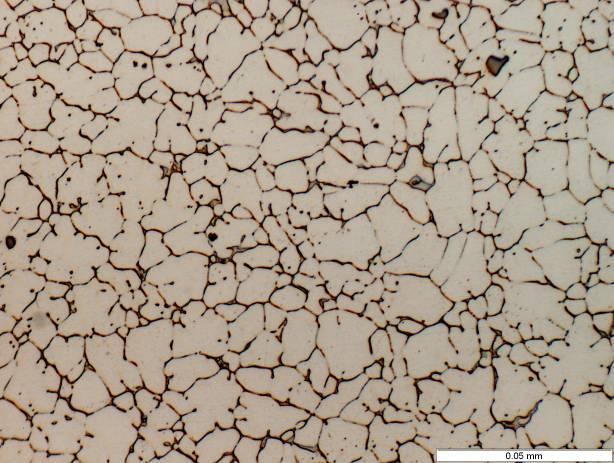
123 A B FZ Microstructure - A C FZ Microstructure - B PMZ Microstructure FZ Microstructure - C Figure Microstructure for Sample
124 4.5.3 Porosity Figure shows the porosity measurements in the FZ of the 6 mm laser welded pates. Samples 30 and 32 showed the formation of large pores in the middle and lower region of the FZ as shown in Figure The maximum porosity area percentage was 2.45 % (sample 32), whereas the minimum was 0.11 % (sample 28). The low heat input used to weld sample 28 resulted in having very low porosity area percentage in the FZ. As the welding speed decreased to 3 m/min (sample 29), it caused a slight increase in the porosity % due to increase in the laser heat input (refer to section 4.1.3). Changing the keyhole mode from open to blind in sample 30 and 32 forced the vapor to escape only from the top opening of the keyhole, and due to excessive heat input, some of the pores coalesced and formed large pores which were entrapped in the molten pool during their floating time. This is supported by comparing the porosity % of samples 32 and 30. Sample 30 showed fluctuation between close and open keyhole whereas sample 32 had only a blind keyhole and that caused to have a higher porosity % in sample 32. The pores distribution for the samples shows that the typical pore diameter was between micron and majority was less than 100 micron. Figure shows an example of pore with a diameter of around 50 micron near the PMZ. Comparing the three fully penetrated samples (29, 31, and 33), the porosity area % was in the same level which is below 0.25%. 111
 Porosity % Number of pores Sample # 50 45 40 35 30 25 20 25 20 15 10 5 0 0-5 5-15 Sample# 28 Sample# 29 Sample# 30 Sample# 31 Sample# 32 Sample# 33 15-25 25-50 50-75 75-100")
125 Porosity % Number of Pores Number of Pores a) Porosity % Number of pores Sample # Sample# 28 Sample# 29 Sample# 30 Sample# 31 Sample# 32 Sample# above Range of Pore Size (micron) Figure Porosity Formation during Laser Welding of 6 mm Plates a) Porosity Area Percentage b) Pores Distribution b) Figure Pore with a diameter 50 µm formed near the PMZ for sample# Cracks Solidification cracks for the 6 mm welded plates are measured as shown in Figure The maximum crack length observed was 0.8 mm (sample 32). Comparing the crack lengths of the good quality casting with samples (1 16) which have lower quality, the good quality casting resulted in the reduction of the solidification crack length from 2.5 mm to 0.8 mm. The geometrical defects and the high porosity % in sample 32 were the main reason for the initiation and propagation of the cracks as shown in Figure It is interesting to view the cracks in sample 28 (Figure ), it had a low porosity % and 112
126 Crack Length (mm) Number of Cracks no geometrical defects, but the crack lengths were high compared with full penetrated samples. Because this sample was near the conduction welding mode, the temperature gradient in the weld pool was high which caused the increase in the mechanical restraint and therefore the increase in the crack susceptibility [ 45]. This temperature gradient could activate the micro segregation of the low melting elements and caused cracks due to the imbalance between the shrinkage of the primary solidified phase and the feeding liquid [ 36] Crack Length Number of Cracks Sample # Figure Solidification Crack length for the 6 mm Welded Samples The rest of the samples exhibited solidification cracks less than 0.4 mm. The main source of the cracks was the porosity and the propagation between the pores. Samples 29, for instance, showed a minimum solidification crack length of 0.11 mm. As noted from the previous porosity distribution chart (Figure ), the majority of the pores were small due to the welding at open keyhole mode and higher speed (3 m/min) compared with samples 31 and 33 which were welded at open keyhole mode but at lower welding speed (2 m/min). Distribution of small pores in the FZ would decrease the probability that the pores will be linked together through a crack [ 36]. The micrographs for other samples can be seen in the appix (A.3)


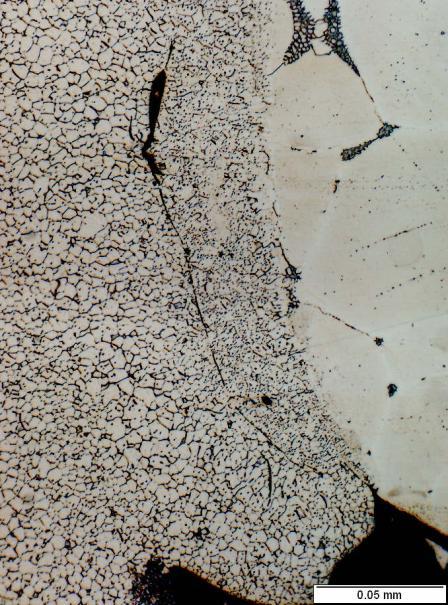
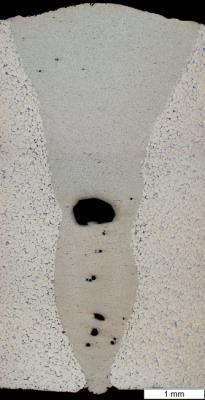
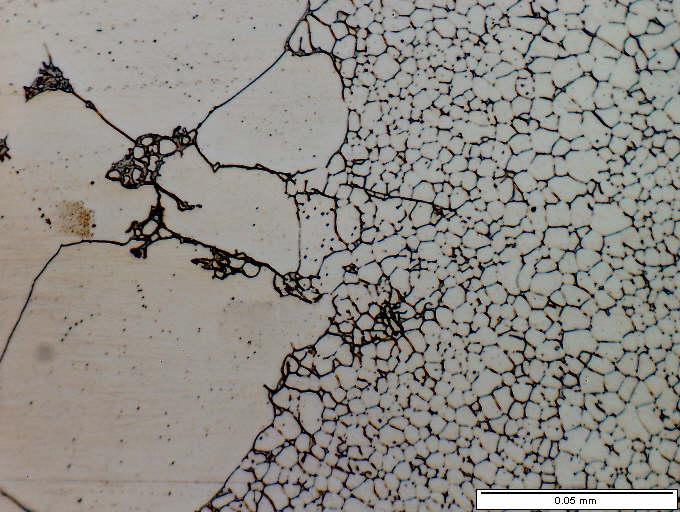
127 A A B E C D E B Liquation Crack D C Figure Solidification and Liquation Cracks for Sample


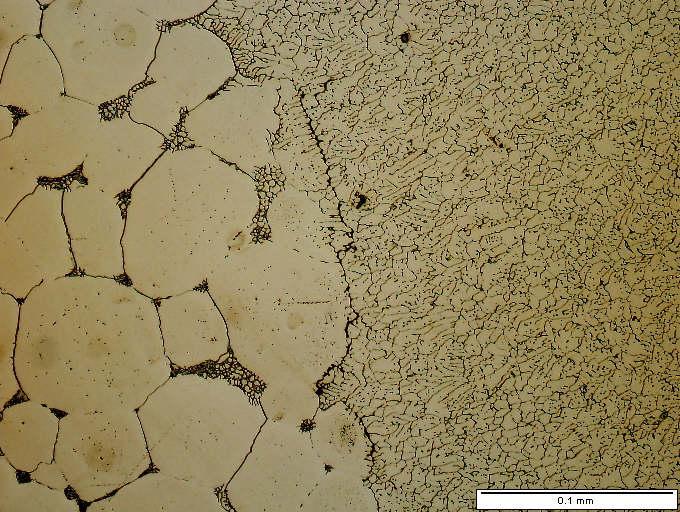
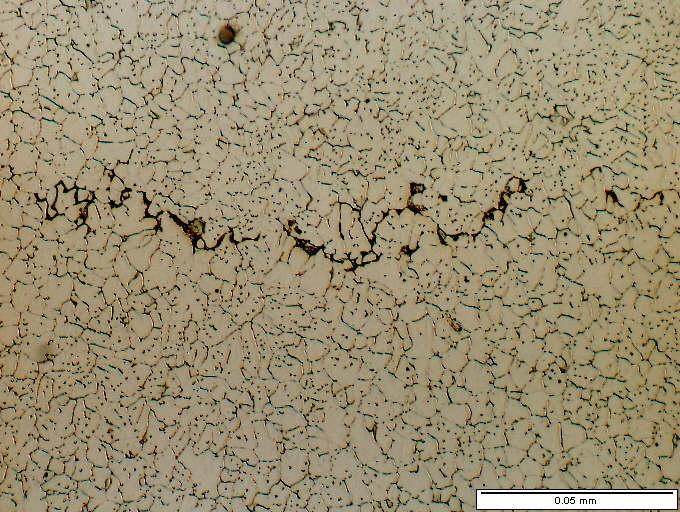
128 D A B E C Crack - B Crack - A Crack - C Crack - E Crack - D Figure Solidification Cracks for Sample
129 4.5.5 Mechanical Properties Only the welded plates with full penetration (samples 29, 31 and 33) were used to investigate the mechanical properties of the 6 mm plates thickness. These samples were studied in both conditions as welded and the heat treated conditions. The microhardness profiles for the two groups are shown in Figure On average there was a drop of 10 HV in the FZ hardness for the as welded condition samples whereas the heat treated samples had a drop of 5 HV. The average hardness in the center line of the FZ was calculated for both groups as shown in Table The heat treatment caused 3 to 7 HV increase in the hardness of the FZ, but it is still lower than that of the BM. Although the heat input used to weld the 6 mm plates was much higher than the heat input used to weld the 2 mm plates, the HAZ width was similar for both (around 2 mm). This is one important characteristic in laser welding; that is the increase in heat input will have less effect on the FZ and HAZ width compared with the conventional welding. The main reason is that in laser welding, the power is distributed through the keyhole wall all over the plate thickness, whereas in the convectional welding the power is concentrated on the top surface and is transferred by across material thickness. Table Average Vickers Hardness in the Center Line of the FZ for the full penetrated 6 mm laser welded plate Sample Vickers Hardness Vickers Hardness # as welded condition heat treated
130 HV hardness HV hardness HV hardness HV hardness HV hardness HV hardness HAZ FZ HAZ Position (mm) Sample # 29 (As welded) HAZ FZ HAZ Position (mm) Sample # 31 (As welded) HAZ FZ HAZ Position (mm) Sample # 33 (As welded) HAZ FZ HAZ Position (mm) Sample # 29 (Heat treated) HAZ FZ HAZ Position (mm) Sample # 31 (Heat treated) HAZ FZ HAZ Position (mm) Sample # 33 (Heat treated) Figure Microhardness Profiles for the Full Penetrated 6 mm Laser Welded Plates in a) as Welded Condition b) Heat Treated Condition 117
131 Table shows the tensile properties of samples 29, 31, and 33 for the as welded and heat treated conditions. As indicated in the table, all the samples fractured in the HAZ PMZ interface except two. The microstructure which was discussed in section showed that the HAZ PMZ interface exhibited a liquation of some grains boundaries near the PMZ. In general, adding filler wire (samples 31 and 33) improved the tensile strength of the joint compared with the autogenous welding (sample 29). The joint efficiency was calculated for the three samples as shown in Figure The tensile properties of the BM are shown in Table The joint efficiency was increased by 3 to 5% by adding the filler wire since it reduced the effect of underfill and notching in the FZ. The joint efficiency was reduced by 5% after heat treatment compared with as welded condition. The high joint efficiency between % indicated that the defect levels for the three samples (29, 31 and 33) were similar. This also can be confirmed using Weibull analysis for the tensile strength for the three samples. The three samples had different process parameters but the comparison is taken from the joint quality point of view. Figure shows that the three samples have a high Weibull modulus (as welded condition) and (heat treated). This high m value reflects the consistency of the tensile strength of these samples and suggests that there is no significant variation in the defect levels for the three samples. 118
132 Probability of fracture ln(ln(1/(1-pf))) Joint Efficiency Table Tensile properties of the Full Penetrated 6 mm Laser Welded Plates Sample # As Welded Condition Heat Treated TS (Mpa) El% Failure location TS (Mpa) El% Failure location PMZ - HAZ PMZ - HAZ HAZ PMZ - HAZ PMZ - HAZ PMZ - HAZ PMZ - HAZ PMZ - HAZ PMZ - HAZ PMZ - HAZ PMZ - HAZ PMZ - HAZ PMZ - HAZ BM PMZ - HAZ PMZ - HAZ PMZ - HAZ Table Tensile Properties of ZE41A-T5 BM Rank # TS (Mpa) El% as welded heat treated base metal y = x R 2 = (Heat Treated Condition) (As Welded Condition) y = x R 2 = Base Metal TS (MPa) ln(ts) Figure Weibull Statistical Analysis of the Tensile Strength of Samples 29, 31 and 33 a) Cumulative Plots of Tensile Strength b) Weibull Plots of Tensile Strength as - welded heat treated Sample # Number Figure Joint Efficiency of the full Penetrated 6 mm laser Welded Plates
133 4.6 Calculation of Laser Efficiencies from the Experimental FZ Geometry Method During keyhole laser welding process, the delivered laser beam by the laser head will pass through multiple stages till it is converted to effective power that melts the BM and produces the weld seam as shown in Figure [48,49]. The keyhole will be created after overcoming the threshold surface intensity (I s ) which is determined by the material vaporization temperature (T v ), the thermal conductively (k) and the absoptivity at normal incidence (A) [39]: I s T. k v (4.6.1) A Laser Power Damping by Plasma Plume Power on the Workpiece Reflecting outside the keyhole Laser beam First Fresnel Plasma plume abs. Keyhole Fresnel absorption Plasma plume Power Entering the Keyhole First plasma absorption First Fresnel absorption Power for Multiple Reflection Plasma Absorption Power Lost through The BM Power Absorbed By The Keyhole Wall Power Leaving the Keyhole Fresnel Absorption Power Available for Melting Figure Schematic Diagram Showing the Power Balancing during Keyhole Laser Welding 120
134 At steady state and before the laser beam enters the keyhole, part of the laser power (P) will be lost due to reflection (P ref ) and the absorption by plasma plume (P plume ) [40]: P entering the keyhole = P P ref P plume (4.6.2) Before the laser ray reaches the keyhole wall, part of the ray intensity will be absorbed by the plasma inside the keyhole. When the laser ray reaches the keyhole wall it will be absorbed partially, deping on the wall angle and material properties. The reflected intensity will pass through multiple reflections inside the keyhole. In each reflection the laser ray will lose some intensity by plasma absorption. After the multiple reflection the laser ray will leave the keyhole from the top for blind keyhole or from bottom and top for open keyhole. The coupling efficiency ( ) is defined as the portion of the laser power available A to the workpiece, in other words it is equal to the ratio of the absorbed power (P abs ) by the keyhole wall to the total laser power (P): A P abs (4.6.3) P It is worth noting that not all the absorbed laser power will be consumed for the melting but part of it will be lost by conduction through the BM. The thermal efficiency ( η th ) is defined as the portion of the absorbed laser power that produced the weld seam [39], or it is the ratio of the heat of melting (P melting ) divided by the absorbed laser power (P abs ): P melting th (4.6.4) Pabs 121
135 The laser process efficiency ( P ) is composed of a coupling efficiency ( A ) and a thermal efficiency ( η th ) [39]:. P (4.6.5) A th By substituting equations and in equation 4.6.5, the laser process efficiency ( P ) will be defined as the ratio of the melting power divided by the total laser power: P melting P (4.6.6) P Swift-Hook and Grik [6,46] defined the melting ratio ( MR ) as the fraction of total incident laser power that is used to melt the weld metal: V. Aw. [ C p ( Tmp To ) H f ] MR P (4.6.7) Where A w is the melted base metal area (FZ area), ρ is density, C p is the specific heat, Δ H f is the latent heat of fusion, V is welding speed, T mp is the solidus temperature, T o is room temperature and P is the incident laser power. Hence based on this definition the melting ratio (MR) is equal to the laser process efficiency ( P ): p V. Aw. [ C p ( Tmp To ) H P f ] (4.6.8) To calculate the coupling efficiency ( ) the absorbed laser power by the keyhole must be estimated from the given FZ geometry. Rosenthal [47] derived the temperature distribution in the work piece induced by the moving line heat source as: A 122
136 T( r, ) P' 2 k Pe. cos( ) To Ko ( Pe) e (4.6.9) Where P` is the line source strength (W / m), T (r, ) is the temperature field in the workpiece (K), T o is the ambient temperature (K), k is thermal conductivity, K 0 is the modified Bessel function of second kind and zero order, Pe is Peclet number, V is welding speed, and kd is the thermal diffusivity (m 2 /s) [40,48]. Converction heat r. V Pe ( Peclet number) (4.6.10) Conduction heat 2. kd The thermal diffusivity is equal to the ratio of thermal conductivity divided by heat capacity: k Kd (4.6.11). C p r v Figure Polar coordinate for the Keyhole and the Moving Line Source 123
137 The coordinates (r and ) is measured from the beam axis which is assumed to be in the center of a conical keyhole shape [40] as shown in Figure For a given FZ geometry the average line source strength can be calculated from equation 4.6.9, by applying the boundary condition at the PMZ; T is equal to T melting, r is half the average width of the FZ and is taken to be / 2 since it can locate the PMZ. After calculating the average source strength, the power absorbed by the keyhole can be calculated by multiplying the average source strength (P average ) by the penetration depth (Pd) [40]: P abs = P average. Pd (4.6.12) Results The calculated coupling, thermal and process efficiencies for all tested samples are shown in Table The physical properties for pure Mg at melting point (refer to appix) were used for this purpose because the properties of the ZE41A-T5 alloy at the melting point are not available. Figure shows the effect of welding speed on the coupling, thermal and process efficiencies. As the welding speed increased from 4 to 7 m/min, the coupling efficiency was increased from 25 to 42 %. In Figure 4.6.4, the effect of the welding speed on the keyhole shape and on the multiple reflections inside it was simulated using a laser keyhole welding model as will be described in the next section. As shown in Figure 4.6.4, the keyhole angle with y-axis was increased from 3.9 to 4.5 degree as the welding speed was increased from 4 to 6 m/min. This increase in speed caused to decrease the root keyhole width and caused the increase in the number of the multiple reflections. The increase in the coupling efficiency supported by the hourglass 124
138 Table Laser Efficiencies for the Experimental Tested Samples Sample # Effective Parameters Coupling Efficiency % Thermal Efficiency % Process (Melting) Efficiency % Pabs / Ptotal Pmelting / Pabs Pmelting / Ptotal Effect of Welding Speed on Efficiencies - 2 mm plates 1 welding speed = 4 m/min welding speed = 5 m/min welding speed = 6 m/min welding speed = 7 m/min Effect of Gap Size on Efficiencies - 2 mm plates 5 gap size = 0.1 mm gap size = 0.2 mm gap size = 0.3 mm gap size = 0.4 mm gap size = 0.5 mm gap size = 0.6 mm Effect of Laser Power on Efficiencies - 2mm plates 11 laser power = 2.5 kw laser power = 2.75 kw laser power = 3 kw laser power = 3.5 kw laser power = 3.75 kw laser power = 4 kw Effect of Defocusing on Efficiencies - 6 mm plates 25 Defocusing = 0 mm Defocusing = -2 mm Defocusing = -4 mm Comparison of Efficiencies between Laser Welding of 6 mm plate with and Without Filler Wire 29 6 mm thickness (Autogenous) mm thickness (Applying Filler Wire) Efficiencies for Successful Full penetrated Samples ( 2 and 6 mm plates ) mm thickness (filler wire) mm thickness (Autogenous) mm thickness (filler 0.2 mm gap) mm thickness (filler 0.4 mm gap)
139 Penetration (mm) Penetration (mm) Efficiency % Coupling Eff. Thermal Eff. Process Eff Welding Speed (m/min) Figure Effect of Welding Speed on Coupling, Thermal and Process Efficiencies m/min m/min Width (mm) Width (mm) Figure Simulation Showing the Effect of Welding Speed on the Keyhole Shape and the Multiple Reflections geometry for these samples proves that the keyhole was open at the root. If the keyhole was partially penetrated and blind at the root, the effect of increasing the welding speed on the coupling efficiency will be reversed. On the other hand Figure shows that the thermal efficiency was reduced by increasing the welding speed. This reduction in thermal efficiency balanced the increase in the coupling efficiency and thus there was no significant decrease in the melting or process efficiency. 126
140 Efficiency % The effect of gap size on the efficiencies is shown in Figure The increase in feed rate of the filler wire for the gap size from 0.1 to 0.6 mm did not cause a significant change in the process efficiency which means that the reflection losses due to interaction of the laser beam with filler wire were almost constant for different feed rate. The coupling efficiency was at maximum value at 0.4 mm gap size, which seems to be a suitable size for molten flow and formation of the keyhole Coupling Eff. Thermal Eff. Process Eff Gap Size (mm) Figure Effect of gap size on Coupling, Thermal and Process Efficiencies. Figure shows the effect of laser power on coupling, thermal and process efficiencies. The partial penetration welding for laser power below 3.5 kw showed higher process and coupling efficiencies than those for the open keyhole mode. At partial penetration welding the beam will be trapped inside the keyhole and the only way to escape is through the top keyhole opening, whereas the open allows more waste of the laser beam because of the open keyhole root as indicated in Figure
141 Penetration (mm) Penetration (mm) Efficiency % Coupling Eff. Thermal Eff. Process Eff Laser Power kw Figure Effect of Laser Power on Coupling, Thermal and Process Efficiencies kw 3.5 kw Width (mm) Width (mm) Figure Simulation Showing the Effect of Laser Power on Keyhole Shape and the Multiple Reflection The effect of defocusing on the three efficiencies can be seen in Figure The Bead-on-plate sample welded with -4 mm defocusing faced a fluctuation between keyhole and conduction welding mode since the surface intensity was near the threshold intensity as discussed in section 4.5. This conduction mode or the shallow keyhole caused a reduction in the coupling efficiencies because the laser beam had less interaction with molten metals. 128
142 Efficiency % Coupling Eff. Thermal Eff. Process Eff Defocusing (mm) Figure Effect of Defocusing on Coupling, Thermal and Process Efficiencies Table shows that applying filler wire (sample 30) resulted in a reduction in the coupling efficiency by 12% from the autogenous welding (sample 29) due to the reflection of laser rays outside the keyhole. Figure shows a comparison between the coupling, thermal and melting efficiencies of the successfully welded 2 and 6 mm plates. The coupling efficiency increased for the 6 mm plates due to the multiple reflection of the laser beam inside the keyhole. The increase in penetration will increase the chance of the multiple reflection and plasma absorption inside the keyhole. Figure also shows the comparisons of the efficiencies for the 6 mm laser welded plates at 0.2 and 0.4 mm gap size, which indicates that the feed rate had no influence on the variation of the coupling, thermal and process efficiency. 129
143 2 mm Plate + Filler Wire 6 mm Plate (Autogenous) 6 mm Plate + Filler wire (0.2 mm Gap) 6 mm Plate + Filler wire (0.4 mm Gap) Efficiency % Sample # Coupling Eff. Thermal Eff. Process Eff. Plate Thickness & Welding Type Figure Effect of Penetration Depth and Welding Type on the Coupling, thermal and Process Efficiencies 130
144 4.7 Modeling of Keyhole Laser Welding The objective of this section is to simulate the laser welding process through combining different models and concepts used to describe the keyhole and fusion zone generated during the keyhole laser welding. The Model will help to develop better understanding of the laser welding process and the effect of different parameters on the keyhole and fusion zone profiles. Also the model can reduce the time necessary to find the suitable parameters to produce full penetration successful weld joints. In this model the following consideration and assumption were implemented: The keyhole profile is symmetrical in the plane perpicular to the welding direction. The laser heat source is assumed to be a line heating source acting along the center of the keyhole. The energy balance between the heat loss at the keyhole wall and the absorbed intensity was solved in the plane perpicular to welding direction which is the plane of interest that enables the calculation the melting temperature isothermal profile. The intensity of the laser beam is taken to be a Gaussian like distribution [40, 48]. Reflection of laser ray from the keyhole wall follows the Fresnel formulation which assumes that the angle of incidence equals to the angle of reflection [49]. 131
145 4.7.1 Energy Balance at the Keyhole Wall for First Fresnel Absorption The heat loss from the keyhole wall deps on the absorbed laser intensity which is described by the following equation [48]: q v = I ab. tan ( ) (4.7.1) Where q v is heat flow in a particular keyhole layer (w/m 2 ), is the angle of the keyhole at the particular layer, and I ab is the absorbed intensity at the keyhole wall (Figures and 4.7.2). The direct absorption of the incoming ray incidence through the keyhole wall called the first Fresnel absorption. Z Laser incidence X i Keyhole wall I(x,z) Keyhole wall keyhole keyhole q v (x,z) Figure the coordinate system for the Keyhole Layers Figure Energy Balance for First Fresnel Absorption Heat Flow Equation at the Keyhole Wall The heat absorbed through the keyhole wall is equal to the heat loss by the keyhole as derived by Kaplan [48]. The heat flow can be determined by applying Fourier s law of heat conduction that can be simplified as: q T k (4.7.2) r 132
146 By substituting the moving line source temperature field equation (4.6.9) into equation 4.7.2, the following heat flow equation was derived [40,48]: 1 K q( r, ) ( T To ). k. Pe.( Cos r K 0 ( Pe) ) ( Pe) 1 (4.7.3) Where q is the heat flow (w/m 2 ) and K 1 ( ) is the modified Bessel function of second kind and first order. The polar coordinates ( r, ) are shown in Figure As mention before the plane of interest is perpicular to welding direction therefore r is equal to x, and is equal to Intensity Distribution for the Laser Beam The intensity distribution of the laser beam is assumed to follow the Gaussian like distribution. The maximum peak intensity (I oo ) is located in the focal plane at zero radius, and the intensity starts to fall as moving away from the focal point in x and/or z direction as shown in Figure The intensity of the laser beam at any point can be calculated by the following equation [43,48]: Intensity Distribution I 00 Laser Beam Z x I 0z Focal Plane Beam radius = r 0 Plane - Z Zr Beam radius = r f I xz Figure Intensity Distribution for the Laser Beam [43] 133
147 I (, ) x / rf x z I e. 0 z (4.7.4) Where I oz is the peak intensity at any z plane and r f is the beam radius at any z plane and can be calculated by the following equations [43,48]: I I o z r r o 2 00.( ) f (4.7.5) And, r f r o. [1 ( z z r z 0 ) 2 ] 1/ 2 (4.7.6) Where Z 0 is the location of the focal plane relative to the plate top surface (defocusing distance), and Z r is the Rayleigh length where the peak intensity at Z r plane equals to half the maximum intensity (I oo ), and can be calculated by the following equation: Z r 2 r (. f number ) (4.7.7) o The maximum intensity can be computing using the following equation: 2 P I oo 2 (4.7.8). r 0 Where P is the laser power and r o is the beam focal radius Fresnel Absorption Coefficient The laser ray will experience a reflection and absorption by the keyhole wall, in this case the molten vapor surface is considered to be specular which lead to have the angle of 134
148 absorptivity incidence equal to the angle of reflection. The absorption coefficient of the laser ray can be calculated using Fresnel formula for circular or random polarized light as follows [49,51,52]: 1 1 (1 cos ) ( 2 1 (1 cos ) 2 cos 2cos ) 2 cos 2cos Fresnel (4.7.9) Where is the angle between the incidence ray and normal to surface of the keyhole wall (Figure 4.7.5), and is material depant quantity. The absorptivity of Mg at perpicular incidence for Nd:YAG laser is unknown. Therefore, a value for Al element 4% at 1.06 μm wavelength [39] was used. The value of was estimated by lar substituting ( 0, perpicu 0.04) in equation (4.7.9) which was found to be Fresnel This value needs to be verified by testing the reflectivity of Mg at 1.06 μm wavelength for perpicular incidence or at different angles. The calculated absorptivity of Mg at different angles is shown in Figure Laser Ray ) ( Fresnel Normal y to keyhole wall Absorbed intensity 0.25 Reflected Ray Keyhole Wall Keyhole angle Incident Angle Figure Calculated Absorptivity of Al to Nd:YAG Laser Beam at Different Incident Angles at Room Temperature. 135 ( )
149 I The absorbed intensity can be calculated by the following equation: ab I x, z. Fresnel (4.7.10) Plasma Absorption The effect of plasma absorption in the keyhole laser welding is a wider and less penetrating keyhole [49]. The absorbed intensity in the keyhole by the inverse Bremsstrahlung action will be deposited back to the keyhole wall by radiation [53]. The absorbed intensity by plasma can be calculated by the following equation [48,49]: I Plasma IB L Iincident Iincident. e (4.7.11) Where L is the path length of the ray inside the plasma, and is the inverse Bremsstrahlung coefficient, which is function of the density of the electrons, degree of ionization and temperature in the keyhole. The literature review showed that IB ranges from 100 to 200 m -1. In this work an average value of 150 m -1 was used. The plasma IB absorption coefficient ( L e IB 1 ) is proportional to the square of the wavelength. Therefore the plasma absorption in Nd:YAG laser is 1% of the plasma absorption in CO 2 Laser. Kaplan [48] reported that the plasma plume absorption outside the keyhole was in the range of 1% for different welding speed using CO 2 laser system. Therefore, the plasma plume was neglected here because of the short wavelength of the Nd:YAG laser, whereas the plasma absorption between the multiple reflection inside the keyhole were calculated while considering their deposit location. 136
150 4.7.6 Multiple Reflection of the Laser Ray After calculating the keyhole profile by considering only the first Fresnel absorption, the keyhole profile was converted to polynomial equation using the least squares method in order, to calculate the slope and the Fresnel absorption coefficient at any location. Between two reflections the laser ray loses intensity because of the plasma absorption as mentioned above. The geometrical and intensity calculation between two reflections is demonstrated in Figure The absorbed intensity from multiple reflections will work together with the direct Fresnel intensity to produce the total absorbed intensity in the particular layer [49], whereas the plasma plume will try to widen the keyhole. Therefore, the energy balance at the keyhole wall will be as follows [48,49,50]: tan ( keyhole layer keyhole dx tan 1 ( ) dz 1 2 ) keyhole 1 h 1 1 keyhole 1 q I layer layer Fr1 I I X = - f(z) layer plasma layer Fr Mr z x h 1 (4.7.12) I x,z keyhole I ab 1 h 2 1 keyhole 2 keyhole 2 Fresnel f ( ) I ab keyhole 2 h 2 3 X = f(z) I ab 3 I I ab. 1 I 1 Fresnel ( 1 ) 2 I 1. (1 Fresnel ( 1 ) ) I Plasma 1 2 I ab 2 I 2. Fresnel ( 2 ) Figure Geometrical Analysis for Multiple Reflections inside the Keyhole 137
151 4.7.7 Method of Calculation MATLAB software and GUI applications was used to simulate the keyhole laser welding process the program code can be found in Appix (A.5). The first step is to determine the keyhole radius and the keyhole profile by considering only direct Fresnel absorption. To calculate the multiple reflections and plasma absorption, the keyhole obtained from the first Fresnel absorption was converted to two mirror polynomial equations to determine the slops and intersection at any layer. The result of the multiple reflections and plasma was used to recalculate the keyhole profile and to calculate the source strengths for each layer. The last block of calculation was to generate the FZ geometry which will be parallel to final keyhole profile. Equation (4.6.9) was used to determine the radius of the melting isotherm at each layer since the source strength is unique and it is the same when the boundary condition was applied at keyhole wall ( T = T v, r = r k ), or at PMZ ( T = T melting, r = FZ width 2 ). The effect of the thermocapillary flow on the FZ width was taken into account by correcting the source strengths [40] obtained from the keyhole profile, and sample 29 was used for this purpose. The previous section showed that there was no significant variation in the coupling efficiency due to change in filler wire feed rate. Adding filler caused to reduce the coupling efficiency by 10 to 14 %. Therefore, a value of 10 % was considered to be losses of power and intensity before entering the keyhole. Figure describes the calculation procedure with related references. 138
152 Assume Starting Angle of the Keyhole Equal to 45 o [40,48] Calculate Source Strength at the Keyhole Tope Opening Calculate Keyhole Top Radius by Solving the Energy Balance between the Heat Loss at the Keyhole Wall and the Absorbed Intensity by the First Fresnel Absorption [40,48] Calculate Keyhole Profile and Source Strength for Each Layer by Solving the Energy Balance between the Heat Loss at the Keyhole Wall and the Absorbed Intensity by the First Fresnel Absorption [40,48] Estimate the Effect of the Thermocapillary flow on the FZ width [40] Describe the Keyhole Profile by Polynomial Equation Curve Fitting [50] Calculate the Multiple Reflections and Plasma Absorption and their Location Inside the Keyhole [49, 50] Recalculate the Keyhole Profile by Solving the Energy Balance between the Heat Loss at the Keyhole Wall and the Absorbed Intensity by the First Fresnel Absorption, Multiple Reflections and Plasma Absorption [40,49] Corrected Source Strength for FZ Profile Calculating the FZ Radius at Each Layer since the Sources Strength were Calculated by Solving the Keyhole Profile [40, 48] Figure Model Flow Chart for Keyhole Laser Welding 139
153 Penetration (mm) Width (mm) Penetration (mm) Width (mm) Comparison between the Model and the Experimental Results Figures to show the comparison between the model and the experimental results. The model shows acceptable results for laser welding of the 2 mm and 6 mm butt joints plates. The Bead-on-plate laser welding shows some discrepancies between the model and the experiments especially for sample 26 (-2 mm defocusing) which may be due to the variation in the surface condition or variation in physical properties between pure Mg and ZE41A-T Experimental Model Expermental Model Defocusing (mm) Defocusing (mm) -4 a) Bead-on-plate Laser Welding Full Penetration Experimental Model Sample # Sample # b) Laser Welding of 6 mm butt joints plates with and Without Filler Wire Experimental Model Figure Comparison between the Experimental results and the Model for Laser Welding of 6 mm Plates 140
154 Penetration (mm) Width (mm) Penetration (mm) Weld Width (mm) Experimental Experimental 2.5 Model 2.5 Model Full Penetration Welding Speed (m/min) Welding Speed (m/min) a) Effect of Welding Speed on Laser Weldability of 2 mm Plates Eexperimental Model Laser Power (kw) Laser Power (kw) b) Effect of Laser Power on Laser Weldability of 2 mm Plates Experimetal Model Figure Comparison between the Experimental results and the Model for Laser Welding of 2 mm Plates 141

 -6-3 -2-1 0 1")
 Sample")


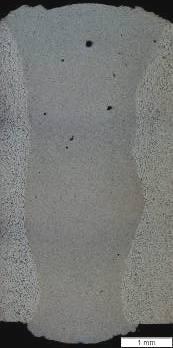
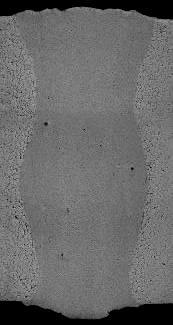
155 Penetration (mm) Penetration (mm) Penetration (mm) Penetration (mm) Penetration (mm) Penetration (mm) Width (mm) Width (mm) Width (mm) Sample 25 Sample 26 Sample 27, Width (mm) Width (mm) Width (mm) Sample 29 Sample 30, 32 Sample 31, 33 Figure Comparison between Experimental and Calculated Weld Geometry for the 6 mm Laser Welded Plates 142
156 Penetration (mm) Penetration (mm) Penetration (mm) Penetration (mm) Penetration (mm) Penetration (mm) Width (mm) Width (mm) Width (mm) Sample 11 Sample 14 Sample 16 Figure Comparison between Experimental and Calculated Weld Geometry Showing the Effect of Laser Power on Laser Welding of the 2 mm Plates Width (mm) Width (mm) Width (mm) Sample 1 Sample 2 Sample 4 Figure Comparison between Experimental and Calculated Weld Geometry the Model Showing the Effect of Welding Speed on Laser Welding of the 2 mm Plates 143
157 Chapter Summary and Concluding Remarks The laser weldability of ZE41A-T5 Mg sand castings using 1.6 mm filler wire EZ33A-T5 was studied for 2 and 6-mm butt joint plates. The weldability of an alloy is defined as the ability to produce sound and acceptable weld joints using certain sets of process laser parameters. This study was carried out through analyzing the weld geometry, microstructure, defects and mechanical properties. The repeatability of laser welding process was also examined Laser Welding of 2-mm Thin Plates The plates were laser welded using the following process parameters: laser power (2.5 4 kw), welding speed (4 7 m/min), surface defocusing, and gap size ( mm). The following conclusions can be drawn: The optimized parameters were: laser power of 4 kw, welding speed of 6 m/min, and gap size of 0.4 mm The penetration depth, average weld width and weld area decreased with increasing welding speed. Increasing welding speed reduces porosity area percentage and the solidification cracks. A significant grain refinement is observed in the FZ due to high cooling rate. No grain coarsening occurred in the HAZ 144
158 Gap size smaller than 0.3 mm leads to irregular weld geometry with defects at crown and root. Gap size larger than 0.4 mm leads to sag and drop through defects. There is no significant effect of the gap size on the grain size or the FZ hardness. Increasing the laser power results in changing the FZ geometry from partial to full penetration welding also the keyhole changes from the blind to the open mode. This variation in keyhole mode from the blind to the open may result in changing the cooling rate and thus the grain size and hardness in the FZ. Porosity area percentage can be reduced if the open keyhole mode with suitable heat input is achieved. The transition fluctuation mode between open and close keyhole may lead to increase in porosity %. The optimized parameters for 2-mm plates resulted in a joint efficiency between 91 to 93 %. The hardness in the FZ is similar to that in the BM after a natural aging of around one year. The hardness dropped within the HAZ whose typical width was between 1.5 and 2 mm Reliability of Laser Welding Process The optimized parameters for 2 mm laser welded plates were used to verify the reliability and repeatability of laser welding process by welding 8 joints using better casting quality. The data were analyized using Weibull distribution method. The following conclusions can be drawn: Weld bead width (top width) and FZ hardness show high repeatability (m value from 39.2 to 67.7). Tensile strength and FZ total area show medium repeatability 145
159 (m value from 16.6 to 31.1). Whereas the defects and fracture elongation show low repeatability (m value from 1.9 to 3.4). Post weld heat treatment (artificial aging heat treatment - T5) has little influence on the improvement of the mechanical properties of the joints. This heat treatment causes a slight increase in the FZ hardness and higher repeatability than the as welded condition but still lower than the hardness in the BM Effect of Casting Quality on Weldability Two casting qualities were used in this study. The better quality was used for testing the reliability of laser welding process and for the study of laser welding of 6 mm plates. Better casting quality can significantly reduce the defects (porosity and crack) in the FZ. The HAZ PMZ interface for the good casting laser welded plates showed a liquation of some grain boundaries near the PMZ which was not found in the castings used in the first round of experiments. Most of the joints fractured in the HAZ PMZ interface during the tensile tests Laser Welding of 6 mm Plates The plates were laser welded using a laser power of 4 kw, welding speed (2 5 m/min), defocusing distance (0, -2, -4 mm), gap size (0, 0.2, 0.4 mm). The following conclusions can be drawn: Successful butt joints were obtained at 0, 0.2 and 0.4 mm gap sizes. For autogenous welding the welding speed was 3 m/min. For 0.2 and 0.4 mm the 146
160 welding speed was 2 m/min. The optimized defocusing was 4 mm at which good surface quality was obtained. Open keyhole mode resulted in more uniform temperature and cooling rate inside the weld pool and hence similar grain size across the plate thickness. The blind open mixed keyhole mode may increase the porosity in the FZ. Conduction mode welding may cause an increase in solidification cracks due to the wide temperature gradient inside the FZ. Laser welding with filler wire increases the losses of the reflected laser beam outside the keyhole compared with the autogenous laser welding. Excessive increase in defocusing distance leads to a surface power density to near or less than the threshold value required to form the keyhole. In general, a joint efficiency between 85 and 95 % was obtained using the optimized parameters for welding with and without filler wire. Applying filler wire caused an increase in joint efficiency by 3 to 5% Coupling and Melting Efficiencies Different concepts were used to calculate coupling, thermal and melting efficiencies using the experimental results. The following can be concluded: Laser process efficiencies for the successful joints for the 2 and 6 mm plates were around 13 and %, respectively. The corresponding coupling efficiency for 6 mm plates was significantly higher than the coupling efficiency for the 2 mm plates due to the increase in multiple reflections inside the keyhole. Increasing the welding speed leads to lower melting efficiency as long as the welding keyhole is not fluctuating between open and blind modes. 147
161 There was no significant effect of increasing the filler feed rate on the coupling and melting efficiencies. Applying filler wire leads to increase in the laser power losses by 12 %. Coupling and melting efficiencies decrease as the keyhole changes from the blind to the open mode Simulation of Laser Welding Process MATLAB program was developed to simulate the laser welding process with the physical properties and laser process parameters as inputs. This enabled the calculation of the keyhole and the weld geometries. The calculated weld bead width and penetration depth were compared with the pertinent experimental results and found in good agreement. 5.2 Contributions to Knowledge The present work provides thorough investigation for laser weldability of aerospace grade Mg alloy ZE41A-T5 using filler wire EZ33A-T5. The reliability of laser welding process has been studied using Weibull distributions. A new method was introduced to calculate the process, thermal and coupling efficiencies from the experimental weld geometry data. A MATLAB program using graphical user interface (GUI) application was developed to simulate the laser welding process (keyhole mode) by combining different models and concepts. 148
162 5.3 Recommations for Future Work More study and work is needed to understand the mechanisms of crack formation. Dual leaser beam welding can be investigated to minimize weld defects in the FZ. To increase the welding speed above 7 m/min, it is recommed to improve the feeding mechanism and the control system. Laser welding of curved and complicated geometries needs to be investigated because it is important application for the aerospace industry. For this purpose, it is essential to improve the feed-back controller to in-situ adjust the focusing parameters and the movement of the laser head. Development of smaller diameter filler wire will help to improve the positioning tolerance for the joint and hence provide more stable process. It is recommed to compare the weldability and the operational costs between laser welding at high speed high power and low speed low power for thin plates for practical purposes. Laser welding of thick plates can also be investigated using multiple pass technique. Further investigations are required to optimize the heat treatment for laser welded ZE41A-T5 plates. To improve the laser welding model, it is required to verify the absorptivity of this alloy in the liquid state at different incident angles for Nd:YAG short wavelength. Also, it is necessary to acquire some of the physical properties used in the model such as thermal conductivity, specific heat and density of the molten alloy experimentally. 149
163 References: 1. M. Dhahri, J. Masse, J. Mathieu, G. Barreau, and M. Autric: Laser Welding of AZ91 and WE43 Magnesium Alloys for Automotive and Aerospace Industries. J. Advanced Engineering Materials, Vol. 3, 2001, 2001, pp K. G. Watkins: Laser welding of magnesium alloys. Magnesium Technology 2003, Proceedings of the Symposium held during the 2003 TMS Annual Meeting, San Diego, CA, United States, 2003, pp S. Lathabai, K.J. Barton, D. Harris, P.G. Lloyd, D.M. Viano and A. McLean: Welding and Weldability of AZ31B by Gas Tungsten Arc and Laser Beam Welding Process. Magnesium Technology 2003, Proceedings of the Symposium held during the 2003 TMS Annual Meeting, San Diego, CA, United States, 2003, pp H. Friedrich, S. Schumann: Research for a New Age of Magnesium in the Automotive Industry. J. Materials Processing Technology, Vol. 117, 2001, pp Z. Sun, D. Pan, and J. Wei: Comparative Evaluation of Tungsten Inert Gas and Laser Welding of AZ31 Magnesium Alloy. J. Science and Technology of Welding and Joining, Vol. 7, No. 6, 2002, pp H. Haferkamp, M. Goede, A. Bormann, P. Cordini: Laser Beam Welding of Magnesium Alloys-New Possibilities Using Filler Wire and Arc Welding. Laser Zentrum Hannover e.v laser Assisted Net Shape Engineering 3, Proceeding of the Lane 2001, pp H. Hiraga and Tinoue: Effects of the Shielding Gas and Laser Wavelength in Laser Welding Magnesium Alloy Sheets. J. Welding International, Vol. 16, No. 6, 2002, pp H. Haferkamp, F. von Alvensleben, I. Burmester and M. Niemeyer: The Characteristics of Laser Beam Welded Magnesium Alloys. Laser Zentrum Hannover e.v, Proceeding of the Laser Material Processing Conference, ICALEO 97, 1997, pp. G/140-G/ M. Dhahri, J.E. Masse, J.F. Mathieu, G. Barreau and M. Autric: CO 2 Laser Welding of Magnesium Alloys. Proceeding of Spie The International Society For Optical Engineering, 2000, pp
164 10. M. Pastor, H. Zhao, and T. Debroy: Continuous wave Nd: Yttrium Aluminum Garnet Laser Welding of AM60B Magnesium Alloy. Journal of Laser Applications, Vol. 12, No. 3, 2000, pp R. Gradinger, P. Stolfig: Magnesium Wrought Alloys for Automotive Applications. Magnesium Technology 2003, Proceedings of the Symposium held during the 2003 TMS Annual Meeting, San Diego, CA, United States, 2003, pp Lehner, G. Reinhart and L. Schaller: Welding of Die Casted Magnesium Alloys on Production Machines. Proceeding of the Laser Material Processing Conference, ICALEO 98.C, pp. F18-F R. Galun, A. Weisheit, B. L. Mordike and C. Zellerfeld: Welding of Magnesium Alloys with a CO 2 Laser. J. Welding & Cutting, Vol. 10, 1997, pp. E146 E A. Weisheit, R. Galun and B. L. Mordike: CO 2 Laser Beam Welding of magnesium Based Alloys. Welding Journal, Vol. 77, No. 4, 1998, pp. 149-s 154-s. 15. Z. Sun, M. Kuo: Bridging the Joint with Wire Feed Laser Welding. Journal of Materials Processing Technology, Vol. 87, No 1-3, 1999, pp T. Jokinen, V. Kujanpaa: High power Nd: YAG Laser Welding in Manufacturing of Vacuum Vessel of Fusion Reactor. J. Fusion Engineering and Design, Vol. 69, No 1-4, 2003, pp H. Zhao and T. Debroy: Pore Formation During Laser Beam Welding of Die Cast Magnesium alloy AM60B Mechanism and Remedy. Welding Journal, Vol. 80, N0. 8, 2001, pp. 204-s 210-s. 18. S.A. Tsirkas, P. Papanikos, Th. Kermanidis: Numerical Simulation of the Laser Welding Process in Butt-Joint Specimens. Journal of Materials Processing Technology, Vol. 134, 2003, pp C. Dawes and C Eng: Laser Welding, McGraw-Hill, Inc. USA, W. W. Duley: Laser Welding, John Wiley & Sons, Inc. USA, A. Punkari, D.C. Weckman and H.W. Kerr: Effects of Magnesium Content on Dual Beam Nd:YAG Laser Welding of Al-Mg Alloys. J. Science and Technology of Welding and Joining, Vol. 8, No. 4, 2003, pp P.G. Sanders, J.S. Keske, K. H. Leong and G. Kornecki: High Power Nd:YAG and CO 2 Laser Welding of Magnesium. Journal of Laser Applications, Vol. 11, No. 2, 1999, pp
165 23. K.H. Leuong, G. Karnecki, P.G. Sanders and J.S. Keske: laser welding of AZ31B-H24 magnesium alloy. Proceeding of the laser materials processing conference ICALEO 98/PT.2, 1998, pp. F28 F B. A. Mickucki and J. D. Shearhouse: Proceeding of Magnesium and Magnesium Properties and Applications for Automobiles Conference, Detroit, SAE INC, 1993, pp W. A. Baeslack, S. J. Savnge, and F.H. Froes: Laser Weld Heat Affected Zone Liquation and Cracking in a High Strength Mg Based Alloy. Journal of Material Science, Vol. 5, No. 9, 1986, pp X. Cao, M. Xiao, M. Jahazi, and Y. L. Lin: Continuous Wave Nd: YAG Laser Welding of Sand-Cast ZE41A-T5 Magnesium Sand Casting: Conduction or Keyhole Mode. Proceedings of the International Symposium on Aerospace Materials and Manufacturing: Development, Testing and Life Cycle Issues-- Honoring William Wallace, 2nd, Aerospace Materials and Manufacturing: Development, Hamilton, ON, Canada, 2004, American Welding Society, American National Standard, B1.11, Cao, X. Xiao, M. Jahazi, M. Immarigeon, J.-P. Continuous Wave ND:YAG Laser Welding of Sand-Cast ZE41A-T5 Magnesium Alloys. Materials and Manufacturing Processes, Vol. 20, No. 6, 2005, pp L. G. Reinhart, and L. Schaller: Welding of Die Casted Magnesium Alloys on Production Machines, Pt. 2, Proceedings of the Laser Materials Processing Conference, ICALEO'98, Laser Institute of America, 1998, pp. F18-F European Standard: Welding Electron and Laser Beam Welded Joints Guided on Quality Levels for Imperfections Part 2, Aluminum and Its Weldable Alloys, EN ISO :2001, J.C. Borland: Generalized Theory of Super-Solidus Cracking in Welds (and Castings). Brit. Welding Research Assocn, Vol. 7, No. 8, 1960, J.C. Borland: Suggested Explanation of Hot Cracking in Mild and Low Alloy Steel Welds. Brit. Welding Research Assocn., Vol. 8, No. 11, 1960, M. Marya, G. Edwards, S. Marya, and D.L. Olson: Fundamental in the Fusion Welding of Magnesium and Its Alloys. Proceedings of the 7th JWS Int. Symp., Kobe, 2001, pp A. S. Salminen: Effect of Welding Parameters on the Efficiency and Energy Distribution during Laser Welding with Filler Wire. Proceeding of Laser 152
166 Materials Processing Conference and Laser Microfabrication Conference 92 / 93, 2001, pp H. Haferkamp, Fr.-W Bach, I Burmester, K Kreutzburg, M Niemeyer: Nd:YAG Laser Beam Welding of Magnesium Constructions. Proceedings of the International Magnesium Conference, 3rd, Manchester, UK, Apr , 1996, pp L. Abbaschian, M. Lima: Cracking Susceptibility of Aluminum Alloys During laser Welding. Journal of Material Research, Vol. 6, No. 2, 2003, pp X. Cao, M. Xiao, M. Jahazi, YL Lin: Nd:YAG Laser Welding of Magnesium Alloy Castings. Magnesium Technology 2005, Proceedings of the Symposium held during the TMS Annual Meeting, San Francisco, CA, United States, 2005, pp M. Y. Krasnoperov, R. R. G. M. Pieters, and I. M. Richardson: Weld Pool Geometry during Keyhole Laser Welding of Thin Steel Sheets. Science and Technology of Welding and Joining, Vol. 9, No. 6, 2004, pp F. Dausinger, J. Rapp, M. Beck, F. Faisst, R. Hack, and Helmut Hugel: Welding of Aluminum: a Challenging Opportunity for Laser Technology. Journal of Laser Applications, Vol. 8, No. 6, 1996, pp C. Lampa, A. F H Kaplan, J. Powell, and C. Magnusson: An Analytical Thermodynamic Model of Laser Welding. Journal of Physics D: Applied Physics, Vol. 30, No. 9, 1997, pp Z.-T. Fan and S. Ji: Low Pressure Lost Foam Pressure for Casting Magnesium Alloys. Journal of Material Science and Technology, Vol. 21, No. 6, 2005, pp R. Taghiabadi, M. Mahmoudi, M. E. Ghomy, and J. Campbell: Effect of Casting Techniques on Tensile Properties of Cast Aluminum Alloy (Al-Si-Mg) and TiB 2 Containing Metal Matrix Composite. Journal of Materials Science and Technology, Vol. 19, No. 4, 2003, pp H. Hugel: Strahlwerkzeug Laser, Eine Einfuhrung, Stuttgart, Teubner, M. Marya and G. R. Edward: Factors Controlling the Magnesium Weld Morphology in Deep Penetration Welding by CO 2 Laser. Journal of Materials Engineering and Performance, Vol. 10, No. 4, 2001, pp J. Xie: Dual Beam Laser Welding. Welding Research Journal, October, 2002, pp. 223/S-230/S. 153
167 46. D. T. Swift-Hook and A. E. F. Gick: Penetration Welding with Lasers. Welding Journal, Vol. 52, No. 11, 1973, pp. 492s 499s. 47. D. Rosenthal: The Theory of Moving Sources of Heat and its Application to Metal Treatments. Transactions of the ASME, Vol. 68, 1946, pp A. Kaplan: A Model of Deep Penetration Laser Welding Based on Calculation of the Keyhole Profile. Journal of Physics D: Applied Physics, Vol. 27, 1994, pp P. Solana and G. Negro: A Study of the Effect of Multiple Reflections on the Shape of the Keyhole of the Keyhole in the Laser Processing of Materials. Journal of Physics D: Applied Physics, Vol , pp X. Jin, L. Li and Y. Zhang: A Study on Fresnel Absorption and Reflections in the Keyhole in Deep Penetration Laser Welding. Journal of Physics D: Applied Physics, Vol. 35, 2002, pp R. Ducharme, K. Williams, P. Kapadia, J. Dowden, B. Steen and M. Glowacki: The Laser Welding of Thin Metal Sheets: an Integrated Keyhole and Weld Pool Model with Supporting Experiments. Journal of Physics D: Applied Physics, Vol. 27, 1994, pp J. Y Lee, S. H Ko, D. F Farson and C. D Yoo: Mechanism of Keyhole Formation and Stability in Stationary Laser Welding. Journal of Physics D: Applied Physics, Vol. 35, 2002, pp Y. Zhang, L. Li and G, Zhang: Spectroscopic Measurements of Plasma inside the Keyhole in Deep Penetration Laser Welding. Journal of Physics D: Applied Physics, Vol. 38, 2005, pp L. M. Leemis: Reliability Probabilistic Models and Statistical Methods, Prentice-Hall, Inc, USA, R. D. Leitch: Reliability Analysis for Engineers, Oxford University Press Inc., USA, X. Cao and J. Campbell: Effect of Precipitation of Primary Intermetallic Compounds on Tensile Properties of Cast Al-11.5Si-0.4Mg Alloy. Transactions of the American Foundrymen's Society, 2000, pp X. Cao, M. Jahazi, J.P. Immarigeon and W. Wallace: A review of laser welding techniques for magnesium alloys. Journal of Materials Processing Technology, Vol. 171, No. 2, 2006, pp Magnesium Elektron: (March ). 154
168 Appix A.1 Summary of Literature Survey laser beam metal vapor melt pool solidified material (weld) plasma part keyhole direction of motion root Laser Welding at the keyhole mode Laser Welding Modes Laser welding modes Condition Effects conduction mode keyhole mode Mixed mode laser power density < threshold value laser power density >> threshold value Laser power density the threshold value Larger HAZ small HAZ and higher welding speed causing instability in the keyhole and weld geometry. But this type of welding was not obtained when welding Mg alloys Effect s of laser power and welding speed on the weldability of Mg alloy + ( increase) - (decrease) Penetration depth and weld area Grain size Porosity losses in alloy elements Hardness residual stresses Laser power Welding speed Cracking Effects of f-number on the focusing parameters and process criticalness + ( increase) - (decrease) f - number + focal spot diameter laser power density depth of focus process criticalness
169 Microstructure in FZ and HAZ of Mg alloys. Fusion Zone HAZ Mg alloy Grain shape Grain size Grain shape Grain size most of Mg alloys cellular structure fine grains liquation of grain boundaries small WE54 globular fine grains no liquation small AZ61, AZ91 dritic fine grains liquation of grain boundaries small AZ31 coarse large grains liquation of grain boundaries large grains Porosity formation during laser welding of Mg alloys. Mg Alloy Porosity sand cast & extruded high content of Al or Zn low few large pores non vacuum producible alloy extremely high Mechanism of porosity formation of Mg alloys. R e f. M e chanis m of Poros ity formation Solution 10, 17 C oalescence and expansion of preexisting pores reducing laser heat energy 10, 17 keyhole instability may lead to porosity formation not found in M g alloy 12 C oalescence and expansion of preexisting pores reducing laser power and welding speed 24 dep on the amount of dissolved hydrogen Cracks formation during laser welding of Mg alloys. Ref. alloys sensitive to crack formation Crack type 13, 14 QE22 Solidification cracking 25 WE54 HAZ liquation cracking 13, 14 WE54 no cracks observed 5 AZ31 Solidification cracking 3 AZ31 not sensitive to solidification cracking 8 alloys that have high Al or Zn sensitive to micro cracking content Hardness in FZ and HAZ of Mg Alloys Ref. Alloy type Hardness in FZ and HAZ reasons 13, 14, 10 as - cast FZ > base metal grains refinement HAZ = Base metal no change in microstructure 13, 14 wrought FZ = base metal balance between loss in work HAZ = Base metal hardening and grain refinement 13, 14 age - hardened FZ <= base metal HAZ <= base metal as - cast FZ > base metal at higher speed welding grains refinement FZ = base metal at low speed welding no change in microstructure 9 WE43, ZE41 FZ = base metal , 9 AZ31 FZ < base metal grain growth effect HAZ < base metal grain growth effect 156
170 A.2 Weibull Distribution This distribution is very convenient as a model for various physical phenomena, applied mechanical problems; it is highly adaptable and is used widely in engineering reliability since it is two parametrical. This model also most accurately described the distribution of tensile strength. A normal distribution is symmetrical about the mean strength, whereas a Weibull distribution is skewed, showing a longer trail of low strengths and a sharper cut off at high strengths. The two parameter for of Weibull s equation can be expressed as: m ( ) o P f 1 e (A-1) Where P f is the fraction of specimens that fail at a given stress or lower. The stress o is that value at which approximately 63.2% of the population of specimens have failed, and m is a constant for that particular population known as the Weibull modulus, which is an assessment of reliability (i.e., the degree of scatter). The value of m can be obtained by taking the logarithm of equation (A-1) twice over: Ln 1 Ln[ (1 P { o f ]} m Ln( ) m Ln( ) ) 1 (1 The linear equation is a a straight line and can be plotted Ln{ Ln[ ]} P f ) (A-2) versus Ln( ) giving slop m and intercept m ). This is often referred as a Weibull Ln( o plot. Linear regression analysis is widely employed to evaluate m. The values (tensile strength) are arranged in ascing order: 157
171 1 2 3 j n A probability of failure will be assigned to each such that: P f, 1 Pf,2 Pf,3 Pf, j Pf, n Where 0 P f 1, and P f can be estimated as follows: ( j 0.5) P f N (A-3) Where N is number of specimens, j is the rank number of the specimen as arranged in the ascing order. [54, 55, 56] 158


172 A.3 Solidification Cracks for 6 mm Laser Welded Plates Figure Solidification Cracks for Sample # 29. A A B C B C Figure Solidification and Liquation Cracks for Sample


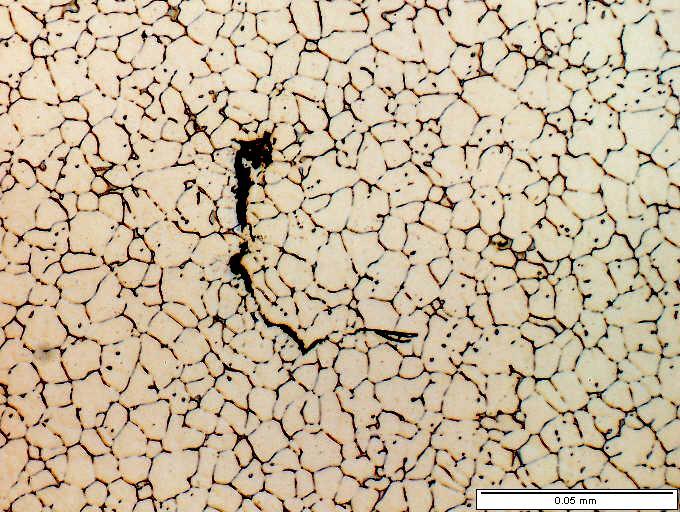
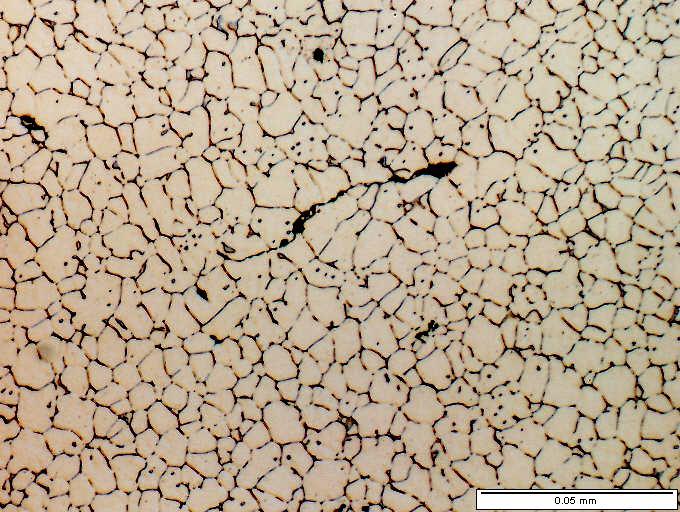
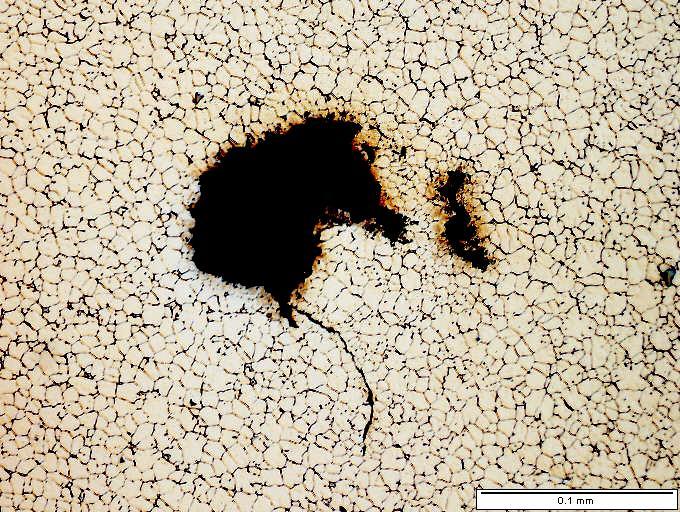
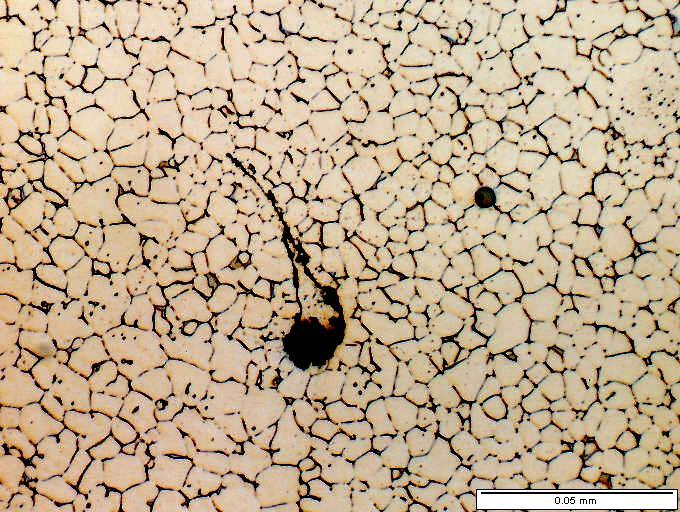
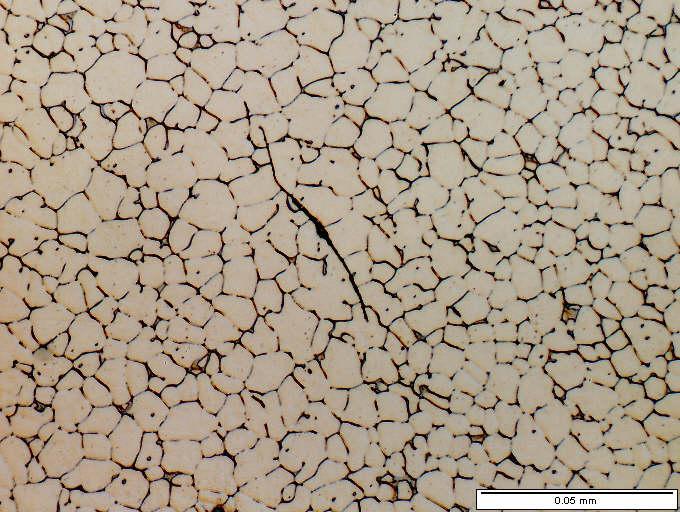
173 A A B C D E F B E C D F Figure Solidification Cracks for Sample


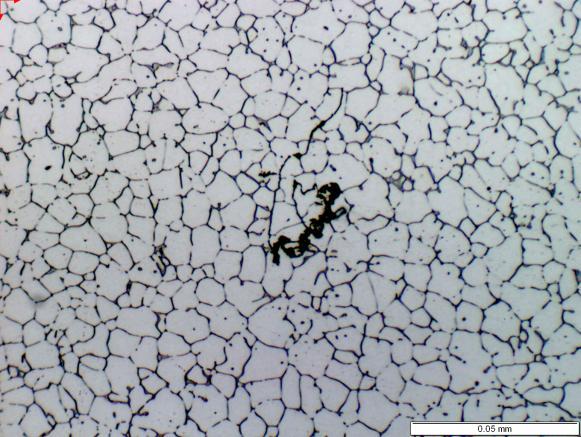
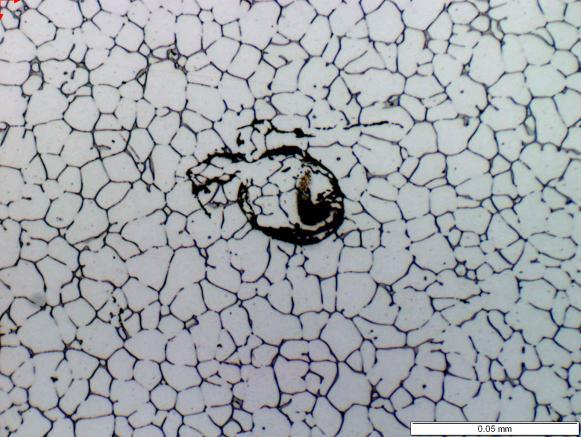
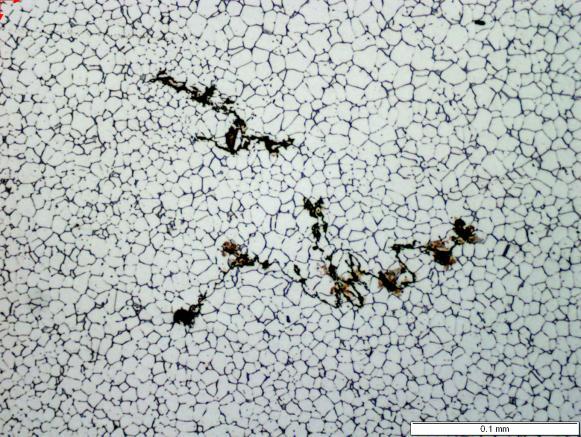
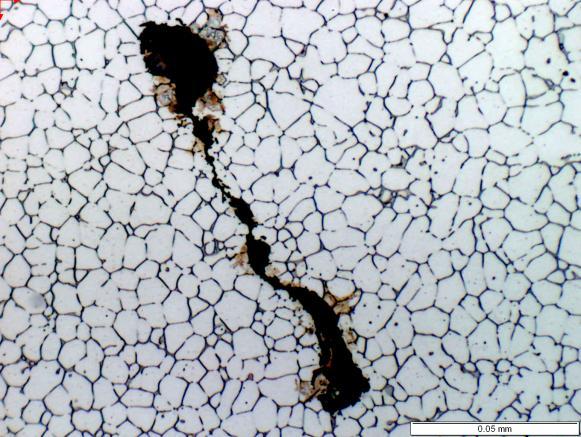
174 A B A C D E D B E C Figure Solidification Cracks for Sample
175 A.4: Physical Properties for pure Mg, ZE41A and pure Al Properties Pure Mg ZE41 Pure Al Melting Point ( o C ) 650 [57] [58] 660 [57] Thermal Conductivity ( W M -1 K -1 ) 78 melting [57] 109 room T. [58] 94 melting [57] Specific Heat ( J Kg -1 K -1 ) 1360 melting [57] 960 room T. [58] 1080 melting [57] Density ( Kg M -3 ) 1590 melting [57] 1840 room T. [58] 2385 melting [57] Boiling Point ( o C ) 1110 [2] [57] Heat of Fusion ( J Kg -1 ) 3.7 x 10 5 [57] x 10 5 [57] 162


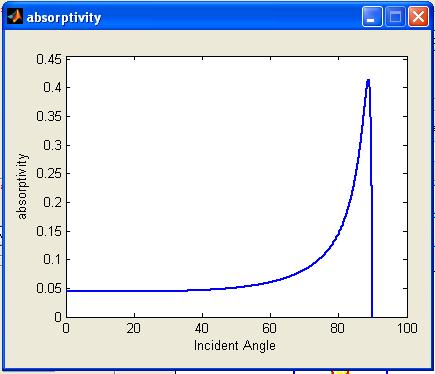
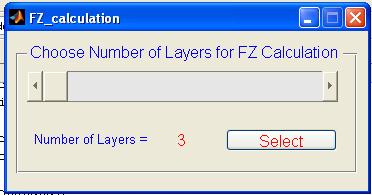
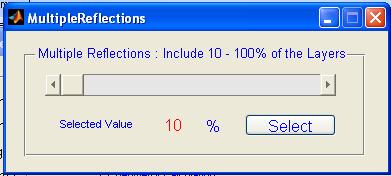
176 A.5: Simulation of Laser Welding Process Using MATLAB Programming Figure A.5.1 Graphical User Interface for the Program 163