Go back to Basic Assessment of Soil Stiffness
|
|
|
- Vanessa Burke
- 5 years ago
- Views:
Transcription
1 Go back to Basic Assessment of Soil Stiffness by Ir. Chua Chai Guan IEM Evening Talk on 18 Oct 2012
2 Presentation Outlines 1. Definition of soil stiffness 2. Assessment of basic soil properties 3. Assessment of soil stiffness from laboratory testing 4. Non-linear soil stiffness 5. Conclusions
3 Definition of Soil Stiffness
4 Definition of Stress & Strain Normal Stress Volumetric Strain Shear Stress Shear Strain
5 Definition of Stiffness Stress-Strain Behaviour Hooke s Law of Isotropic Elasticity
6 Typical Stress-Strain Curve For Soil & Definition of Tangent and Secant Modulus During loading in soils, both shear and normal stresses are likely to change simultaneously so there will be shearing and volumetric straining together. The behaviour of stressstrain for soil is largely non-linear stiffness.
7 Basic of Partial Safety Factor Limit Strain for A Mobilized Strength (after Bolton, 1993)
8 Assessment of Basic Soil Properties
9 Grading Curve for Particle Size Distribution
10 Classification of Coarse and Fine Soils (BS5950:1981) Coarse Soils % of clay & silts < 35% % of clay & silts >= 35% Fine Soils
 of boundary used to divide")

11 1 st Question to Audiences: Is 35% (after omitting boulder and cobbles) of boundary used to divide coarse and fine soils appropriate? Coarse Soils % of clay & silts < 35% % of clay & silts >= 35% Fine Soils
12 Differentiate SILT and CLAY using PI Chart PI = 0.73(LL-20)
13 Water Content and Unit Weight - The most convenient measureable parameters are water content (w) and unit weight (γ) - e = wg s for saturated soils and G s is specific gravity (~2.65 for quartz sand) γ = (G s +e)/(1+e)γ w for saturated soils - Important mechanical properties to tell-tale the soil compressibility

14 Differences of Coarse-Grained and Fine-Grained Soils Inter-particle force on contact area Activity= PI/(% by weight of clay) Self-weight force - The specific surface of clays is minimum 50,000 time more than sands - Fine-grained soils show significant volume changes as the loading and water content changes - Effects of surface forces are relatively important for finegrained soils
 where e =Vw/Vs for saturated soil, v= 1+e - Porosity = Vw/V for saturated soil Coarsegrained soils")
/(e max e min ) e max = 1.3 and e min =0.3 Densest array n =0.")
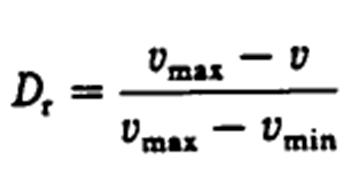
15 Packing of Coarse-Grained Soils - Specific volume (v)= V/Vs where V = the volume of a sample containing a volume Vs of soil grains - Void ratio (e) where e =Vw/Vs for saturated soil, v= 1+e - Porosity = Vw/V for saturated soil Coarsegrained soils consistency Dr e n γ kn/m 3 v.loose loose m.dense dense v.dense >0.8 <0.44 < Dr = (e max e)/(e max e min ) e max = 1.3 and e min =0.3 Densest array n =0.25 Cubic Array n =0.47
16 Range of Specific Volume for Fine-Grained Soils Type of soils specific vol void ratio porosity unit weight v e n γ kn/m3 montmorillonite Kaolin Under large loads, the specific volume of clay soils may be reduced to as little as v= 1.2 as the flat clay plate become nearly parallel
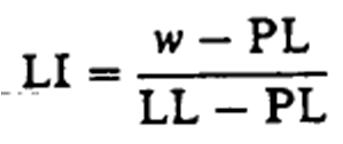
17 Atterberg Limits Basic Behaviour of Fine-Grained Soil Liquid limit determines the water content at which the soil has weakened so much it starts to flow like a liquid Plastic limit determines the water content at which the soil has become so brittle that it crumbles
18 Limits of Consistency for Soils
19 Generalized Stress-Strain Response for Various States of a Soil LI < 0 Brittle Solid or Semi Solid 0 < LI < 1 Plastic Solid LI > 0 Liquid
20 Consistency of Fine-Grained Soils Consistency Identification Undrained Strength cu, kpa SPT N, blow counts/30cm Very soft Extrudes between fingers < Soft Easily moulded in fingers Firm Stiff Moulded by strong finger pressure Cannot be moulded in fingers Very Stiff Brittle and very tough > w LL & LI = 1, c u ~ 1.5kPa and w PL & LI = 0, c u ~ 150kPa
21 Example of Good Presentation of Subsoil Profile 35% (After Lehane 2003)
22 Ground Water Table from Water Stand Pipe Monitor the Fluctuation of Water Table
23 Summary of Basic Information Required For Assessment of Soil Stiffness Information Required Soil Types Particle Size Distribution Unit Weight & Specific Gravity Moisture Content Atterberg Limit Ground Water Table Basic Properties Fine-grained & coarse-grained Dominant grain size/soil origin Stress Profile and Void Ratio & Soil Consistency Void Ratio and Soil States LL, PL and PI, LI & Soil Consistency Stress Profile & Max Stress
24 Assessment of Soil Stiffness from Laboratory

25 Constrained Modulus E oed from Oedometer
26 Typical Range of E oed for Primary Loading of NC Soils (After Janbu 1963) m = 0.5 for SAND = 0.75 for SILT = 1 for CLAY
27 E oed for Primary Loading from Porosity of NC Soils e o ~ wg s where w = natural moisture content G s = specific gravity = 2.65~2.7 n = e/(1+e)
28 E oed for Primary Loading of Coarse-Grained Soils E oed ref = 60I D MPa e max = 1.3 e min =0.3 (After Von Sooss 2002)
29 E oed for Primary Loading from Liquid Limit (Fine- Grained Soil) (After Engel 2001) c c = 0.9(w L -0.1) by Terzaghi & Peck 1967 E ref oed = 230(1+e o )/c c 1+e o ~ 2.0
/200 ~ PI/74 (after Atkinson,1993) (After Kulhawy and Mayne")
30 Compression Index (c c and c r ) vs PI c s ~ 5c c E oed ur ~ 5E oed c c =(PIxGs)/200 ~ PI/74 (after Atkinson,1993) (After Kulhawy and Mayne 1990)
31 Modulus E 50 from Drained Triaxial Test


32 Modulus E 50 using Janbu Formula E 50 =E 50 ref m = 0.5 for SAND = 0.75 for SILT = 1 for CLAY
33 Relationship Between E 50 ref and E oed ref SAND m= 0.5 E 50 =E 50 ref E oed =E oed ref = v ((1-v)/v)^0.5 (1-v)/((1-2v)(1+v)) E ref 50/E ref oed SILT m=0.75 v ((1-v)/v)^0.75 (1-v)/((1-2v)(1+v)) E ref 50/E ref oed CLAY m =1 v ((1-v)/v) (1-v)/((1-2v)(1+v)) E ref 50/E ref oed
34 Modulus E 50 u from Undrained Triaxial Test E u 50 = 3G 50 E 50 u E 50 u =200c u if ε vf = 1%
35 Modulus E 50 u from C u and Plasticity Index E u 50 = 15000C u I p % For NC Clays
36 2nd Question to Audiences: Is E u 50 a stressdependent parameter? E u 50 = 15000C u I p % For NC Clays
37 Summary for Soil Stiffness Assessment from Laboratory Test - Always be coupled with the knowledge of basic soil properties, particularly on moisture content & stress level & plasticity index (for fine-grained soil) - Loading and unloading steps are equally important - Cross-check using different tests e.g. Oedometer and Drained Triaxial Test or Undrained Triaxial Test - Cross- reference with typical range of soil stiffness for various soil types
38 Non-Linear Soil Stiffness
39 Soil Stiffness Non-linear Stress-Strain Behaviour Soils are packed with collection of grains with grading, mineralogy, shape and texture. (after Atkinson, 2000)
40 Soil Stiffness Yielding and Plastic Straining (after Atkinson, 1993) Σε = ε e +ε p ε p related to Δσ y by hardening law
41 Soil Stiffness Rigidity and Non-linearity (after Atkinson, 2000) Soil stiffness is principally related to peak strength and both of them increase with effective stress and overconsolidation -Rigidity = E o /q f =1/ε r -Non-linearity = ε f /ε r - ε r is a reference strain

42 Rigidity and Non-linearity for some common materials Rigidity Non-linearity (after Atkinson, 2000)
43 Characteristic Stiffness-Strain Behaviour very small strain (after Atkinson, 2000) small strain large strain (after Atkinson & Sallfors, 1991 and Mair, 1993)
44 Variation of Stiffness with Strain, Stress & OCR (after Atkinson 1993) (State parameters A, n, m varies for different soils
45 Parameters for Current State (Isotropic stress) volume state stress state (after Atkinson, 2000)
46 Variation of Stiffness with State Parameters for Reconstituted Kaolin Clay n = 0.65 m=0.2 A=2000 (after Viggiani & Atkinson 1995)
47 Variation of Stiffness with State Parameters for Carbonate Sand n = 0.58 A=4000 (after Jovi i & Coop, 1997)
48 Material Parameters for G o (after Viggiani & Atkinson 1995) All these parameters A, n & m are related to plasticity index
49 Typical Values of Strength and Stiffness of Soils 600MPa 80MPa 80kPa 400kPa (after Tatsuoko & Shibuya, 1992) All these parameters A, n & m are related to plasticity index
50 Variation of rigidity with state and plasticity index (after Atkinson, 2000)
51 Variation of Failure Strain with State (after Atkinson, 2000)
52 Non-linear Stress-Strain Expression for Soils ε o = 0.001% E s /E o = E s /E o = 0.2 ε = 0.1% ε o = % for low plasticity silts ε o = 0.005% for high plasticity clays ε o = % for unbonded coarse grained soils ε o = 0.02% for bonded soils and soft rocks r = 0.1 to 0.5 (after Georgiannou et al. 1991, Coop et al. 1997, Cuccovillo & Coop 1997 & Atkinson 2000)
53 Variation of E s /E o with rigidity and non-linearity E s /E o = 0.5 E s /E o = 0.2 ε = 0.1% (after Atkinson 2000)
54 Application of Non-Linear Stiffness for Design (Settlement of model foundation on sands and clay) (Stiffness-strain curve from triaxial) (after Atkinson, 2000)
55 Summary for Non-linear Soil Stiffness - Soil stress-strain behaviour is highly non-linear - Non-linear behaviour can be characterized by rigidity and degree of non-linearity - Very small strain-stiffness is measurable from field shear wave velocity or bender element test - Peak strength and failure strain measurable from routine laboratory test - Stiffness is related to its composition and to its current state
56 Conclusions - The objectives of assessment for soil stiffness should be clear particularly for the range of strain level for the targeted application (dynamic or static, small strain or large deformation) - Basic information e.g. particle composition, unit weight, moisture content, Atterberg limits and fluctuation of ground water table should be gathered for the assessment of soil stiffness - Always cross-check the measured soil stiffness using different tests or correlation to basic soil properties
57 Thank You for Your Attention