Industry Day - 16/11/17 High-Temperature Ceramic Matrix Composites (HTCMCs) using Microwave Enhanced Chemical Vapour Infiltration (MECVI)
|
|
|
- Bruno Baker
- 5 years ago
- Views:
Transcription
 using Microwave Enhanced Chemical")


1 Industry Day - 16/11/17 High-Temperature Ceramic Matrix Composites (HTCMCs) using Microwave Enhanced Chemical Vapour Infiltration (MECVI) Matt Porter Supervisors Prof. Jon Binner 1 and Dr. Clive Ponton 2 Advanced Ceramic Composites Group School of Metallurgy and Materials University of Birmingham This project is jointly funded by the Air Force Office of Scientific Research and the European Office of Aerospace Research and Development via the Composites branch of the Materials and Manufacturing Directorate of the Air Force Research Labs Award no. FA
2 Why HT-CMCs and why SiC f /SiC? Step-change in engine technology Higher temperatures and pressure ratios create higher thermal efficiency Enhanced performance Reduced emissions Decreased fuel consumption Properties to achieve this Low density High temperature performance Ceramic (technical) Increased strength and toughness Polymer (thermoset) Polymer (thermoplastic) Metal (non-ferrous) Metal (ferrous) 2

3 Maximum service temperature / C Why HT-CMCs and why SiC f /SiC? Step-change in engine technology Higher temperatures and pressure ratios create higher thermal efficiency Enhanced performance Reduced emissions Decreased fuel consumption Properties to achieve this Low density High temperature performance Ceramic (technical) Increased strength and toughness Polymer (thermoset) Polymer (thermoplastic) Metal (non-ferrous) Metal (ferrous) 2
4 Current industry methods of production Reactive melt infiltration Polymer infiltration and pyrolysis SiC fibre preform coated with carbon matrix then liquid silicon added to form SiC. Advantages Fast processing Dense matrix Disadvantages Pure silicon phases Residual thermal stresses Fibre damage from molten silicon SiC fibre impregnated with preceramic polymer then thermally decomposed to produced SiC. Advantages Stoichiometric SiC Established Wet lay up processing Disadvantages Process must be repeated Shrinkage/microcrack pores 3


5 Current industry methods of production Reactive melt infiltration Polymer infiltration and pyrolysis SiC fibre preform coated with carbon matrix then liquid silicon added to form SiC. Advantages Fast processing Dense matrix Disadvantages Residual Si Pure silicon phases Residual thermal stresses Fibre damage from molten silicon SiC fibre impregnated with preceramic polymer then thermally decomposed to produced SiC. Advantages Stoichiometric SiC Established Wet lay up processing Shrinkage pores/ microcracks Disadvantages Process must be repeated Shrinkage/microcrack pores 3

 + (n) H 2(g SiC (s) +")
6 Chemical Vapour Infiltration A variant of chemical vapour deposition (CVD), CVI is a process in which a solid matrix is deposited into a porous preform by the thermal decomposition of a reactive gaseous mixture. Advantages of CVI Low temperatures Fine grained microstructure No fibre damage Net shape manufacturing Deposition of SiC by decomposition of methyltrichlorosilane in hydrogen CH 3 SiCl 3(l) + (n) H 2(g SiC (s) + 3HCl (g) + H 2(g)
7 Chemical Vapour Infiltration A variant of chemical vapour deposition (CVD), CVI is a process in which a solid matrix is deposited into a porous preform by the thermal decomposition of a reactive gaseous mixture. Disadvantages of CVI Very slow processing Multiple machining stages Expensive products Deposition of SiC by decomposition of methyltrichlorosilane in hydrogen CH 3 SiCl 3(l) + (n) H 2(g SiC (s) + 3HCl (g) + H 2(g)


8 Proposed Solution - MECVI Potential benefits Inverse temperature profile Prevents premature pore closure* Faster processing Near-zero porosity possible Significant cost reduction Equivalent or better microstructure as CVI 5


9 MECVI research at UoB Labrotron HTE M30KB CL Pro Alumina foam Bell jar Quartz tube 6
10 H 2 :MTS= 10, Q MTS = 12 g hr -1, Q H 2= 300 ml min -1, Time = 8 hours Infiltration rate / mg min Final Porosity / Δ Porosity / Time required to fill to Temperature/ C 2 vol.% vol.% <10 vol.% porosity h Plasma formation Mass gain rate MECVI Temperature and pressure kinetics Plasma formation Untenable arcing 900 C 950 C 1000 C h h Conventional CVI MTS/SiC conversion % 5 hours Pressure // kpa mbar 0 7


11 MECVI Effect of temperature on densification profile Deposition 300 mbar, QMTS= 12 g h-1, QH2= 300 cm3 min-1, 10 mm H2:MTS= 10, Time = 8 hours 1000ºC 950ºC 900ºC 8


12 6 1000ºC CVD SiC bar 1 CVD SiC bar Thickness / no. of layers 950ºC 2 Deposit Semi conductor-2 - WDS Si 0.31 C 58. O 1.9 Si 0.31 C 58. O 1.9 Si 1.08 C 57. O 1.7 Si 2.30 C O 1.67 Thickness / no. of layers Sample10 Si/C ratio Si/C ratio Stoichiometric0.8 and rich 0.7 SiSi rich -6 Si/C ratio Radius /mm 0.70 Si/C ratio Thickness /no. of layers Joel Stoichiometric Radius /mm 0.72 Si/C ratio 10 Deposit Thickness /no of layers 8 Si/C ratio ºC 0 MECVI Composition mapping (WDS) Radius /mm C rich 9

13 Intensity/ a.u. MECVI Composition mapping (Raman) C, 950 C, 1000 C at cross section mid point H 6H 3C, H, 6H, 2R and 15R C- (D) C- (G) Si AVG. LIT. PEAK ID DATA/cm -1 SiC - 3C 790; 980 SiC - H 200; 790; 980 SiC - 6H 510;790; 980; SiC - 2R ; 980 SiC - 15R 770; 980 Si 520 C- D 1350 C - G Raman shift/ cm -1 XRD still needs to be done 10
14 Temperature CVI/CVD Literature Reactant Molar Ratio CVI/CVD Literature >1300 C >70 Stoichiometric SiC Carbon excess 1000 C Stoichiometric SiC Carbon excess 950 C C Silicon excess 850 C ~MTS decomposition temperature
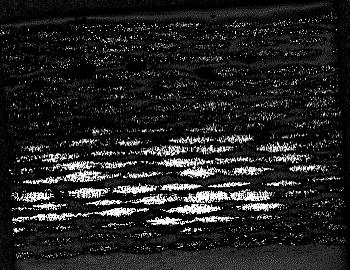
15 TEM and morphology results: mbar Fibre Matrix [111] Pore [222] [022] [002] [113] Fibre Green = [111] Red = [002] 2 nm -1 12

![Pore [222] [022] [002] [113]](/docs-images/90/101225131/images/16-16.jpg "Fibre Green = [111] Red = [002] 2")
16 TEM and morphology results: mbar Fibre Matrix [111] Pore [222] [022] [002] [113] Fibre Green = [111] Red = [002] 2 nm -1 12
17 TEM and morphology results: mbar Fibre Matrix Green = [111] Red = [002] Blue = [022] 2 nm -1 13

18 TEM and morphology results: mbar Fibre Matrix Green = [111] Red = [002] Blue = [022] 2 nm -1 13
19 TEM and morphology results: mbar Fibre Matrix Fibre Green = [111] Red = [002] Blue = [022] 2 nm -1 1

20 TEM and morphology results: mbar Fibre Matrix Fibre Green = [111] Red = [002] Blue = [022] 2 nm -1 1


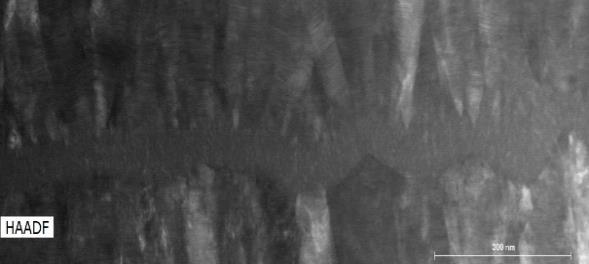

21 TEM Matrix observations 1000 C Matrix 61nm Fibre XMat Industry Day, IOM3, 16/11/17 15


![[111] and [002] directions](/docs-images/90/101225131/images/22-13.jpg "Grains grow perpendicular to")
22 Conclusions Efficiencies of 28% can be achieved using MECVI Mass gain doubles for each increase in temperature by 50 C Increasing pressure shows a linear increase in mass 900ºC produces an inverse densification profile Higher temperatures show a more uniform deposition Stoichiometric SiC has been produced SiC deposit has strong texturing in the [111] and [002] directions Grains grow perpendicular to fibre surface Matrix merging forms nano-pores 16
23 Future work Observe the effect of the H 2 flow rate on the kinetics and the ratio of reactants Shorter runs to determine the densification profile at higher temperatures Choose the processing parameters for the optimum densification of the SiC f and SiC f /SiC p preforms Investigated a multistep approach: MECVI Slurry impregnation MECVI to densification Staged pressure increase Staged temperature increase Combinations of all of the above Fluid flow modelling of reactants Full densification of samples Mechanical, physical and thermal property characterisation 17
24 Thank you for listening. Acknowledgements; Andrea D Angio (Ph.D student, UoB) Prof. Jon Binner and Dr. Clive Ponton (UoB) Dr. Pavel Mogilevsky (AFRL, USA) and Dr. Mike Cinibulk (AFRL, USA) 18