A general and facile strategy for precisely controlling the crystal size. of monodispersed metal-organic frameworks via separating the
|
|
|
- Loreen Lane
- 5 years ago
- Views:
Transcription
1 Electronic Supplementary Material (ESI) for ChemComm. This journal is The Royal Society of Chemistry 2017 A general and facile strategy for precisely controlling the crystal size of monodispersed metal-organic frameworks via separating the nucleation and growth Xiaocheng Lan, Ning Huang, Jinfu Wang, Tiefeng Wang* Beijing Key Laboratory of Green Reaction Engineering and Technology Department of Chemical Engineering, Tsinghua University, Beijing , China * Corresponding Author: Tel.: Fax: wangtf@tsinghua.edu.cn (T. F. Wang)
2 Experimental details 1. Precise control of the crystal size of MOFs 1.1 ZIF-8 A desired amount of Zn(NO 3 ) 2 6H 2 O (x mmol, 11.1 mmol/l Zn 2+ /Methanol solution) was preadded to 250 ml methanol containing 2.05 g 2-methyl imidazole (25 mmol). The value of x varied in the range of mmol to give R = 0, , , and , where R was the mole ratio of (pre-added Zn 2+ ) / (total ligand). After ultrasonic treatment for 10 min, the solution was well mixed with 250 ml methanol containing 3.67 g Zn(NO 3 ) 2 6H 2 O (12.5 mmol) and kept at room temperature without stirring for 24 h. The precipitated ZIF-8 was washed with methanol three times and vacuum-dried for 12 h at room temperature. 1.2 Zn 50 Co 50 -BMOF A desired amount of Zn(NO 3 ) 2 6H 2 O (x mmol) was pre-added to 80 ml methanol containing 3.70 g 2-methyl imidazole (45 mmol). The value of x varied from 0 to 0.30 mmol to give R = 0, , and , where R was the mole ratio of (pre-added Zn 2+ ) / (total ligand). After ultrasonic treatment for 10 min, the solution was well mixed with 80 ml methanol containing 0.84 g Zn(NO 3 ) 2 6H 2 O (2.83 mmol) and 0.84 g Co(NO 3 ) 2 6H 2 O (2.89 mmol) and kept at room temperature with vigorous stirring for 24 h. The precipitated Zn 50 Co 50 -BMOF was washed with methanol three times and vacuum-dried for 12 h at room temperature. 1.3 Zn 20 Co 80 -BMOF Similarly, x mmol of Zn(NO 3 ) 2 6H 2 O was pre-added to 80 ml methanol containing 3.70 g 2- methyl imidazole (45 mmol). The value of x varied from 0 to 0.30 mmol to give R = 0, , and , where R was the mole ratio of (pre-added Zn 2+ ) / (total ligand). After ultrasonic treatment 1
3 for 10 min, the solution was well mixed with 80 ml methanol containing 0.34 g Zn(NO 3 ) 2 6H 2 O (1.14 mmol) and 1.34 g Co(NO 3 ) 2 6H 2 O (4.60 mmol) and kept at room temperature with vigorous stirring for 24 h. The precipitated Zn 20 Co 80 -BMOF was washed with methanol three times and vacuum-dried for 12 h at room temperature. 1.4 NPs@ZIF-8 PVP-stabilized metal nanoparticles (Pt, Pd, Ru, and Rh) The metal nanoparticles were prepared by a method modified from the literature 1. For the synthesis of Pt NPs, 5 ml of NaOH/ethylene glycol (EG) solution (0.3 M) was mixed with 5 ml of H 2 PtCl 6 6H 2 O/EG (0.02 M) at room temperature. After adding 100 mg polyvinylpyrrolidone (PVP, MW = ), the solution was heated to 150 o C and kept at this temperature with vigorous stirring for 3 h to form a homogeneous black Pt/EG solution. The Pt NPs obtained were washed with ethanol and hexane three times, collected by centrifugation and finally dispersed in methanol. Other metal nanoparticles were prepared using the same procedure described above except for the following differences: (a) For Pd NPs, the solution was heated to 100 o C and kept at this temperature for 1 h; (b) For Rh NPs, the solution was heated to 160 o C and kept at this temperature for 3 h; (c) For Ru NPs, the solution was heated to 180 o C and kept at this temperature for 3 h. Precise control of the crystal size of NPs@ZIF-8 (NPs = Pt, Pd, Ru, and Rh) The NPs/methanol solution was added into 250 ml methanol containing 2.05 g 2-methyl imidazole (25 mmol) followed by ultrasonic treatment for 10 min. Then x mmol of Zn(NO 3 ) 2 6H 2 O (11.1 mmol/l Zn 2+ /Methanol solution) was pre-added to the above solution. The value of x varied from 0 to 0.22 mmol to give R = 0, , , , and , where the R was the mole ratio of (pre-added Zn 2+ ) / (total ligand). After ultrasonic treatment for another 10 min, the solution 2

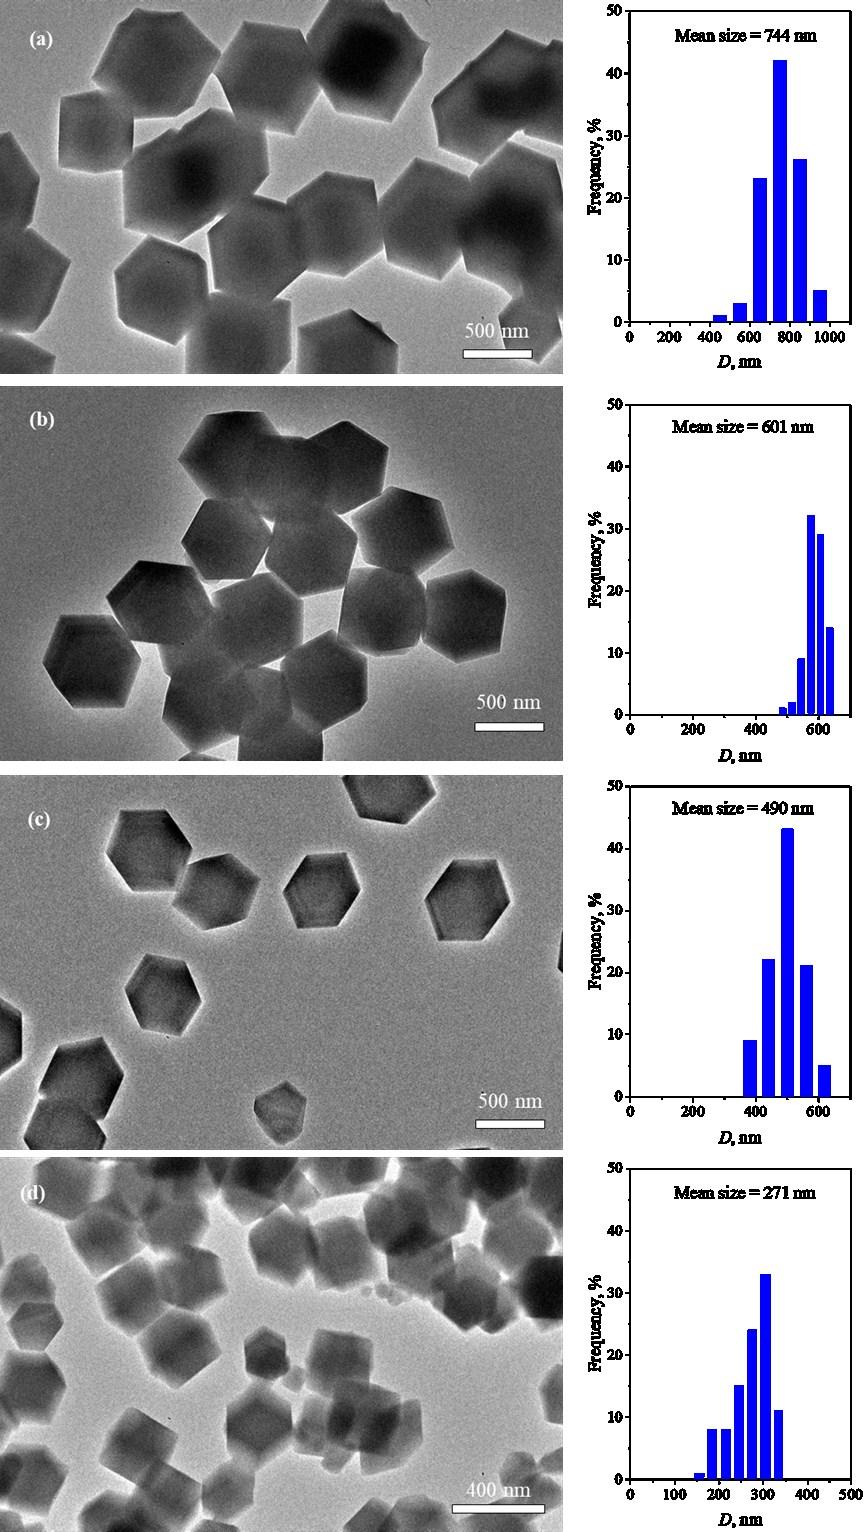
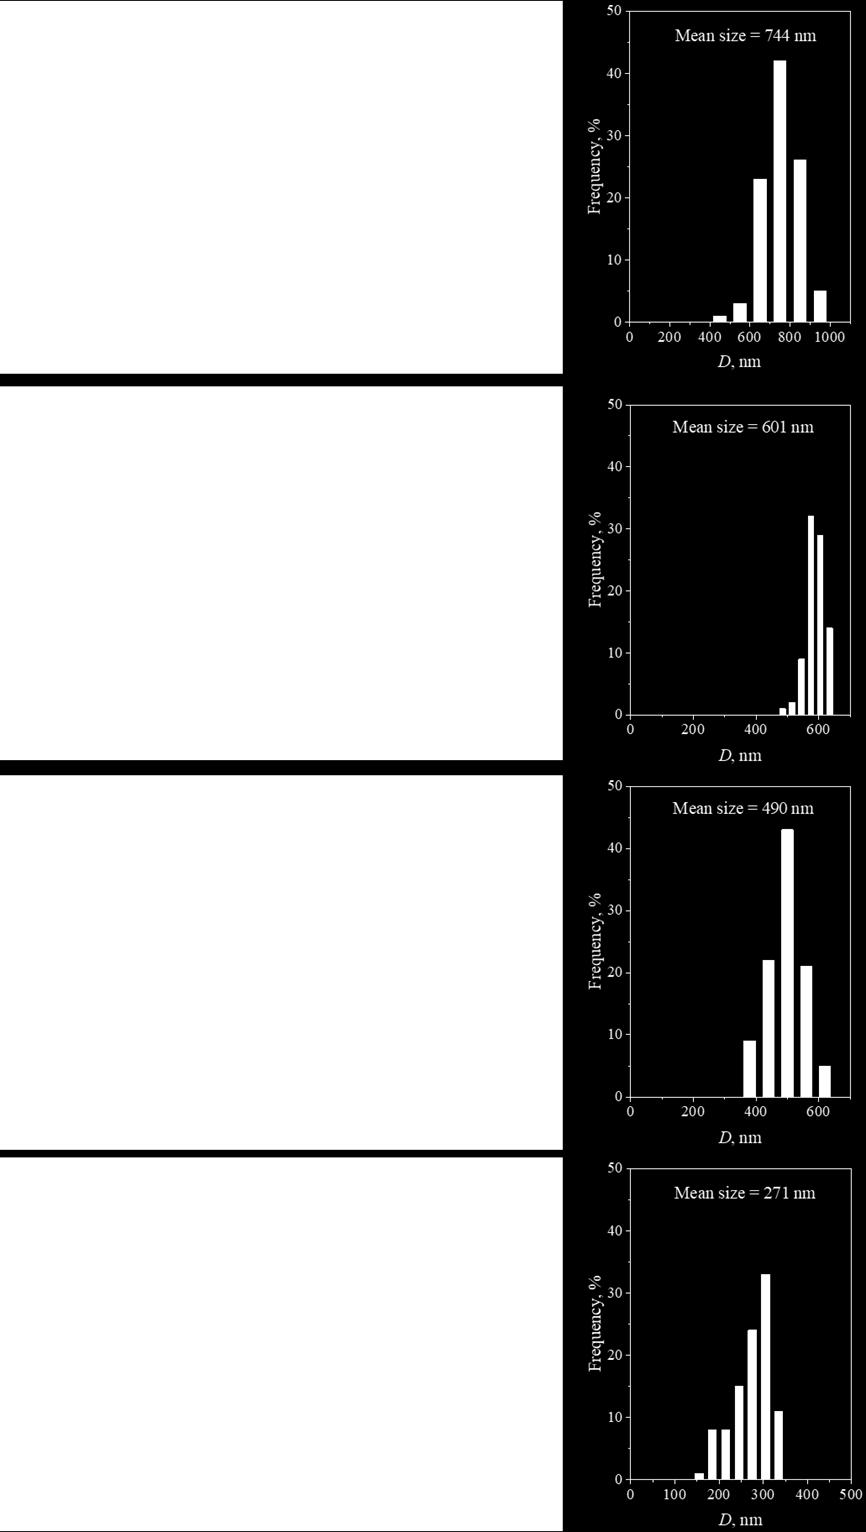
4 was well mixed with 250 ml methanol containing 3.67 g Zn(NO 3 ) 2 6H 2 O (12.5 mmol) and kept at room temperature without stirring for 24 h. The precipitated NPs@ZIF-8 was washed with methanol three times and vacuum-dried for 12 h at room temperature. 2. Catalyst characterization The X-ray diffraction (XRD) powder patterns of MOFs were characterized by a Bruker Advance D8 X-ray diffractometer with Cu Kα (λ = Å) monochromatic radiation, where the samples were prepared by tableting the powder on a single crystal Si substrate. The actual loading of Pt on Pt@ZIF-8 was measured by inductively coupled plasma (ICP) analysis, where the metals were dissolved by boiling the catalyst powders in aqua regia. HR-TEM images, elemental mapping, and EDS of the MOFs were obtained by high-resolution transmission electron microscopy (JEM 2014) operated at 120 kv, where the samples were ultrasonically dispersed in ethanol for 30 min and the solution was dropped on a carbon film supported on a copper grid. The single crystals of ZIFs showed a polygonal structure in the TEM images. For consistent comparison, the length of c 1 was used as the particle size of ZIFs (Fig. S1). More than 100 particles were collected to analyze the particle size distribution of MOFs. The N 2 adsorption isotherms were obtained at -196 o C on an Autosorb-IQ 2 -MP-C system (Quantachrome, USA). Before analysis, the samples were evacuated at room temperature for 10 h. Thermogravimetric analyses (TGA) were carried out using TGA/DSC1/1600LF with a heating rate of 10 o C/min. Figure S1. The length of c 1 was used as the particle size of ZIFs. 3
5 3. Catalytic experiments The hydrogenation experiments of 1-hexene, cyclohexene and cyclooctene were carried out at 23 o C and 1.2 MPa hydrogen pressure. In a typical experiment, 23 mg catalyst, 30 ml ethanol and 0.3 g reactant (1-hexene, cyclohexene or cyclooctene) were loaded in an autoclave. After purging with hydrogen 5 times, the autoclave was flushed with hydrogen to 1.2 MPa and stirring at 800 r/min. The conversion was calculated as: Conversion (%) = (N A,0 N A,t ) / N A,0 (1) where N A,0 was the initial mole of reactant in feeding stream, and N A,t was the mole of reactant after reaction. The reaction rate based on the total weight of Pt was calculated at the conversion about 50 % by: r = (m 1-hexene X) / (t m cat W metal ) (s -1 ) (2) where m 1-hexene was the initial weight of 1-hexene, X was the accurate conversion around 50%, t was the reaction time, m cat was the catalyst weight, and W metal was the Pt metal loading. 4
6 5
 ZIF-8_744, (b) ZIF-8_601,")
7 Figure S2. TEM images and crystal size distribution of ZIF-8: (a) ZIF-8_744, (b) ZIF-8_601, (c) ZIF-8_490, (d) ZIF-8_271, (e) ZIF-8_93, (f) ZIF-8_43 and (g) ZIF-8_27. 6
 Zn 50 Co 50")
8 Figure S3. TEM images and crystal size distribution of Zn 50 Co 50 -BMOF: (a) Zn 50 Co 50 - BMOF_128, (b) Zn 50 Co 50 -BMOF_71, and (c) Zn 50 Co 50 -BMOF_46. 7

 Zn 20 Co 80")
9 Figure S4. TEM images and crystal size distribution of Zn 20 Co 80 -BMOF: (a) Zn 20 Co 80 - BMOF_231, (b) Zn 20 Co 80 -BMOF_71, and (c) Zn 20 Co 80 -BMOF_52. 8

 Pt@ZIF-8_204, (c) Pt@ZIF-8_111, (d)")
10 Figure S5. TEM images and crystal size distribution of crystal; (a) (b) (c) (d) and (e) 9
11 (d) ZIF-8_27 Intensity (c) ZIF-8_271 (b) ZIF-8_490 (a) ZIF-8_ (degree) Figure S6. XRD Patterns of ZIF-8: (a) ZIF-8_744, (b) ZIF-8_490, (c) ZIF-8_271, and (d) ZIF- 8_27. (c) Zn 50 Co 50 -BMOF_46 Intensity (b) Zn 50 Co 50 -BMOF_71 (a) Zn 50 Co 50 -BMOF_ degree Figure S7. XRD patterns of Zn 50 Co 50 -BMOF: (a) Zn 50 Co 50 -BMOF_128, (b) Zn 50 Co 50 -BMOF_71, and (c) Zn 50 Co 50 -BMOF_46. 10
12 (c) Zn 20 Co 80 -BMOF_52 Intensity (b) Zn 20 Co 80 -BMOF_71 (a) Zn 20 Co 80 -BMOF_ (degree) Figure S8. XRD patterns of Zn 20 Co 80 -BMOF; (a) Zn 20 Co 80 -BMOF_231, (b) Zn 20 Co 80 -BMOF_71, and (c) Zn 20 Co 80 -BMOF_52. (e) Pt@ZIF-8_45 Intensity (d) Pt@ZIF-8_60 (c) Pt@ZIF-8_111 (b) Pt@ZIF-8_204 (a) Pt@ZIF-8_ degree Figure S9. XRD patterns of Pt@ZIF-8 crystal. (a) Pt@ZIF-8_440, (b) Pt@ZIF-8_204, (c) Pt@ZIF-8_111, (d) Pt@ZIF-8_60, and (e) Pt@ZIF-8_45. 11
13 Samples Co:Zn mole ratio (EDS) (a) Zn 50 Co 50 -BMOF_128 56:44 (b) Zn 50 Co 50 -BMOF_71 54:46 (c) Zn 50 Co 50 -BMOF_46 47:53 Figure S10. HRTEM images, elemental mappings, and EDS resutls of Zn 50 Co 50 -BMOF: (a) Zn 50 Co 50 -BMOF_128, (b) Zn 50 Co 50 -BMOF_71, and (c) Zn 50 Co 50 -BMOF_46 12
 Zn 20 Co 80 -BMOF_231, (b) Zn 20 Co 80 -BMOF_71, and (c) Zn 20 Co 80")
14 Samples Co:Zn mole ratio (EDS) (a) Zn 20 Co 80 -BMOF_231 79:21 (b) Zn 20 Co 80 -BMOF_71 76:24 (c) Zn 20 Co 80 -BMOF_52 69:31 Figure S11. HRTEM images, elemental mapping, and EDS resutls of Zn 20 Co 80 -BMOF: (a) Zn 20 Co 80 -BMOF_231, (b) Zn 20 Co 80 -BMOF_71, and (c) Zn 20 Co 80 -BMOF_52. 13
15 N 2 uptake, cc/g (1) (a) Pt@ZIF-8_440 (b) Pt@ZIF-8_204 (c) Pt@ZIF-8_111 (d) Pt@ZIF-8_60 (e) Pt@ZIF-8_45 (f) pure ZIF-8 Pore size distribution, cc nm -1 g (2) (f) ZIF-8 (e) Pt@ZIF-8_45 (d) Pt@ZIF-8_60 (c) Pt@ZIF-8_111 (b) Pt@ZIF-8_ P/P 0 0 (a) Pt@ZIF-8_ Pore width, nm Figure S12. N 2 adsorption isotherms (1) and size distribution (2) of the catalysts at 77 K: (a) Pt@ZIF-8_440, (b) Pt@ZIF-8_204, (c) Pt@ZIF-8_111, (d) Pt@ZIF-8_60, and (e) Pt@ZIF-8_45, and (f) pure ZIF-8. The N 2 isotherms were Type I, except that with Pt@ZIF-8_X (X =204, 111, 60 and 45) there was a sudden increase in the high relative pressure region (near P / P 0 = 1). This sudden increase was ascribed to physisorbed liquid nitrogen on the external surface of the crystal or interparticle mesopores 3. The pore size distributions of the catalysts were shown in Fig. S12 (2). All of the Pt@ZIF-8 samples showed the typical pore size distribution of ZIF-8, indicating that the incorporation of Pt NPs into ZIF-8 did not alter the pore-size distribution of the ZIF-8 matrix. Value, % Pt@ZIF-8_440 Pt@ZIF-8_204 Pt@ZIF-8_111 Pt@ZIF-8_60 Pt@ZIF-8_ T, o C Figure S13. TGA analysis curves of Pt@ZIF-8 in air. The TGA curves of Pt@ZIF-8_X (X = 2, 5, 10 and 20) were identical to that of Pt@ZIF- 8_440, where the initial decomposition temperature was about 300 o C. 14
 Pt@ZIF-8_440, (b)")
16 Figure S14. HRTEM images of the fringes of the catalysts: (a) (b) (c) (d) and (e) 15

 Pt@ZIF-8_60, and (e) Pt@ZIF-8_45.")

17 Figure S15. TEM images of the samples in solution after the addition of Zn 2+ : (a) Pt@ZIF-8_440, (b) Pt@ZIF-8_204, (c) Pt@ZIF-8_111, (d) Pt@ZIF-8_60, and (e) Pt@ZIF-8_45. (Scale bars are 20 nm) Figure S16. Photographs at different times of the growth process of Pt@ZIF-8: (a) Pt@ZIF-8_440, (b) Pt@ZIF-8_204, (c) Pt@ZIF-8_111, (d) Pt@ZIF-8_60, and (e) Pt@ZIF-8_45 16
.")
18 Figure S17. Effect of metal loading on the size modulation of at R = : (a) 1.0%-Pt@ZIF-8, (b) 0.5%-Pt@ZIF-8, (c) 0.1%-Pt@ZIF-8, and (d) 0.05%-Pt@ZIF-8. For 1.0%-Pt@ZIF-8 and 0.5%-Pt@ZIF-8, the Pt NPs were sufficient for the nucleation process with R = , thus the crystals had a similar narrow distribution and mean particle size (~110 nm). However, when the metal loading was further decreased to 0.1% and 0.05% 17
 Ru@ZIF-8 (R = 0), (b) Ru@ZIF-8 (R = 0.0044), (c) Pd@ZIF-8 (R = 0), (d) Pd@ZIF-8 (R = 0.0044), (e) Rh@ZIF-8 (R = 0), (f) Rh@ZIF-8 (R = 0.0044). 18")
19 and the number density of seeds was limited by the amount of Pt NPs, thus the crystal size only decreased to nm and showed a wider distribution. Figure S18. TEM images of M@ZIF-8 with size controlling: (a) Ru@ZIF-8 (R = 0), (b) Ru@ZIF-8 (R = ), (c) Pd@ZIF-8 (R = 0), (d) Pd@ZIF-8 (R = ), (e) Rh@ZIF-8 (R = 0), (f) Rh@ZIF-8 (R = ). 18
20 Table S1. Reproducibility of with R = R, 10 3 Run 1# Run 2# Run 3# Particle size, nm ± ± ±11.2 Table S2. Catalyst characterization. Samples R a, 10 3 Pt loading b, % D c, nm W d, g BET, m 2 /g V microe, cm 3 /g Pt@ZIF-8_ Pt@ZIF-8_ Pt@ZIF-8_ Pt@ZIF-8_ Pt@ZIF-8_ a R is the mole ratio of (pre-added Zn 2+ )/ (total ligand), b metal loading determined by ICP analysis, c D is the average diameter of the samples measured from TEM images, d W is the final weight of the products, e V micro is the micropore volume calculated by the HK method The Brunauer Emmett Teller (BET) surface area and micropore volume (V micro ) are summarized in Table 1. Pt@ZIF-8_X has a slightly smaller BET surface area than pure ZIF-8 (1901 m 2 /g) due to the encapsulation of Pt NPs 2. Table S3. Comparison of catalysts in hydrogenation of 1-hexene, cyclohexene and cyclooctene. Catalysts t, h Conversion, % 1-hexene cyclohexene cyclooctene Pt-0.32/SiO Pt-1.05@ZIF-8_ Pt-1.18@ZIF-8_ Pt-1.04@ZIF-8_ Pt-1.03@ZIF-8_ Pt-1.01@ZIF-8_
21 Table S4. Reaction rates (r) based on the total weight of Pt at a conversion of about 50%. Samples Crystal size (D), nm Reaction rate (r), s -1 Pt-1.05@ZIF-8_ Pt-1.18@ZIF-8_ Pt-1.04@ZIF-8_ Pt-1.03@ZIF-8_ Pt-1.01@ZIF-8_ References 1. Lan, X.; Wang, T.; Li, X.; Huang, N.; Wang, J., Catal. Sci. Technol. 2016, 6, Lu, G.; Li, S.; Guo, Z.; Farha, O. K.; Hauser, B. G.; Qi, X.; Wang, Y.; Wang, X.; Han, S.; Liu, X., Nature Chem. 2012, 4, (a) Cravillon, J.; Nayuk, R.; Springer, S.; Feldhoff, A.; Huber, K.; Wiebcke, M., Chem. Mater. 2011, 23, (b) Diring, S.; Furukawa, S.; Takashima, Y.; Tsuruoka, T.; Kitagawa, S., Chem. Mater. 2010, 22,