CE 221: MECHANICS OF SOLIDS I CHAPTER 3: MECHANICAL PROPERTIES OF MATERIALS
|
|
|
- Shon Greene
- 5 years ago
- Views:
Transcription
1 CE 221: MECHANICS OF SOLIDS I CHAPTER 3: MECHANICAL PROPERTIES OF MATERIALS By Dr. Krisada Chaiyasarn Department of Civil Engineering, Faculty of Engineering Thammasat university
2 Outline Tension and compression test Stress-strain diagram Stress-strain behaviour of ductile and brittle materials Hooke s law Strain energy Poisson s ratio Shear stress-strain diagram
3 The Tension and Compression Test The strength of a material depends on its ability to sustain a load without undue deformation or failure This property is inherent, and can be determined by experiment, otherwise, we will need to study micromechanics The tension and compression test is used to determine the relationship between the average normal stress and average normal strain in engineering materials, e.g. metals, ceramics, polymers and composites

4 The Tension and Compression Test A specimen of the material is made into a standard shape and size Circular cross-section with enlarged ends to ensure failure not occur at the grips Two punch marks with a constant crosssectional area A 0 and gauge length L 0 Strain gauges are placed at the middle section of the specimen

5 The Tension and Compression Test A specimen is then placed in a machine and stretched at a very slow constant rate until it fails The load P is recorded, The elongation δ = L L 0 between the punch marks will be measured using extensometer δ is used to calculate the average normal strain Or the strain gauge is used directly to measure strain The electrical wire is experiencing the same strain and causes the resistance in electrical wire to change, hence the resistance in the wire can be converted to strain
6 The Stress-Strain Diagram Normally, specimen may not be made into specific size, hence the stress-strain diagram is reported instead to study the material properties of a specimen

7 Conventional Stress-Strain Diagram Nominal or engineering stress assumes the stress is constant over the cross section and throughout the gauge length Hence, for the nominal stress, the applied load P is divided by the specimen s original cross-sectional area A 0 Likewise, nominal or engineering strain, the elongation δ is divided by the original gauge length L 0
8 The Conventional Stress-Strain Diagram The conventional stress-strain diagram is to plot the corresponding values of σ and ε The diagram of a particular material will be similar but not identical due to Slight material s composition Microscopic imperfections The way it is manufactured The rate of loading The temperature
9 The stress-strain diagram - steel Elastic Behaviour The curve is a straight line throughout the region Stress is proportional to strain The material is said to be linearelastic The upper stress is called the proportional limit σ pl After this point, the curve will bend and continue to elastic limit σ Y If the load is removed, the specimen will return to its original shape For steel σ pl and σ Y is very similar, and hard to detect

10 The stress-strain diagram - steel Yielding The material will break down and cause it to deform permanently The stress at this point is called yield stress or yield point σ Y The deformation is called plastic deformation For carbon steel, the upper yield point occurs first, then a decrease in load-carrying capacity to a lower yield point At yield point, the specimen continues to elongate without increase in load, this is called perfectly plastic

11 The stress-strain diagram - steel Strain hardening An increase in load can be seen The load rises until it reaches a maximum stress called ultimate stress σ u Necking The specimen continues to elongates but the cross-sectional area starts to decrease The decrease is uniform over the gauge length The neck will form and the specimen continues to elongate until it breaks at the fracture stress, σ f

12 True Stress-Strain Diagram Actual cross-sectional area is used and instant load is measured This produces actual true stress-strain diagram When the strain is small, the conventional and true stressstrain diagram coincide The differences is during the strain-hardening range The large divergence is seen within the necking region, the specimen support a decreasing load. But the material actually sustains increasing stress until failure
13 Engineering Design Normally, most engineering design is done within the elastic range. This range, the strain is very small, hence the error using the true and conventional values is very small, about 0.1%
14 Stress-Strain Behaviour of Ductile and Brittle Materials Any material that can be subjected to large strains before it fractures is called a ductile material. Example, mild steel The percentage elongation is the specimen s fracture strain expressed as a percent. The percent reduction in area can also be used to specify ductility About 38% for a mild steel for percentage elongation and 60%for percentage reduction in area
15 Ductile material Yielding occurs at constant stress Most metals do not exhibit constant yielding, and yield point is not easy to define. Normally, a yield strength is define using an offset method, where a 0.2% strain is offset, and a parallel is drawn to define a yield strength 1 ksi = 6.89 MPA E.g. brass, molybdenum, zinc, aluminium
16 Ductile material Yield strength is not a physical property, but it is a stress that causes permanent strain Here, we assume yield strength, yield point, elastic limit, proportional limit all coincide Except rubber, which nonlinear elastic behavior Wood is moderately ductile, varies from species to species Wood is directional material

17 Brittle Materials Material exhibit little or no yielding before failure Example, gray cast iron, concrete Can withstand much higher compressive stress Cracks and imperfections tend to close up and bulge out For concrete, compressive stress is 12.5 times greater than tensile strength
18 Hooke s Law Most engineering materials exhibit a linear relationship between stress and strain within the elastic range. Robert Hooke discover the law in 1676, and created Hooke s law E is called modulus of elasticity or Young s Modulus, named after Thomas Young E is the slope of initial straight-line of the stress-strain diagram, up to the proportional limit E has the same unit as σ
19 Hooke s Law For steel alloy, from soft steel to hardest steel, E is about 200 Gpa E can only be used in material with linear elastic behaviour If the stress is greater than the proportional limit, the stress-strain diagram is not a straight, so E is no longer valid
20 Strain Hardening If a specimen of ductile material is loaded to the plastic range, then unloaded, the elastic strain is recovered, but the plastic strain remains. Hence the material is subjected to a permanent set. When the material is loaded again, it still continue along the elastic line, but the yield point will be higher. It then has greater elastic range, but less plastic region

21 Strain Energy During deformation, a material store energy internally throughout its volume This is called strain energy
22 Strain Energy The strain energy per unit volume or strain-energy density For a linear elastic material, Hooke s law applies, hence
23 Modulus of Resilience When the stress σ reaches the proportional limit, the strain-energy density is referred to as the modulus of resilence It s the shaded triangular area under the diagram. It is the physical property of a material indicating the ability of the material to absorb energy without any permanent damage to the material

24 Modulus of Toughness This quantity in the entire area under the stress-strain diagram. It indicates the strain energy density of the material just before it fractures This is an important properties when designing a member that may be overloaded. For steel, by changing the carbon in steel, the diagram will change, hence the modulus of resilience and toughness will change
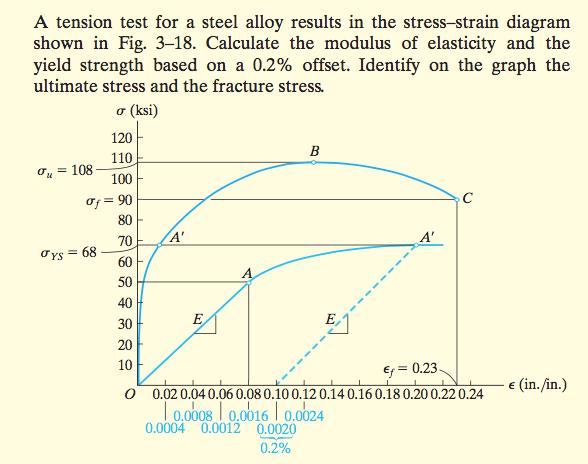
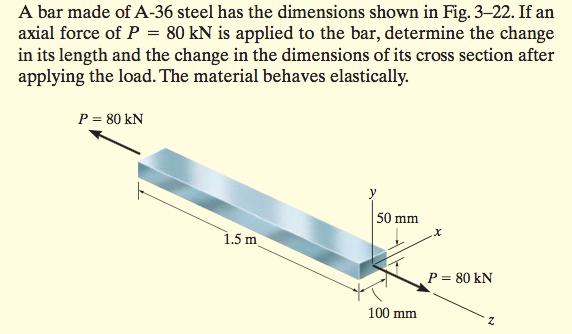
25 Example
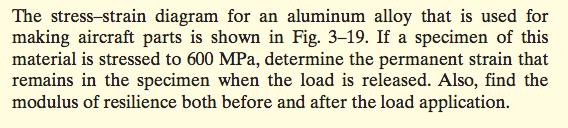
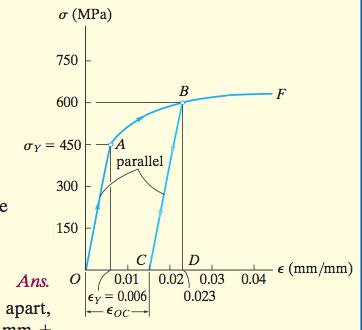
26 Example
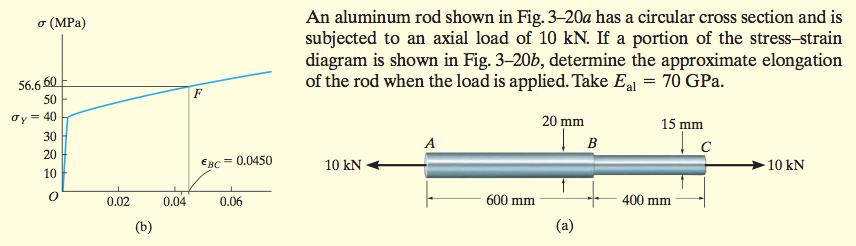
27 Example
28 Poisson s Ratio When deforming a body, object elongate and contract in more than one direction Example when a rubber is subjected to a compressive stress, the block contract, but the radius or lateral strain increase S.D. Poisson discover the ratio of elongation and lateral strain is constant within the elastic range. Hence Poisson s ratio, for an isotropic and homogeneous material

29 Poisson s Ratio The negative sign indicate longitudinal elongation and lateral contraction and vice versa Only axial force cause these strain Poisson s ratio has no unit For ideal material, no lateral deformation when stretched or compressed, Poisson s ratio will be 0 Poisson s ratio has the value 0 ν 0.5
30 Example


31 The Shear Stress-Strain Diagram When a small element is subjected to pure shear, equal shear stresses are developed directed toward or away on the corner s element. For a homogeneous and isotropic material, the shear stress will deform an element uniformly Pure shear is studied when a specimen is subjected to torsion, and a shear stress-strain diagram can be obtained.
32 The Shear Stress-Strain Diagram The material will exhibit linear-elastic behaviour and it will have a proportional limit, τ pl, and it will then reach an ultimate shear stress τ u, and then lose its shear strength and reach fracture stress, τ f Hooke s Law applied for linear-elastic material G is the shear modulus of elasticity or the modulus of rigidity G has the same unit as τ
33 The Shear Stress-Strain Diagram Material constant can be related as
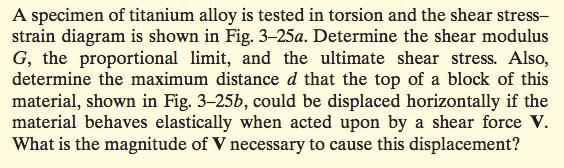
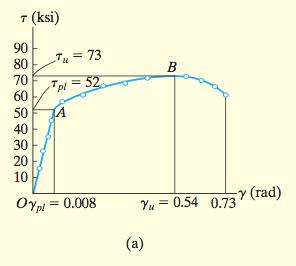
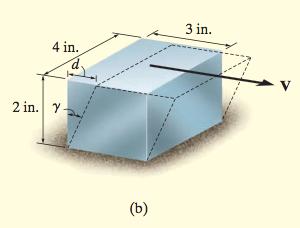
34 Example
35 Example
36 Creep When a material has to support a load for a very long period of time, the permanent deformation is known as creep Creep is time dependent permanent deformation For metal and ceramics, creep occurs when members are subjected to high temperature Stress and/or temperature is a major cause of creep A member is designed to resist creep strain for a specified time period, called creep strength A simple test is to test several specimens at a constant temperature, with different axial stress, then measure the time needed to produce allowable strain, a curve of stress over time can then be plotted
37 Creep Creep strength will decrease for higher temperature or higher stress Usually a factor of safety is applied to allow for creep, as creep can be difficult to determine
38 Fatigue When a metal is subjected to repeated cycles of stress, it causes the structure to break. Usually occurs in connecting rods, crankshafts, any part with cyclic loading Fracture will occur at less than material s yield stress Usually causes due to imperfections, when localized stress is much greater than average stress, can cause cracks, ductile material behaves like brittle Endurance or fatigue limit is the limiting stress when applying a load for a specified number of cycles The S-N diagram or stress-cycle diagram is plotted to determine endurance, S is stress, N is number of cycles to failure
39 Fatigue For steel, the endurance is when the stress becomes horizontal, from the graph it is 27 ksi or 186 Mpa For aluminum is not well-defined, we take the stress at the a limit of 500 million cycles, any stress below this, the fatigue in infinite.
40
41