CHAPTER 3 RESEARCH METHODOLOGY. Experimental procedure of the present study is similar to that of the works by
|
|
|
- Mervyn Arnold
- 5 years ago
- Views:
Transcription
1 CHAPTER 3 RESEARCH METHODOLOGY 3.1 Sample preparation Aluminum Titanate (Al 2 TiO 5 ) Experimental procedure of the present study is similar to that of the works by Sobhani (2008). The aluminum titanate (Al 2 TiO 5 ) was successfully prepared by sol-gel method. The raw materials used for synthesis of aluminum titanate were aluminum nitrate (Al(NO 3 ) 3.9H 2 O) as aluminum source, titanium isopropoxide (C 12 H 28 O 4 Ti) as titania source, ethanol and citric acid. x mole of aluminum nitrate was dissolved in 40 cm 3 ethanol where x = 0.01, 0.02, 0.04, 0.06, 0.08 and 0.09 mole and then (0.1-x mole) titanium isopropoxide was added dropwise under magnetic stirring at room temperature (sol 1). After 10 minutes of stirring, citric acid (0.1-x mole) introduced into the sol (sol 2), and was refluxed under magnetic stirring at 80 o C. After 2 hours, gel was formed. This honey-like gel was then dried on the hot plate. After drying, the mixed powder was placed in a crucible and sintered in air at 650, 750, 850, 950 and 1050 o C for 2h in electrical furnace in order to release volatile products coming from the starting materials and cooled overnight. The resulting powder was then examined using X-ray diffraction (XRD) to confirm the formation of Al 2 TiO 5. Schematic flow chart of sol-gel processing that was applied in this study is shown in Fig
2 AlNO 3.9H 2 O / ethanol C 12 H 28 O 4 Ti Sol 1 Citric acid Sol 2 Stirring and reflux at 80 o C (2 hours) Calcinations of precursor at different temperatures Fig. 3.1: The flow chart of preparing Al 2 O 3 -TiO 2 ceramic system The sintered samples obtained from the final step shown in Fig. 3.1 were then pelletized at 500 bars. Six compositions have been studied in producing Al 2 TiO 5 system. Table 3.1 shows the mole ratio of the compositions. Table 3.2 and 3.3 show the composition of the samples prepared with citric acid and sintering parameters respectively. Table 3.1: Composition of the samples prepared with different moles of aluminum nitrate and titanium isopropoxide. Al(NO 3 ) 3.9H 2 O (mole) C 12 H 28 O 4 Ti (mole)
3 Powder preparation has been accomplished by different techniques like sol-gel method [Zaharescu et al., 1998, Kato and Daimon et al., 1980], oxidation in high-frequency plasma flame [Gani et al., 1980], infiltration techniques [Pratapa, S. et al., 1998], etc. Traditionally, Al 2 O 3 and TiO 2 are ball-milled to form composite powder mixtures for the subsequent shaping and sintering process [Takahashi et al., 2002]. Aluminum titanate is usually prepared by the sintering reaction of stoichiometric mixtures of alumina and titania above 1400 o C [Freudenberg et al.,1987], but in this work the sol-gel technique is used. One advantage of the sol-gel process is the higher purity of the components that will reduce the rate of thermal decomposition, which has been shown to be largely related to the presence of impurities in the precursor materials [Buscaglia et al., 1998]. Another very interesting feature is represented by the possibility to synthesize aluminum titanate at low temperature [Colomban et al., 1991]. Direct formation of aluminum titanate can be achieved at temperatures around 600 o C via non-hydrolytic synthesis [Andrianainarivelo et al., 1997] and around 800 o C by synthesised with alkoxides stabilized with acetylacetone [Coury et al., 1994]. Sol-gel techniques with different preparative conditions are employed to synthesize this ceramic because of the possibility of formation of this high-temperature phase at temperatures lower than 1400 o C [Woignier et al., 1988] and according to Barbe et al., (2000), solgel processes have led to aluminum titanate at temperatures under 100 o C. The formation of β-al 2 TiO 5 at low temperatures is attributed to a diffusion-limited crystallization process, which takes place in conditions of high homogeneity at the molecular level reached in the material [Lange et al., 1994]. The sol-gel method is one of the most important techniques for the formation of various functional coatings, because of a large number of advantages such as easy 21
4 coating of large areas, accessibility of nanocrystalline materials and homogeneous multicomponent oxide films [Sanchez et al., 1988]. Table 3.2: Composition of the samples prepared with different moles of aluminum nitrate and titanium isopropoxide with citric acid. No. of moles Aluminum nitrate Titanium isopropoxide (ml) Citric Acid (g) (g) Table 3.3: Sintering parameters of the compounds. x (mole) Compositions Al x TiO 1-x 650, 750, 850, 950, 1050 o C (2 h) In the case of the sol-gel route, the powders have to be calcined (about 500 o C, depending on the composition) before pressing. This permits to burn residual organic groups and to avoid ceramic cracks [Cretin et al., 1999]. Fig. 3.2 shows the photo of chemicals used for preparation of Al 2 TiO 5. 22
 (c)")


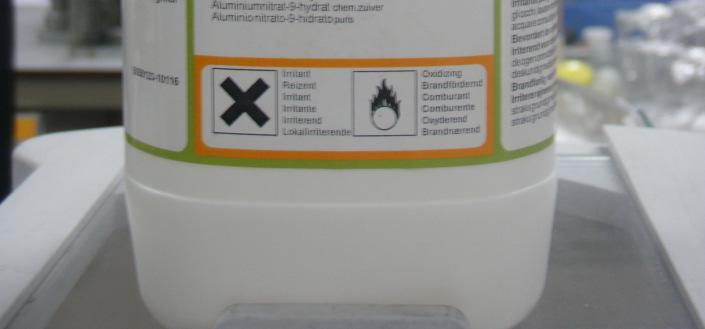

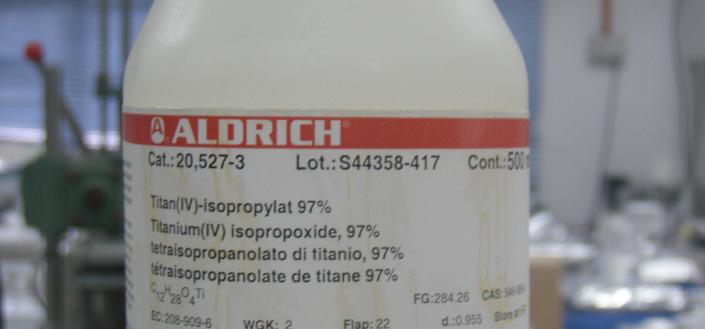
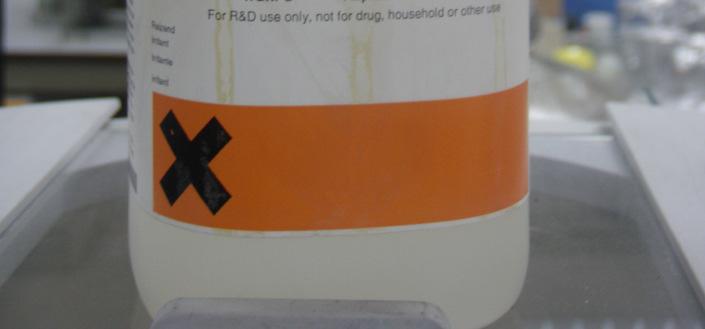
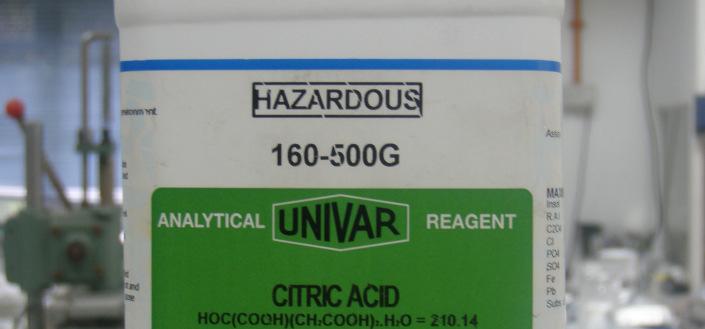

5 CHAPTER 3 (a) (c) (b) (d) Fig. 3.2: Photo of chemicals used for preparation of Al2TiO5 (a) aluminum nitrate, (b) titanium isopropoxide, (c) citric acid and (d) ethanol 23
6 3.1.2 Polymer electrolyte To prepare the films, 1 g chitosan was first mixed with 100 ml of 1 % acetic acid solution and stirred continuously with magnetic stirrer until the chitosan has dissolved in the acid. Different amounts of NH 4 SCN were then added into the solutions. When the salt has dissolved, the solutions were poured into Petri dishes and left to dry. Table 3.4 shows composition of the samples with different weight percent of NH 4 SCN. Table 3.4: Composition of the samples with different weight percent of NH 4 SCN Chitosan Acetic acid (1%) NH 4 SCN (weight %) NH 4 SCN (g) 1 g 100 ml Composite Polymer Electrolyte 1 g of chitosan was dissolved in different 100 ml 1% acetic acid solutions. To these, x gram of aluminum titanate (0 x 10 wt. %) was added. Table 3.5 shows the composition of the samples prepared with different weight percent of Al 2 TiO 5. The mixtures were stirred with a magnetic stirrer for several hours at room temperature until 24


7 chitosan, Al 2 TiO 5 and the salt were completely dissolved. When complete dissolution has taken place, the solution was poured into different Petri dishes and left to dry in air at room temperature until the films have formed. The films were then transferred into a dessicator for continuous drying. Fig. 3.3 shows photo of chemical used in preparing polymer composite electrolyte. Table 3.5: Composition of the samples prepared with different weight percent of Al 2 TiO 5 Chitosan Acetic acid (1%) NH 4 SCN(g) Al 2 TiO 5 (wt. %) Al 2 TiO 5 (g) 1 g 100 ml (a) (b) 25

 acetic acid (1%), (c) ammonium thiocyanate and")


8 CHAPTER 3 Fig. 3.3 continued.. (c) (d) Fig 3.3: Photo of chemical used in preparing polymer composite electrolyte (a) chitosan highly viscous, (b) acetic acid (1%), (c) ammonium thiocyanate and (d) aluminum titanate (homemade). 3.2 Characterization Electrochemical Impedance Spectroscopy (EIS) Electrical conductivity measurements were performed with a HIOKI 3531 ZHiTester that was interfaced to a computer. The frequency range was 50 Hz to 1 MHz in the temperature range of 25 oc to 120 oc. The thickness of each samples were measured using a micrometer gauge. The electrical conductivity is given by: σ= t RB A (3.1) 26
9 where t is the thickness (cm) of the film, R B the bulk impedance obtained from the Cole- Cole plot, and A (cm 2 ) the area of the film. The real and imaginary parts of impedance, permittivity and electric modulus were calculated using equation below: Z ε R = (3.2) ω C I 2 2 ( Z R + Z I ) Z ε I = (3.3) ω C R ( Z R + Z I ) M R M I ε = (3.4) R 2 2 ( ε R + ε I ) ε I = (3.5) 2 2 ( ε + ε ) I R Here C 0 = ε 0 A/t and ε 0 is the permittivity of the free space, A is the electrolyte contact area and t is thickness of the sample and ω = 2πf, f being the frequency in Hz. In order to verify the presence of residual water, the impedance data was transposed into real and imaginary permittivity data. According to Wintersgill and Fontanella (1987), the dielectric loss, ε i probes a wide variety of phenomena along with any relaxation which may be present in the material. It is therefore expected that if water is present a relaxation peak can be observed in the dielectric loss (ε i ) - frequency spectrum. Fig. 3.4: (a) Dielectric constant and (b) dielectric loss as a function of frequency at various temperatures for samples 50 wt% CA: 50 wt% NH 4 CF 3 SO 3. 27
10 Fig. 3.5: Frequency dependence of (a) real part and (b) imaginary part of electrical modulus at various temperatures for sample 50 wt% CA: 50 wt% NH 4 CF 3 SO 3. Its variation and that of dielectric loss with frequency at different temperatures for samples containing 50 wt% of NH 4 CF 3 SO 3 are shown in Fig. 3.4a and 3.4b, respectively [Khiar et al., 2006]. There are no appreciable relaxation peaks observed in the frequency range employed in this study. Both dielectric constant and dielectric loss rise sharply at low frequencies indicating that electrode polarization and space charge effects have occurred confirming non-debye dependence [Qian et al., 2001 and Govindaraj et al., 1995]. On the other hand, at high frequencies, periodic reversal of the dielectric field occurs so fast that there is no excess ion diffusion in the direction of the field. Polarization due to charge accumulation decreases, leading to the observed decrease in dielectric constant and dielectric loss [Ramesh et al., 2002 and Ramesh et al., 2001]. The variations of real (M R ) and imaginary (M I ) parts of electrical modulus are depicted in Fig. 3.5a and 3.5b, respectively [Khiar et al., 2006]. Both M R and M I show an increase at the higher frequency end. M I peaks are observed to decrease in height and the peak position shifted towards higher frequencies. The presence of such relaxation peaks in the M I plots indicates that the samples are ionic conductors [Mellander et al., 1996]. Fig 3.6 and 3.7 show typical impedance spectra and photo of HIOKI 3531 Z- HiTester that has been used. 28


11 R b Fig. 3.6: Typical impedance spectra of 80Al-20Ti (mole %) at 25 o C. Fig. 3.7: Photo of HIOKI 3531 Z-HiTester XRD Analysis X-ray diffraction was carried to determine the amorphous/crystalline nature of the materials. Several researchers [Maurya et al., 1992 and Hashmi et al., 1990] have been successful in proving the occurrence of complexation between the salt and the polymer host. The structures of the sintered samples were characterized using Siemen D5000 diffractometer which employs Cu-Kα x-radiation. Scans were taken over the 2θ angular range of 5 80 with a step size of The films were adhered to glass slides 29
12 before placing them to the sample chamber. Fig. 3.8 shows the XRD patterns of salted CA complexes [Majid et al., 2005]. Clearly, Fig. 3.8(a-e) shows that chitosan/nh 4 NO 3 form amorphous electrolytes. Fig. 3.8: XRD patterns of (a) pure CA (chitosan acetate) film (b) CA + 35 wt% AN (ammonium nitrate), (c) CA + 40 wt% AN (d) 45 wt% AN (e) 50 wt% AN and (f) pure NH 4 NO Fourier Transform Infra Red (FTIR) Infrared spectroscopy was employed to verify the occurrence of complexation. Complexation is known to occur between chitosan and an inorganic salt if there is a shift in the infrared band of O C NHR from 1650 to 1620 cm -1, a shift in the band of NH 2 from 1590 to 1575 cm -1, and a shift in the band of NH + 3 from 1560 to 1510 cm - 1 [Morni et al., 1999]. The FTIR spectrum provides information through band properties, frequencies and intensities and can, therefore, be used to predict chemical processes, 30
13 identify species and determine the increase in the number of certain entities from the increase in the area of the band. Fig. 3.9: FTIR spectra for (a) NH 4 SCN (b) pure PVAc (c) 95 mol% PVAc: 5 mol% NH 4 SCN (d) 85 mol% PVAc: 15 mol% NH 4 SCN (e) 75 mol% PVAc: 25 mol% NH 4 SCN [Selvasekarapandian et al., 2005] Fig. 3.9 above shows the broad and strong vibrational bands at 3110 and 2362 cm -1 are ascribed to υn-h stretching and υcn stretching of pure NH 4 SCN, respectively [Nakanishi et al., 1977]. The strong and intense peak observed at 2065 cm -1 is ascribed to thiocyanate ( S C N) antisymmetric vibration of pure NH 4 SCN [Bellamy, 1975]. The broad and intense band observed at 943 cm -1 is ascribed to the υc S symmetric bending vibrations of NH 4 SCN, respectively. The broad and intense peak at 1622 cm -1 is ascribed to υc N asymmetric vibrations of NH 4 SCN, respectively. The peak observed at 1402 cm -1 is ascribed to the combined effect of C S symmetric stretching vibrations of NH 4 SCN. The peak observed at 820 cm -1 in the NH 4 SCN is slightly shifted to lower wave numbers ( cm -1 ) which indicates the coordination of 31
14 SCN - ion with the polar group present in the polymer of the polymer complexes [Selvasekarapandian et al., 2005]. To identify the changes in the aluminum titanate, it is important to take into consideration the spectral ranges (i) cm -1 where the OH stretching vibrations of water and OH groups appear and (ii) cm -1 where the Al-O and Ti-O stretching and bending vibrations occur [Joe et al., 1997]. Infrared spectra exhibited in this work were taken with a Thermo Scientific/Nicolet is10 in the wavenumber region between 4000 and 400 cm -1. The films used in this work were cut into suitable sizes and placed in the specimen holder of the spectrophotometer. The resolution of the spectrophotometer was 1 cm Scanning Electron Microscopy (SEM) The scanning electron microscope is an instrument which can be used for examining the physical topography or morphology of a specimen. The experiment, scanning electron microscope Leica Stereoscan S440 model was used to take images of the surface morphology. From the SEM micrographs it can help to shed some light in order to explain the decrease and the increase in conductivity. SEM is often used to study the compatibility between the various components of the composite electrolytes through the detection of phase separations and interfaces. The compatibility between polymer matrix and inorganic fillers has great influence on the properties (mechanical, thermal, ionic conductivity, and interface with lithium anode) of PEO-based composite electrolytes [Xi et al., 2005]. According to them, both Li salt and mesophorous silica modified the surface morphology of the PEO in their work for for lithium polymer 32
15 batteries. Fig (a) shows the surface image of pure PEO film. The image shows a rough morphology with a great deal of micro-pores, a common occurrence for PEObased electrolytes prepared by the solvent casting method. These small pores are caused by the fast evaporation of the acetonitrile solvent during the preparation process. A dramatic improvement of surface morphology from rough to smooth is found after the addition of Li salt (Fig. 3.10(b)). The smooth surface morphology is closely related to the reduction of PEO crystallinity through the interaction between PEO segments and lithium cations. The incorporation of mesophorous silica in PEO 12 LiClO 4 complex further improves the smooth morphology (Fig (c d)). Although the distribution of mesophorous silica in PEO is difficult to visualize by SEM since these two phases do not differ significantly in their ability to radiate secondary electrons upon incidence by the analytical electron beam, no aggregation of mesophorous silica can be observed in Fig (c) and d suggesting that mesophorous silica dispersed homogeneously in PEO matrix. The aggregation of mesophorous silica begins to take place when its content further increased (Fig. 3.10(e)). However, these aggregations can also disperse homogeneously in the composite polymer electrolyte. 33
![(a) (b) (c) (d) (e) Fig. 3.10: SEM images and digital photos of pure PEO (a), PEO 12 LiClO 4 (b), and PEO LiClO 4 /X%SBA-15: (c) X =5; (d) X =10; and (e) X =25 [Xi et al., 2005]. 3.3 Summary The Al 2 TiO 5 prepared using the sol-gel technique.](/docs-images/90/102415614/images/16-0.jpg "The most crystalline sample was chosen as filler for the composite polymer electrolyte preparation. Sample of chitosan based polymer electrolyte which contains NH 4 SCN-Al 2 TiO 5 was prepared by 34")
16 (a) (b) (c) (d) (e) Fig. 3.10: SEM images and digital photos of pure PEO (a), PEO 12 LiClO 4 (b), and PEO LiClO 4 /X%SBA-15: (c) X =5; (d) X =10; and (e) X =25 [Xi et al., 2005]. 3.3 Summary The Al 2 TiO 5 prepared using the sol-gel technique. The most crystalline sample was chosen as filler for the composite polymer electrolyte preparation. Sample of chitosan based polymer electrolyte which contains NH 4 SCN-Al 2 TiO 5 was prepared by 34
17 using solution cast-technique. The samples were then characterized using x-ray diffraction (XRD), fourier transform infrared (FTIR) spectroscopy, scanning electron microscopy (SEM) and electrochemical impedance spectroscopy (EIS). 35