Post-test results of the QUENCH-16 bundle test on air ingress: complex cladding oxidation during reflood and combined hydrogen
|
|
|
- Wilfred Fletcher
- 5 years ago
- Views:
Transcription


1 Post-test results of the QUENCH-16 bundle test on air ingress: complex cladding oxidation during reflood and combined hydrogen J. Stuckert, M. Steinbrück QWS18, Karlsruhe 2012 Institute for Applied Materials; Program NUKLEAR KIT University of the State of Baden-Württemberg and National Large-scale Research Center of the Helmholtz Association
 performed 1999 at AEKI/Budapest: small bundles with 9")


2 Previous bundle air ingress experiments CODEX AIT-1, AIT-2 (Zry-4) performed 1999 at AEKI/Budapest: small bundles with 9 rods QUENCH-10 (Zry-4 claddings) performed 2004 at KIT/Karlsruhe: strong pre-oxidised bundle Q10, 800 mm PARAMETER-SF4 (E110 claddings) performed 2009 at LUCH/Podolsk: very high temperatures on reflood initiation with following escalation (bundle melting) 2/ 26
3 Objectives of the QUENCH-16 test air oxidation after rather moderate pre-oxidation in steam; slow oxidation and nitriding of zirconium in high temperature air and transition to rapid oxidation and temperature excursion; role of nitrogen under oxygen-starved conditions; formation of oxide and nitride layers on the surface of Zr; release of hydrogen from oxidised zirconium during air ingress scenario; reflooding of oxidised and nitrided bundle by water initiated at temperatures well below the melting point of the cladding, release of nitrogen. 3/ 26
 Krypton filling of rods; 3)")
 4) control of pressure in space between shroud")
4 QUENCH facility QUENCH-16 facility features: 1) controllable synthetic air input; 2) Krypton filling of rods; 3) temperature control for off-gas pipe (to avoid the steam condensation) 4) control of pressure in space between shroud and jacket 4/ 26
5 Cross section of the PWR test column cooling jacket 2 instrumented tubes Zry-4 ø6/4.2 mm pitch 14.3 mm 2 removable corner rods Zry-4 ø6 mm shroud Zry-4 ø88.9/82.8mm thermal insulation ZrO2 fibre thickness 34 mm 1 unheated rod cladding Zry-4 ø10.75/9.3 mm central thermocouple pellet ZrO 2 ø9.15/2.5mm 20 heated rods cladding Zry-4 ø10.75/9.3 mm W-heater ø6mm pellet ZrO 2 ø9.15/6.15mm 5/ 26
6 QUENCH-16 test progression test performed on at KIT/IAM according to pre-test calculations from PSI, GRS, EdF Argon 3 g/s s: water injection: 4l fast injection + 53 g/s superheated steam 3.4 g/s 7307 s: air injection 0.2 g/s 2000 Power, kw nd rod withdrawn Temperature, K st rod withdrawn Time, s el. power TFS 6/10 (650 m) TSH 11/180 (750 mm) TCRC 13 (950 mm) 6/ 26

7 Axial temperature distributions for different test phases strong growth of temperatures at elevations mm during the air ingress phase 7/ 26
8 Consumption of nitrogen and oxygen during air ingress phase: data of mass spectrometer s: water injection O2, N2, g/s s: air injection nitrogen consumption H2, g/s oxygen starvation N2 O2 H2 Time, s nitrogen uptake: 29 g o x y g e n u p t a k e : 5 8 g 8/ 26


:")
: moderate")
: 850 mm (1570 C):")
9 Corner rod D withdrawn from the bundle on the end of the air ingress phase: nitride formation between 300 and 900 mm 250 mm (1070 C): no nitrides 450 mm (1530 C): strong corrosion; nitrides 650 mm (1400 C): moderate corrosion; nitrides 750 mm (1460 C): strong corrosion; nitrides 850 mm (1570 C): strong corrosion; nitrides 950 mm: no nitrides 9/ 26
10 Temperature escalation (above Zr melting point) and cooldown during reflood TFS 13/ TFS 3/16 TFS 9/15 TFS 2/14 Temperature, K TFS 17/13 TFS 10/12 TFS 5/11 TFS 6/10 TFS 9/6 TFS 2/ mm 850 mm 650 mm 950 mm 1050 mm 1150 mm 1250 mm 1350 mm TFS 12/4 TFS 4/3.5 TFS 7/ Time, s Durations: escalation 100 s cooldown 400 s TFS 6/2 TFS 4/1 10 / 26


11 Post-test visual investigations by endoscope introduced at the position of the corner rod B: side view 350 mm: frozen metallic melt relocated from upper elevations 420 mm: oxide shells of melt droplets and rivulets 600 mm: intensive cladding damaging 835 mm: spalling of outer scale of oxide layer 880 mm: not damaged outer scale of oxide layer 1050 mm: dark oxide of claddings, intact Grid Spacer #4 11 / 26
12 Release of hydrogen and nitrogen during quench phase /data of mass spectrometer/ O2, N2, g/s s: water injection H2, g/s N2 H2 Time, s hydrogen release: 128 g. 3 main sources: 1) re-oxidation of Zr-nitrides; 2) secondary oxidation of cladding; 3) melt oxidation nitrogen release during re-oxidation of nitrides: 24 g (from consumed 29 g) -> correspond 7 g hydrogen 12 / 26


")
13 Nitride re-oxidation during quench at elevation 350 mm -Zr prior -Zr rod #5 porous oxide scale (re-oxidised during quench) dense inner oxide (grown during quench phase) Zr-nitrides 13 / 26


 rod #4 residual")
14 Nitride re-oxidation and secondary cladding oxidation during quench at elevation 450 mm porous oxide scale (re-oxidised during quench) secondary dense inner oxide (grown during quench phase) -Zr(O) rod #4 residual Zr-nitrides 14 / 26


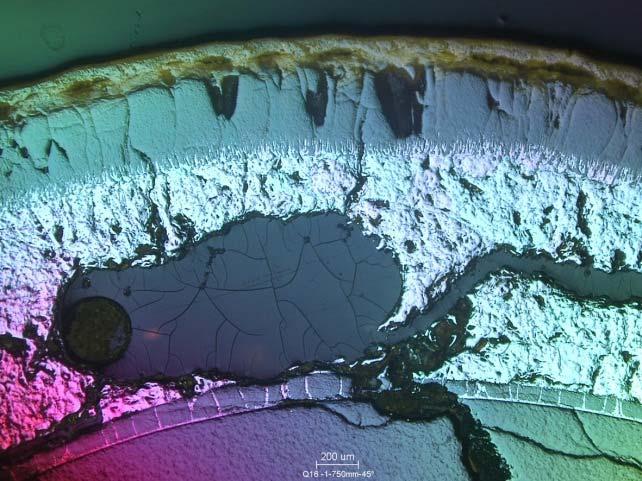
15 Secondary oxidation and melting at elevation 550 mm porous outer oxide scale rod #9 voids from downwards relocated melt completely oxidised Zry grid spacer Zr-nitrides frozen partially oxidised melt secondary dense inner oxide (grown during quench phase) 15 / 26


16 Intensive metal formation at elevation 650 mm rod #9 rod #21 internal ZrO2 voids from relocated melt secondary dense inner oxide (grown during quench phase) porous reoxidised scale 16 / 26


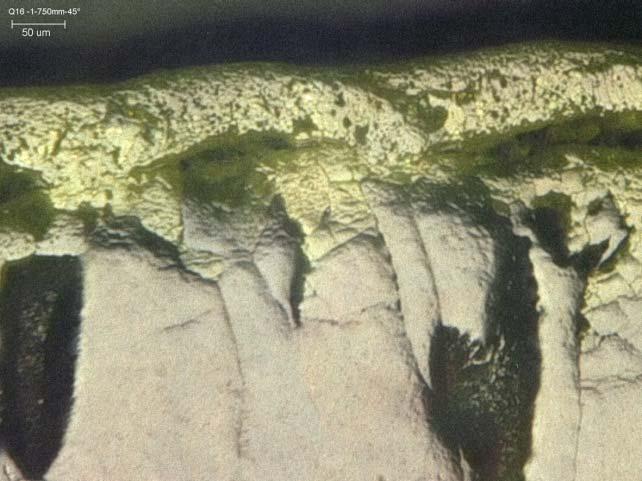


17 Spalling of re-oxidised scales from secondary oxide at 750 mm rod #1 rod #5 rod #9 prior nitrided scale re-oxidised during quench and spalled from innner ZrO2 layer growing during quench 17 / 26
")

18 Re-oxidation of nitrided scales and metal melting at elevation 850 mm rod #6 rod #18 porous scale (re-oxidised during quench) secondary dense inner oxide (grown during quench phase) Zr-nitrides -Zr frozen partially oxidised melt internal oxide layer 18 / 26

 prior - Zr - Zr(O) cub.")


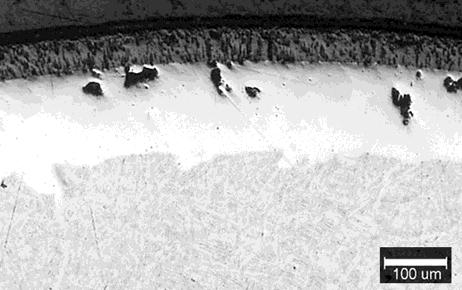
19 Elevation 950 mm: no nitrides, no melt formation cold side rod #8 hot side tetrag. ZrO 2 - Zr(O) prior - Zr - Zr(O) cub. ZrO 2 tetr. ZrO 2 Relative thick oxide layer after pre-oxidation (~100 µm) and low temperatures during air ingress (<1500 K) prevented nitride formation at this elevation 19 / 26
 1050 950 external ZrO2 alpha partially melted")

20 Axial distribution of cladding oxidation rate 850 mm secondary oxide (80% of ZrO2) external ZrO2 alpha partially melted 550 mm Elevation, mm internal ZrO2 between melt and pellet mm Thickness, mm 20 / 26


21 Bundle cross sections: melt formation and relocation 350 mm: metallic and oxidised melt pools 450 mm: mostly oxidised melt pools 550 mm: downwards relocated cladding metal 650 mm: downwards relocated cladding metal 750 mm: downwards relocated cladding metal 850 mm: outer oxide layer not failed 21 / 26


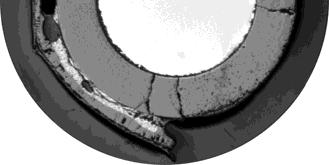
22 Frozen melt at elevation 350 mm: not oxidised and oxidised melt 16 grey porous region; precipitates 10% grey and light melt regions light non porous region; precipitates 10% C O = 8 wt% Widmanstätten pattern of frozen metallic melt precipitates part 20% C O = 10 wt% [ FZKA6383.pdf] 22 / 26


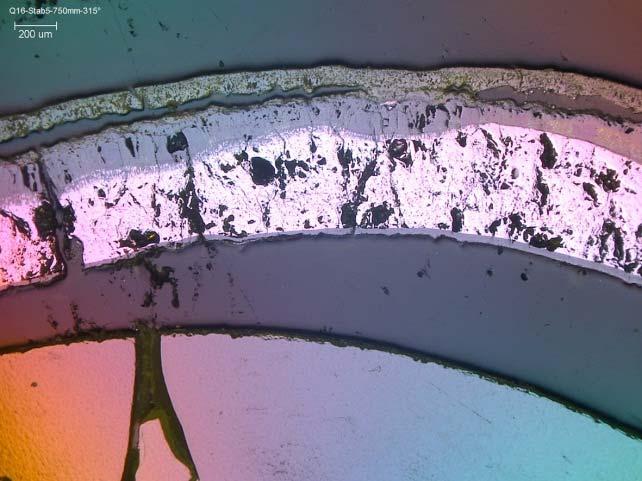
23 Frozen melt at elevation 450 mm: mostly oxidised melt molten pool between two rods: oxidation at melt periphery and ceramic precipitates inside melt homogeneous distribution of ceramic precipitates in the melt precipitates part 28% C O = 11.5 wt% 23 / 26
24 SUMMARY Three typical features of QUENCH-16: moderate pre-oxidation to 135 µm of oxide layer (instead 500 µm for QUENCH-10), a long period of oxygen starvation during the air ingress phase (800 s instead 80 s for QUENCH-10), and reflood initiation at temperatures significantly below the melting point of the cladding (1700 K instead of 2200 K for QUENCH-10). A partial consumption of nitrogen during the oxygen starvation, accompanied by acceleration of the temperature increase at mid bundle elevations, caused the formation of porous zirconium nitrides inside the oxide layer at bundle elevations between 350 and 850 mm. Immediate temperature escalations to 2420 K after reflood initiation were caused by massive steam penetration through the porous oxide/nitride scales and intensive reaction with nitrides and especially with metallic cladding. The cooling phase to the final quench lasted ca. 500 s after achievement of peak temperature. 24 g nitrogen from 29 g, consumed during oxygen starvation period, were released during the quench phase. This quantity of released nitrogen corresponds to 7ghydrogen developed during re-oxidation of nitrides. 24 / 26
25 SUMMARY (cont.) Metal part of different rods at elevations between 450 and 950 mm was melted during reflood. Practically all melt formed at 650 mm was released into the space between rods and relocated to the lower positions. Melt at other elevations was partially kept between rods and pellets with formation of internal oxide layer adjacent to pellet. Relocated melt was frozen between rods at elevations between 300 and 500 mm. Image analysis of the Zr-O melt, frozen in these pools and inside rods, allows estimating the hydrogen release due to melt oxidation to 25 g. The main part of hydrogen production during reflood (96 g) was released due to secondary cladding oxidation by steam penetrated through the porous re-oxidized nitrides. The total hydrogen production during QUENCH-16 was higher compared to QUENCH-10, i.e., 144 g (QUENCH-10: 53 g), 128 g of which were released during reflood (QUENCH-10: 5 g). 25 / 26
26 Acknowledgement The QUENCH-16 test was performed in framework of the LACOMECO program at KIT with financial support from the HGF Program NUKLEAR and the European Commission. The authors would like to thank Mr. Große, Mr. J. Moch, Mr. Rössger, Mrs. J. Laier, Mrs. Stegmaier and Mrs. U. Peters for intensive work during the test preparation and post-test investigations. Thank you for your attention / 26