Chrome ore and ferrochrome global outlook Loïc Racon
|
|
|
- Aron Ryan
- 5 years ago
- Views:
Transcription


1 Chrome ore and ferrochrome global outlook Loïc Racon Market Research Analyst October 28th, Chicago, USA
2 ICDA: Competition / Antitrust Policy Statement and Guidelines The activities of the ICDA are not and shall not be intended to restrain competition or to inflict prejudice or harm on consumers. The inherent purpose and objectives of the ICDA are to promote free competition and to provide benefit to consumers. In connection with membership and participation in the ICDA and related activities, there shall be no discussion, communication or disclosure among Members or Guests which are actual or potential competitors of any of the following individual company information: prices, discounts or terms or conditions of sale of products or services, pricing methods, profits, profit margins or production cost data, production plans, market shares, distribution, volumes, sales territories or markets, allocation of territories or customers ( Business Sensitive Information ). The ICDA, its constituent bodies and all related social and other activities shall not be used for the purpose of bringing about or attempting to bring about, any understanding or agreement, whether written or oral, formal or informal, express or implicit between and among actual or potential competitors with regard to matters concerning their Business Sensitive Information. The ICDA and each Member and Guest, in relation to the activities of the Association, shall be expected to use their best reasonable judgement to respect and comply with the letter and spirit of the Antitrust Laws and this Policy Statement. ICDA Members are permitted to bring legal advisers to ICDA meetings and events (at Members own costs). In order to minimize risk for the ICDA and its Members and Guests and consistent with the ICDA By-Laws, any behaviour inconsistent with this Policy will be dealt with in an appropriate manner by the ICDA Council and may result in suspension or termination of attendance privileges or membership. 2
3 Presentation outline 1. ICDA at a glance 2. Chrome ore production and trade 3. Ferrochrome production and trade 4. Focus on major countries : China, South Africa, Kazakhstan, India and Turkey 3


4 ICDA: a unique industry association 106 Members in 2014 from : 35% Breakdown by activity in 2014


5 ICDA s core service to its Members What value does the ICDA bring to chrome industry? Market Intelligence Events & conferences Market Development Get privileged informa=on Suppor=ng the con=nuous development of chrome industry Added Values Be part of a world- renowned network HSE Cr Ore Strengthen your industry More visibility for your company


6 Where does ICDA get its data? Market research firms Analyst Phone calls Estimations Forecasts Reports Vs ICDA ICDA Members Submit their data to the Market Analyst Reports 2010, 2011, 2012, 2013, 2014


7 ICDA publications
8 Presentation outline 1. ICDA at a glance 2. Chrome ore production and trade 3. Ferrochrome production and trade 4. Focus on major countries : China, South Africa, Kazakhstan, India and Turkey 8


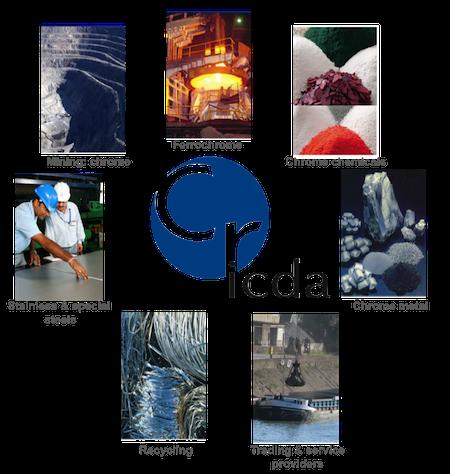
9 Chrome ore, grades and applications in 2014 Chromite 95.7% Metallurgical grade 1.5% 0.2% Foundry sand grade Refractory grade 2.5% Chemical grade Ferrochrome Ch.Cr / HC, MC, LC, FeSiCr Sodium dichromate Leather tanning 32% 77% 23% Stainless steel Carbon & other specialty alloys Molds for casting: -Metal & steels -Ferrous & non-ferrous Nozzle sands Glass production Refractory bricks, Mortars Cement kiln Fiberglass furnace Magnesia Cr bricks & others Plating 20% Chrome metal 20% Pigments 15% Wood preservation 9%


10 The Chromium Big Three Chrome ore production by grade In H Ferrochrome production by type In H Ferrochrome applications Source: ICDA Source: ICDA Industry sources Global)ferrochrome)&)stainless)steel)produc=on)) (index!2006!=!100)) 96% of Cr ore is used in metallurgical applications. 77% of Fe Cr production goes into stainless steel. 100% Ch. Cr, 30% HC FeCr è Stainless Steel 100% LC and MC FeCr è Carbon and alloy steels FeCr and Stainless steel are highly correlated!!180!!!!!170!!!!!160!!!!!150!!!!!140!!!!!130!!!!!120!!!!!110!!!!!100!!!!!90!!!!!80!!!! Global!FeCr!produ>on! Global!SS!produc>on!! 2006! 2007! 2008! 2009! 2010! 2011! 2012! 2013! 2014! Sources:)ICDA,)ISSF) 10
11 Global chrome ore and concentrate production by country (including all grades) 35,000,000" RoW" 30,000,000" Turkey" in#tonnes# 25,000,000" 20,000,000" 15,000,000" - 7.3% - 30% - 25% + 12% India" Kazakhstan" South"Africa" 10,000,000" stable 5,000,000" 0" 2006" 2007" 2008" 2009" 2010" 2011" 2012" 2013" 2014" Source:#ICDA# Global chrome ore and concentrate production : 29MT in 2014, down 4.2% from 2013 (30.3MT) 11
12 Global chrome ore and concentrate production Top 5 Chrome ore producing countries H H Comments on countries in H1 2015: Turkey - 200KT due to market prices and rising production cost SA -450KT due to reduced output from some producers Zimbabwe -200KT due to governmental discussions Key question Will 2015 output be slightly down? 35,000,000" 30,000,000" 25,000,000"? RoW" Turkey" India" Kazakhstan" South"Africa" in#tonnes# 20,000,000" 15,000,000" 10,000,000" KT - 5.5% 5,000,000" Source:#ICDA# 0" 2006" 2007" 2008" 2009" 2010" 2011" 2012" 2013" 2014" 2015"Est."


13 Global chrome ore and concentrate production Top 5 Chrome ore producing countries H %$ 4%$ 3%$ 11%$ 6%$ 6%$ In volume terms Top 5 were unchanged 7%$ 11%$ 15%$ 15%$ 54%$ 55%$ India s output more than doubled as the mining licence renewal issue in Odisha which left several mines inactive South$Africa$ Kazakhstan$ India$ Turkey$ Finland$ Others$ 2014: Outer circle H : Inner circle

14 Global chrome ore trade flows in H (in 000 tonnes) Global Trade: 5.8 Mt Main importing countries Main exporting countries Source: ICDA, based on official customs data
15 Presentation outline 1. ICDA at a glance 2. Chrome ore production and trade 3. Ferrochrome production and trade 4. Focus on major countries : China, South Africa, Kazakhstan, India and Turkey 15
16 14,000,000" Global ferrochrome production by country (including Ch.Cr/HC Fe Cr, MC, LC) 12,000,000" + 6% Finland" India" 10,000,000" -17% stable Kazakhstan"" South"Africa (in$tonnes)$ 8,000,000" 6,000,000" + 23% China"" 4,000,000" 2,000,000" +7% 0" 2006" 2007" 2008" 2009" 2010" 2011" 2012" 2013" 2014" Source:$ICDA$ 2014 Global Fe Cr production : 11.8 MT, up 9 % from
17 Global Ferrochrome production Top 5 ferrochrome producing countries H H Comments on countries in H1 2015: SA KT (+18%) due to the increasing Chinese demand for Fe Cr Kazakhstan +35 KT (+5.7%) for the same reason Key questions: Will global ferrochrome output continue to rise in 2015? Who will be on top? (in$tonnes)$ 14,000,000" 12,000,000" 10,000,000" 8,000,000" 6,000,000"? Finland" India" Kazakhstan"" South"Africa China"" 4,000,000" 2,000,000" 0" 2006" 2007" 2008" 2009" 2010" 2011" 2012" 2013" 2014" 2015"Est." Source:$ICDA$
& South#Africa# China## 10%$ 10%$ 40%# (in#%)# 30%# 20%# 35%$ 36%$ South$Africa$ China$$ Kazakhstan$ India$ Finland$$ Other$ 10%# 0%# 2001# 2002# 2003# 2004# 2005#")
18 Global Ferrochrome production Top 5 ferrochrome producing countries H %$ 4%$ 9%$ 3%$ 7%$ 7%$ 36%$ 34%$ 60%# 50%# Share&of&global&ferrochrome&produc1on&& 2001&6&H1&2015& (all#ferrochrome#types#included)& South#Africa# China## 10%$ 10%$ 40%# (in#%)# 30%# 20%# 35%$ 36%$ South$Africa$ China$$ Kazakhstan$ India$ Finland$$ Other$ 10%# 0%# 2001# 2002# 2003# 2004# 2005# 2006# 2007# 2008# 2009# 2010# 2011# 2012# 2013# 2014# H1#2015# Source:#ICDA# 2014: Outer circle H : Inner circle Only change between China and South Africa : China became the largest Fe Cr producer worldwide Q4 2014: South Africa became again the largest Fe Cr producer worldwide.

19 Global HC Fe Cr trade flows in H (in 000 tonnes) Global Trade: 3.06 Mt Main importing countries Main exporting countries Source: ICDA, based on official customs data
20 Presentation outline 1. ICDA at a glance 2. Chrome ore production and trade 3. Ferrochrome production and trade 4. Focus on major countries : China, South Africa, Kazakhstan, India and Turkey 20
21 China Change in the air? Record HC Fe Cr > 4 MT in 2014 Production cuts in the yearend for environmental reasons and declining profitability. HC Fe Cr imports, + 12% to 2.06 MT Supported by the weakening currencies of suppliers, the abolishment of import duty. Cr imports reached 9.4 MT in 2014, % 14,000,000" 12,000,000" 10,000,000" 8,000,000" 6,000,000" 4,000,000" 2,000,000" 0" 2006" 2007" 2008" 2009" 2010" 2011" 2012" 2013" 2014" 4,500,000" 4,000,000" 3,500,000" 3,000,000" 2,500,000" 2,000,000" 1,500,000" 1,000,000" 500,000" 0" H HC Fe Cr production -1.6% YoY to 1.95 MT HC Fe Cr imports + 18% YoY to 1.3 MT Cr"produc4on" Cr"imports" HC"FeCr"produc4on" HC"FeCr"imports" Key questions: Is a new Chinese strategy underway? 21


22 22 South Africa Back to the top? 2006 H Cr ore output stable in But Fe Cr production % from 2013, pulling Cr ore demand. SA HC Fe Cr exports + 17%. Cr exports -16% mainly due to UG2 Cr%produc+on%in%Million%Tonnes% 18.0# 16.0# 14.0# 12.0# 10.0# 8.0# 6.0# 4.0# 2.0# 4.5# 4.0# 3.5# 3.0# 2.5# 2.0# 1.5# 1.0# 0.5# FeCr%produc+on%&%Imports%in%Million%Tonnes% 0.0# 2006# 2007# 2008# 2009# 2010# 2011# 2012# 2013# 2014# 0.0# H Cr exports+16.2% YoY as UG2 came back on line. Fe Cr output, + 18% YoY, signalling a renaissance in SA Key questions: What about UG2 on the long run? Will power supply become again a constraint? Cr#produc4on# Cr#exports# HC#FeCr#produc4on# HC#FeCr#export#

23 Kazakhstan Cr Gentle giant 2006 H KZ Cr exports % in 2014 Fe Cr exports - 6.5% in 2014 Fe Cr production rose by 0.2% in 2014 Cr production +12% to MT in 2014 Cr%produc+on%&%trade%%in%Million%Tonnes% 5.0# 4.5# 4.0# 3.5# 3.0# 2.5# 2.0# 1.5# 1.0# 0.5# 1.4# 1.2# 1.0# 0.8# 0.6# 0.4# 0.2# FeCr%prodcu+on%&%trade%in%Million%Tonnes% 0.0# 2006# 2007# 2008# 2009# 2010# 2011# 2012# 2013# 2014# 0.0# H Cr exports - 30% YoY Fe Cr output + 3.5% YoY to 0.57MT Cr#produc4on# Cr#exports# HC#FeCr#produc4on# HC#FeCr#exports# Key questions: Will Kazakhstan continue to reduce its exports of both Cr and Fe Cr, and stabilize local Fe Cr production? Will they increase their Cr ore stocks? 23

24 India What Next? 2006 H Cr ore production - 25% in 2014 to 1.9 MT due to regulatory issues, but has since rebounded Cr ore exports - 48% from 2013 due to an export tax In 2014, Fe Cr production - 17%, Cr%produc+on%&%trade%in%Million%Tonnes% 4.00# 3.50# 3.00# 2.50# 2.00# 1.50# 1.00# 0.50# 1.20# 1.00# 0.80# 0.60# 0.40# 0.20# FeCr%produc+on%&%trade%in%Million%Tonnes% 0.00# 2006# 2007# 2008# 2009# 2010# 2011# 2012# 2013# 2014# Cr#produc4on# Cr#exports# HC#FeCr#produc4on# HC#FeCr#exports# 0.00# H Cr ore production +25% to 1.5 MT Fe Cr production is -9.1% Key questions: Is a consolidation underway? Will mineral auctions change the game? 24
25 Cr ore -30% from 2013 to 1.75 MT Turkey Dismay 2006 H " 160" In 2014, Cr exports -23% In 2014, HC Fe Cr production - 30% HC Fe Cr ore exports -33%, as China reduced its imports. Cr#produciton#&#trade#in#Million#Tonnes# 2.5" 2.0" 1.5" 1.0" 0.5" 140" 120" 100" 80" 60" 40" 20" Cr#produc)on#&#trade#in#Thousand#Tonnes# 0.0" 2006" 2007" 2008" 2009" 2010" 2011" 2012" 2013" 2014" Cr"produc4on" Cr"exports" HC"FeCr"produc4on" HC"FeCr"exports" 0" H Cr ore output - 19% YoY to 0.84 MT Cr exports - 38% YoY Fe Cr production -7.7% YoY Key questions: Is Turkish Cr ore being replaced by cheaper material from other sources? What will happen if China is indeed shifting to importing Fe Cr? 25
26 Conclusion Chromium Industry is passing through a tough phase: Pricing pressures as China s appetite for Cr ore diminishes amid a strategy shift Cost pressures in different countries for different reasons Several companies facing difficulty or production cuts in recent months Commodity Markets suffer worldwide: Currency devaluation may help but is not sustainable China s economy is slowing down, meaning diminished demand from end-users, impacting global trade Economic growth is the key to sustainable revival 26
27 Thank you for your attention ICDA Membership: the access to privileged information!