Distribution Pattern of NORM on Red Sea Shore Sediment in Relation to NON-Nuclear Industries. Dr. Ashraf E. Khater
|
|
|
- Maximillian Short
- 5 years ago
- Views:
Transcription

1 Distribution Pattern of NORM on Red Sea Shore Sediment in Relation to NON-Nuclear Industries Dr. Ashraf E. Khater King Saud University, Saudi Arabia Nuclear and Radiological Regulatory authority, Cairo-Egypt
2 Introduction

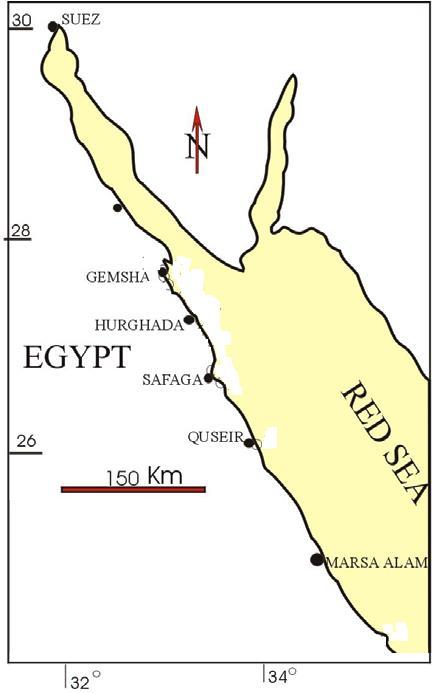
3 The Red Sea is a deep semi-enclosed and narrow basin connected to the Indian Ocean by a narrow sill in the south and to the Suez Canal in the north.
4 The Red Sea is one of the most saline bodies of water in the world, due to high evaporation. Salinity ranges from between ~36 in the southern part due to the effect of the Gulf of Aden water and reaches 41 in the northern part, due mainly to the Gulf of Suez water and the high evaporation. Egypt has about 700 km of coastline along the Red Sea proper, which is of great environmental, economical and recreational value.
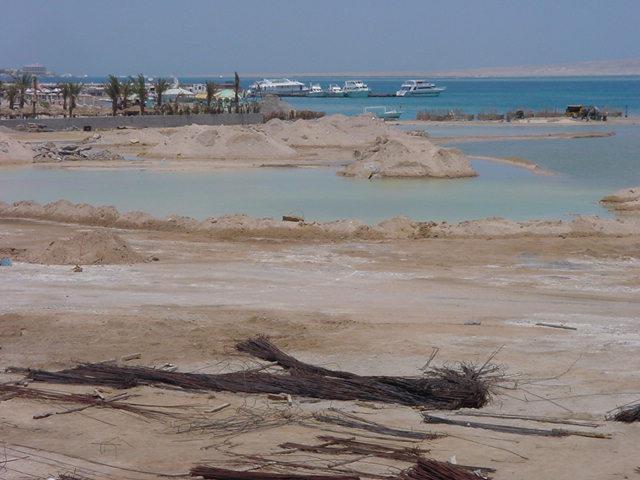
5 Since the beginning of the 70's, the entire region has suffered from important industrial, touristic and demographic mutations, which are expected to affect the Red Sea environment, particularly the coastal area. Unless adequate and severe measures are implemented to protect it, coral reefs, mangrove stands and sea grass beds, ecosystems specific to tropical seas and characterized by their biological diversity will be subjected to dramatic and probably irreversible damage.
6

7
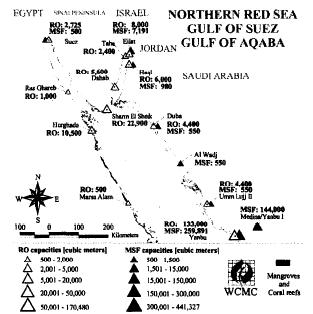
8 EGOLOGICAL STRESSES OIL PRODUCTION INDUSTRIES: In the Gulf of Suez, the northern part of the Red Sea, there are about 90 % of the Egyptian oil exploration and production activities, which could be a significant source of environmental contamination with technological enhanced naturally occurring radioactive materials (TENORM).

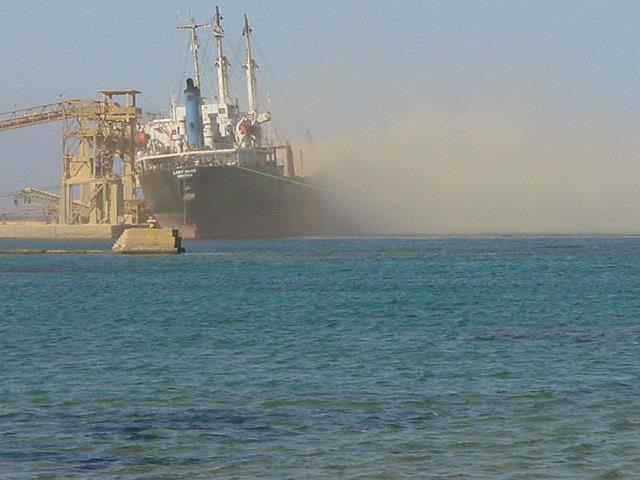
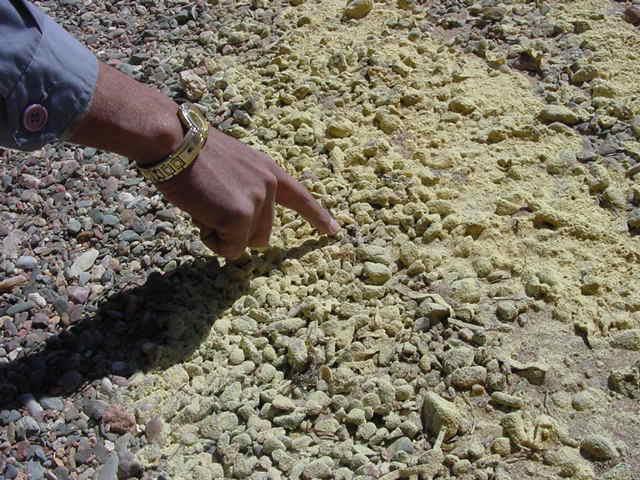
9 PHOSPHATE ORE MINING AND SHIPPING: Two main centers for phosphate ore mining; Safaga and Quseir, and Three shipping harbors. Phosphate ore dust spilled over into the Sea during shipping is considered as a continuous source for contaminating the Red Sea coastal environment.
10 DAWU Phosphate formation Three main phosphate mining locations

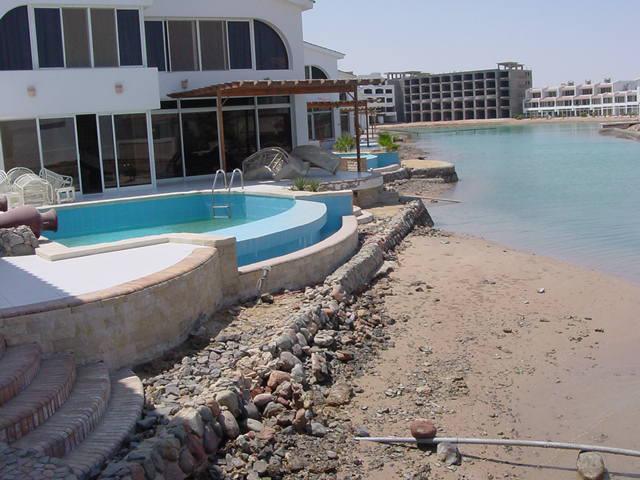
11 WATER DESALINATION
12 EGOLOGICAL STRESSORS Phosphate mining Industrial waste water and sewage Oil industry recreation shipping Housing


13
14
15 shipment operations of El-Hamrawein

16 drainage of reject water of desalination water plant


17
18 AIMS OF THE WORK To assess the spatial distribution pattern and levels of the NORM in the Egyptian Red Sea Coastal environment. To build up a scientific bases to evaluate the present radioecological impacts of the non-nuclear industries (e.g. oil production and phosphate mining) on the coastal environment. Also, these data will be available for subsequent evaluations of the possible future environmental contamination due to the non-nuclear industries.
19 To help policy makers to indentify the anthropogenic impacts and better assess the needs for remediation.
20 Experimental work 39 shore sediment samples, Mean grain size; total Ba, Sr and HCO 3 ; NORM (Ra-226, Ra-228 and K-40; Total U, Th, K; Leachable U, Th, K) Analytical techniques; AA, gamma spec, ICP-MS
21 RESULTS and DISCUSSION
 to north (Shuqeir) Phi 1.5 1.0 0.5 0.0-0.5-1.")
22 MEAN GRAIN SIZE, Ba, Sr AND CO R=0.48 The beach sediments in the study area are predominantly sands. The grain size of the sediments increases from south (Marsa Alam) to north (Shuqeir) Phi samplpe code The content of terrestrial deposits is the major control in determining the mean grain size of sediment where most of the coarse sands are mainly quartz, feldspars, and other silicate mineral grains.
23 However, the low contribution of terrestrial deposits to the shore in the south led to the fineness of beach sediments. This is because eroded carbonate grains are easier to be broken than silicate grains during reworking processes. ba sr R= ppm CO CO Code
24 ba sr ppm CO3 Barium and strontium correlate well with total carbonate content (Fig.), as the two elements decrease from south to north following the same spatial distribution of carbonate. The association of barium and strontium are noticed by many authors
25 Ba/CO R=0.3 Ba/CO Code Non-carbonate barium increases from south (Marsa Alam) to north (Shuqeir), where oil exploration and production processes are operated barium-bearing mud used during drilling operations of oil wells X Axis Title

26
27 NORM: Ra226 ### ### ### The relationships 80 between 226 Ra and Ba were weak with correlation coefficient (R) values of Ra-226 (Bq/kg) Ba (ppm) The weak correlation between radium and barium could be due to the possible anthropogenic inputs of barium and radium-226 as a result of oil exploration activities and phosphate miningshipment activities, respectively.
28 Ba (ppm) B B Ra226 Ra Ra (Bq/kg) Sample code

29 120 Ra226 Ra Ra N S Sample Code
30 Ra CODE
31 R= K CODE

32 6 5 ra226ra228 ra226ra Ra/ 228 Ra N Sample code S
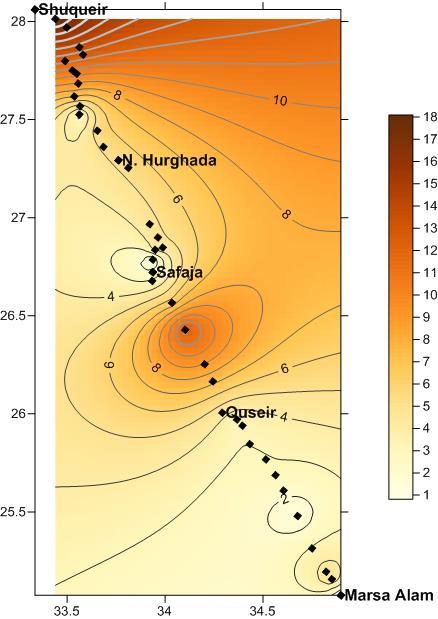
33 6 ra226ra228 ra226ra Ra/ 228 Ra N Sample code These relationships and their trend line imply the increase of S 226 Ra/ 228 Ra activity ratio in the direction of Shuqeir in the North and Safaga where the oil exploration and phosphate mining activities are located.
34 Ra226 Ra northra northra Ra Ra N S 6 5 Sample Code ra226ra228 ra226ra N Sample code ratio ratio S Ra/ 228 Ra Ra/ 228 Ra N Sample code S N Sample Code S
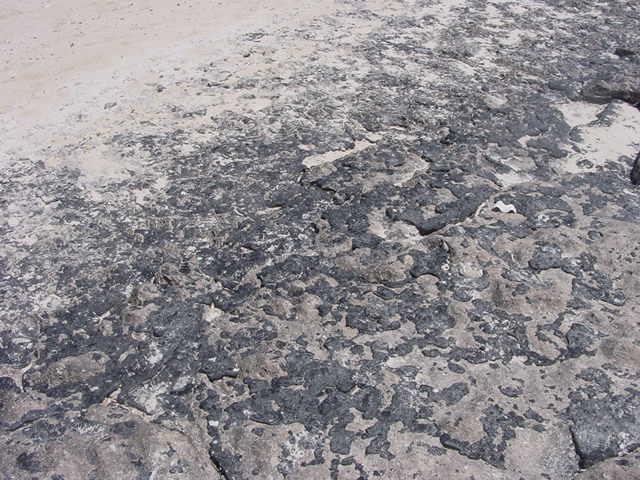
35 1.2 B B Ra/ 228 Ra S N Sample Code The lowest activity ratios of 226 Ra/ 228 Ra were found in the Hurghada - Sharm El- Naga region (codes, ) with average value of That could be explained due to the presence of black sands, which are enriched in the mineral monazite containing a significant amount of 232 Th ( 228 Ra). The enrichment occurs because the specific gravity of monazite allows its concentration along beaches where lighter materials are swept away
36 In Safaga- Qusier region (sample codes ) the average activity ratio of 226 Ra/ 228 Ra was The high average activity ratio of 226 Ra/ 228 Ra could be explained due to the phosphate mining activities in Safaga-Quseir region where the concentration of 238 U and its decay products tend to be elevated in phosphate deposit. 6 5 A A Ra/ 228 Ra N Sample Code S

37

38

39 the presence of black sands, which are enriched in the mineral monazite containing a significant amount of 232 Th ( 228 Ra).

40 EF of Th-232

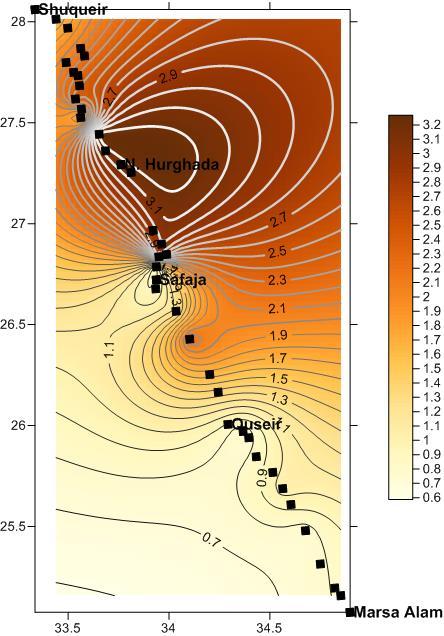
41 Activity ratio of leachable U-238/Th-232 The activity ratios of 238 U/ 232 Th varied widely over ten fold (0.3-15) with an average value of 3.7. The difference in their geo-chemical behaviour in marine environment is very obvious in the Red Sea bottom sediment where 238 U/ 232 Th average activity ratio is 40 (Khatir et al., 1998).

42 Distribution pattern of leachable Ba (ppm)
43 Enrichment Factor for Ba-L

44 EF of leachable P


45 EF of leachable Cd
46 CONCLUSIONS Investigation of the radio-ecological aspects of the Egyptian coast of the Red Sea and the radiological impacts of the nonnuclear industries (oil industries and phosphate mining) on the coastal environment are needed. Our results imply that there is an indication of the radiological impacts of the oil industries in the Northern region of the Red Sea Coast and phosphate mining in Safaga- Qusier region.
47
48 policy makers better assess for remediation.

49 Thank you for your attention! Thank you