Microstructure and Corrosion Behaviour of Aerospace Aluminium Alloys
|
|
|
- Florence Lucas
- 5 years ago
- Views:
Transcription

1 Microstructure and Corrosion Behaviour of Aerospace Aluminium Alloys A thesis submitted to The University of Manchester for the Degree of Doctor of Philosophy in the Faculty of Engineering and Physical Sciences 2015 XINXIN ZHANG School of Materials Corrosion and Protection Centre
2 Table of Contents Table of Contents... 2 List of Figures... 5 List of Tables Abstract Declaration Copyright Statement Acknowledgements Introduction Literature Review Introduction Microstructure of aluminium alloys Microstructure of Al-Cu-Mg alloys Microstructure of Al-Cu-Li alloys Corrosion behaviour of aluminium alloys Corrosion behaviour of Al-Cu-Mg alloys Corrosion behaviour of Al-Cu-Li alloys Experimental Methods Materials AA2024-T351 aluminium alloy A97 aluminium alloys Specimen preparation Mechanical polishing Electropolishing Alkaline etching Ultramicrotomy GDOS etching Focused ion beam Testing
3 Immersion testing Electrochemical measurement Characterization Optical microscopy Scanning electron microscopy Transmission electron microscopy Microstructure Characterization of AA2024-T351 and 2A97 Aluminium Alloys Microstructure of AA2024-T351 aluminium alloy Constituent intermetallic particles Dispersoids and precipitates Crystallographic structure and stored energy Discussion Microstructure of 2A97 aluminium alloys Constituent intermetallic particles Crystallographic structure Dispersoids The distribution of precipitates Discussion Conclusions Corrosion Behaviour of AA2024-T351 Aluminium Alloy Corrosion behaviour of constituent intermetallic particles General observation Corrosion behaviour of individual intermetallic particle Corrosion behaviour of clustered intermetallic particles Discussion Stable localized corrosion Electrochemical behaviour Intergranular corrosion Crystallographic corrosion Discussion Conclusions Corrosion behaviour of constituent intermetallic particles
4 5.3.2 Intergranular corrosion Crystallographic corrosion Corrosion Behaviour of 2A97 Aluminium Alloys Corrosion behaviour of constituent intermetallic particles General observation after 5 h immersion General observation after 20 h immersion Localized corrosion in 2A97 Al-Cu-Li alloys Electrochemical behaviour Localized corrosion in cold worked alloy Localized corrosion in naturally aged alloy Localized corrosion in artificially aged alloy Localized corrosion in cold worked and artificially aged alloy Discussion The influence of thermomechanical history on localized corrosion Corrosion propagation The influence of grain-stored energy on localized corrosion Conclusions Conclusions and Suggestions for Further Work Conclusions AA2024-T351 aluminium alloy A97 aluminium alloys Suggestions for further work References Word Counts:
5 List of Figures Figure 3.1: Schematic diagram of the equipment set-up during electropolishing process Figure 3.2: Schematic diagrams showing the sectioning process of ultramicrotomy (a) Trimming process by glass knives, (b) Sectioning process by the diamond knife Figure 3.3: Schematic diagram of the electrochemical cell for potentiodynamic polarization measurement in a de-aerated testing solution Figure 4.1: Scanning electron micrographs of AA2024-T351 aluminium alloy surface (a) Mechanical polishing with 1 µm diamond paste, (b) OPS polishing Figure 4.2: Typical EDX spectra of constituent intermetallic particles (a) S-phase, (b) θ- phase, (c) α-phase without silicon, (d) α-phase with silicon Figure 4.3: Typical Kikuchi patterns along with the corresponding indexed results of constituent intermetallic particles (a)-(b) S-phase, (c)-(d) θ-phase, (e) α-phase Figure 4.4: Backscattered electron micrographs of different existence forms of S-phase and θ-phase intermetallic particles in AA2024-T351 aluminium alloy Figure 4.5: Typical S-phase and θ-phase intermetallic particle cluster (a) Backscattered electron micrograph, (b) Secondary electron micrograph, (c)-(d) Kikuchi pattern with its corresponding indexed result of θ-phase at point 1, (e)-(f) Kikuchi pattern with its corresponding indexed result of S-phase at point Figure 4.6: Backscattered electron micrographs of typical intermetallic particle clusters of S-phase and θ-phase particles in AA2024-T351 aluminium alloy Figure 4.7: (a) Scanning electron micrograph of a typical intermetallic particle cluster, (b) EDX maps, in the sequence of Al, Cu, Fe, Mn, Si and Mg Figure 4.8: (a) Scanning electron micrograph of a typical intermetallic particle cluster, (b) EDX maps, in the sequence of Al, Cu, Mn, Si, Mg and Fe Figure 4.9: Backscattered electron micrographs of typical α-phase intermetallic particles on the surface of AA2024-T351 aluminium alloy, existing individually and in cluster Figure 4.10: (a) Typical scanning electron micrograph of individual α-phase intermetallic particles, (b) Corresponding EDX spectrum from point 1 in (a) Figure 4.11: Backscattered electron micrographs of typical α-phase intermetallic particle clusters in AA2024-T351 aluminium alloy Figure 4.12: (a) Scanning electron micrograph of a typical α-phase intermetallic particle cluster with well-defined shell-core structure, (b) EDX maps, in the sequence of Al, Cu, Mn, Si, Fe and Mg Figure 4.13: (a) Scanning electron micrograph of a typical α-phase intermetallic particle cluster without well-defined shell-core structure, (b) EDX maps, in the sequence of Al, Cu, Mg, Fe, Mn and Si Figure 4.14: (a) HAADF micrograph of a typical region in the twin-jet electropolished AA2024-T351 aluminium alloy, (b)-(d) EDX spectra from points 1-3 in (a) Figure 4.15: Transmission electron micrographs of the twin-jet electropolished AA2024 aluminium alloy (a) Intermetallic particle cluster of S-phase and θ-phase, (b) Framed 5
6 area in (a) with increased magnification, (c) Corresponding diffraction pattern, (d) Individual θ-phase intermetallic particle, (e) Framed area in (d) at increased magnification, (f) Corresponding diffraction pattern, (g)-(h) Other typical linear crystallographic defects in θ-phase intermetallic particles Figure 4.16: (a) Transmission electron micrograph of a typical α-phase intermetallic particle, (b) Increased magnification of framed area in (a) Figure 4.17: (a)-(b) Bright field TEM micrographs of AA2024-T351 aluminium alloy, (c) EDX spectrum of rod-like dispersoid, (d) EDX spectrum of round-shaped dispersoid Figure 4.18: Typical scanning electron micrographs of dispersoid free zone around (a)- (b) Individual S-phase / θ-phase intermetallic particles, (c)-(d) Multi-phase particle and intermetallic particle cluster of S-phase and θ-phase Figure 4.19: (a)-(b) Bright field and dark field STEM micrographs of a triple grain boundary joint, (c)-(d) Typical EDX line-scan results along line 1 and line 2 in (a), (e)- (f) Bright field TEM micrograph of a relatively clean grain boundary and the corresponding EDX line-scan result, (g)-(h) HAADF micrograph of grain boundary and the corresponding EDX line-scan result, revealing the presence of Mg segregation, (i)-(j) HAADF micrograph of grain boundary and the corresponding EDX line-scan result, revealing the presence of Cu and Mg segregations Figure 4.20: (a) Crystallographic orientation distribution map in Euler s colours, (b) Misorientation distribution map, (c) Grain boundary misorientation distribution map, (d) Histogram of grain boundary misorientation distribution, (e) Grain-stored energy distribution map in grey scale, with yellow lines applied to represent HAGBs, (f) The distribution of Schmidt factors in AA2024-T351 aluminium alloy Figure 4.21: Scanning electron micrographs of (a) 2A97-T3, (b) 2A97-T4, (c) 2A97-T6 and (d) 2A97-T8 aluminium alloys after mechanical polishing to 1 µm Figure 4.22: Scanning electron micrographs and EDX spectra in 2A97-T3 aluminium alloy (a)-(d) Typical intermetallic particles in 2A97-T3 aluminium alloy in different existing forms, (e)-(f) Typical EDX spectra of intermetallic particles in 2A97-T3 aluminium alloy Figure 4.23: Scanning electron micrographs of intermetallic particles in 2A97-T3 aluminium alloy and corresponding EDX maps (a)-(b) Typical intermetallic particles in 2A97-T3 alloy along with the corresponding EDX maps, in the sequence of Al, Cu, Fe, Mn, Ag, Mg and Zn, (c)-(d) Another typical intermetallic particles in 2A97-T3 alloy along with the corresponding EDX maps, in the sequence of Al, Cu, Fe, Mn, Ag, Zn and Mg Figure 4.24: Scanning electron micrographs and EDX spectra in 2A97-T4 aluminium alloy (a)-(d) Typical intermetallic particles in 2A97-T4 aluminium alloy in different existing forms, (e)-(f) Typical EDX spectra of intermetallic particles in 2A97-T4 aluminium alloy Figure 4.25: EDX maps of intermetallic particles in 2A97-T4 aluminium alloy (a) EDX maps of intermetallic particles shown in Figure 4.24 (c), in the sequence of Al, Cu, Fe, Mn, Ag, Mg, Ba and Zn, (b) EDX maps of intermetallic particles shown in Figure 4.24 (d), in the sequence of Al, Cu, Fe, Mn, Ag, Mg, Ba and Zn
7 Figure 4.26: Scanning electron micrographs and EDX spectra in 2A97-T6 aluminium alloy (a)-(b) Typical intermetallic particles in 2A97-T6 aluminium alloy in different existing forms, (c)-(d) Typical EDX spectra of intermetallic particles in 2A97-T6 aluminium alloy Figure 4.27: Scanning electron micrograph of intermetallic particles in 2A97-T6 aluminium alloy and EDX maps (a) EDX maps for intermetallic particles shown in Figure 4.26 (b), in the sequence of Al, Cu, Fe, Mn, Zn, Ag, Ca and Mg, (b) Typical intermetallic particles in 2A97-T6 aluminium alloy, (c) EDX maps for intermetallic particles shown in (b), in the sequence of Al, Cu, Fe, Mn, Mg, Ag, Ca and Zn Figure 4.28: Scanning electron micrographs and EDX spectra in 2A97-T8 aluminium alloy (a)-(b) Typical intermetallic particles in 2A97-T8 aluminium alloy in different existing forms, (c)-(d) Typical EDX spectra of intermetallic particles in 2A97-T8 aluminium alloy Figure 4.29: EDX maps of intermetallic particles in 2A97-T8 aluminium alloy (a) EDX maps for the intermetallic particles shown in Figure 4.28 (a), in the sequence of Al, Ag, Cu, Mg, Mn, Fe and Zn, (b) EDX maps for the intermetallic particles shown in Figure 4.28 (b), in the sequence of Al, Ag, Cu, Mg, Mn, Fe and Zn Figure 4.30: Backscattered electron micrographs, revealing the grain orientation distribution in (a) 2A97-T3, (b) 2A97-T4, (c) 2A97-T6 and (d) 2A97-T8 aluminium alloys Figure 4.31: EBSD analysis of 2A97-T3 aluminium alloy (a) IPFZ map, (b) Grain boundary misorientation distribution map with black lines and grey lines representing HAGBs and LAGBs, (c) Histogram of grain boundary misorientation distribution in 2A97-T3 aluminium alloy, (d) Grain-stored energy distribution in grey scale Figure 4.32: EBSD analysis of 2A97-T8 aluminium alloy (a) IPFZ map, (b) Grain boundary misorientation distribution map with black lines and grey lines representing HAGBs and LAGBs, (c) Histogram of grain boundary misorientation distribution in 2A97-T8 aluminium alloy, (d) Grain-stored energy distribution in grey scale Figure 4.33: EBSD analysis of 2A97-T4 aluminium alloy (a) IPFZ map, (b) Grain boundary misorientation distribution map with black lines and grey lines representing HAGBs and LAGBs, (c) Histogram of grain boundary misorientation distribution in 2A97-T4 aluminium alloy, (d) Grain-stored energy distribution in grey scale Figure 4.34: EBSD analysis of 2A97-T6 aluminium alloy (a) IPFZ map, (b) Grain boundary misorientation distribution map with black lines and grey lines representing HAGBs and LAGBs, (c) Histogram of grain boundary misorientation distribution in 2A97-T6 aluminium alloy, (d) Grain-stored energy distribution in grey scale Figure 4.35: HAADF micrographs of 2A97 Al-Cu-Li alloys, revealing the distribution of dispersoids in (a) T3 alloy, (b) T4 alloy, (c) T6 alloy, (d) T8 alloy and typical EDX spectra of the dispersoids: (e) Al-Cu-Mn dispersoid and (f) Al-Zr dispersoid Figure 4.36: (a) Ultra-high resolution SEM micrograph, (b)-(d) HAADF micrographs at different magnifications of 2A97-T3 alloy Figure 4.37: (a) Ultra-high resolution SEM micrograph of a grain boundary junction in 2A97-T4 alloy, (b) Grain boundary A-A in (a) at higher magnification, (c)-(d) Bright field TEM micrographs of typical grain boundaries in 2A97-T4 alloy
8 Figure 4.38: HAADF micrographs of 2A97-T4 alloy, revealing the heterogeneous distribution of precipitates in the alloy matrix Figure 4.39: (a) Bright field TEM micrograph of 2A97-T6 alloy, (b) HAADF micrograph of 2A97-T6 alloy, (c) High resolution TEM micrograph of the needleshaped precipitate, with FFT result inset, (d) HAADF micrograph, revealing the heterogeneous distribution of precipitates in the 2A97-T6 alloy matrix Figure 4.40: (a) HAADF micrograph of 2A97-T6 alloy, (b) Bright field TEM micrograph of a typical grain boundary in 2A97-T6 alloy, (c)-(d) Ultra-high resolution SEM micrographs of 2A97-T6 alloy Figure 4.41: (a) Bright field TEM micrograph of 2A97-T8 alloy, (b) High resolution TEM micrograph of the needle-shaped precipitate, with FFT result inset, (c) Ultra-high resolution SEM micrograph, (d)-(e) Bright field TEM micrographs of a typical grain boundary at different tilting angles, (f) HAADF micrograph of a triple joint of grain boundaries in 2A97-T8 alloy Figure 5.1: Scanning electron micrographs of AA2024-T351 aluminium alloy surface (a) General view before the immersion, (b) General view after the immersion for 30 min, (c)-(d) Stable localized corrosion site of marked area in (b) at increased magnification Figure 5.2: Scanning electron micrographs and corresponding EDX spectra (a) General view before the immersion, (b) General view after the immersion for 30 min, (c) EDX spectrum before the immersion of particle A, (d) EDX spectrum before the immersion of particle B, (e) High resolution SEM micrograph after the immersion of particle A, (f) High resolution SEM micrograph after the immersion of particle B, (g) EDX spectrum after the immersion of particle A, (h) EDX spectrum after the immersion of particle B Figure 5.3: Scanning electron micrographs of a typical S-phase particle after 30 min immersion in a 3.5 wt. % NaCl solution (a) Secondary electron micrograph, (b) Backscattered electron micrograph, (c)-(d) Typical areas in the S-phase particle at higher magnifications Figure 5.4: Transmission electron micrographs and corresponding diffraction pattern of an ultramicrotomed foil of AA2024-T351 alloy after the immersion in a 3.5 wt. % NaCl solution for 1 minute (a) General view, (b)-(c) At increased magnifications, (d) Diffraction pattern of the de-alloyed area in the S-phase particle Figure 5.5: (a)-(b) Scanning electron micrographs of a typical θ-phase particle after the immersion in a 3.5 wt. % NaCl solution for 30 min followed by GDOS to clean the alloy surface after the immersion, (c)-(d) Scanning electron micrographs of typical θ- phase particles after the immersion for 2 hours Figure 5.6: Scanning electron micrographs of typical de-alloyed θ-phase particles with banding structures (a)-(b) A severely de-alloyed θ-phase particle at different magnifications, (c)-(d) Typical θ-phase particles with mild de-alloying, (e)-(f) Cross sections of a typical de-alloyed θ-phase particle generated using focussed ion beam Figure 5.7: Transmission electron micrographs and corresponding diffraction pattern of a de-alloyed θ-phase particle (a) General view, (b) Corresponding diffraction pattern with indexed results, (c) Increased magnification, (d) High resolution TEM micrograph 8
9 displaying the linear defects, inset: corresponding FFT result, in consistent with diffraction pattern Figure 5.8: (a) HAADF micrograph of a de-alloyed θ-phase particle, (b) HAADF micrograph of typical ligaments in the de-alloyed θ-phase particle, with the corresponding EDX copper map inset, (c) High resolution HAADF micrograph of the linear crystallographic defects marked in (a), with the corresponding FFT results inset, revealing the crystallographic orientation, (d) HAADF micrograph of the typical ligaments in the de-alloyed θ-phase particle, with the orientations marked Figure 5.9: Scanning electron micrographs of Al-Cu-Fe-Mn intermetallic particles after the immersion in a 3.5 wt. % NaCl solution for (a) 2 hours, (b) 24 hours Figure 5.10: Typical Al-Cu-Fe-Mn intermetallic particles after the immersion for 24 hours (a)-(b) SEM micrographs of a typical Al-Cu-Fe-Mn intermetallic particle, (c)-(d) SEM micrographs of another typical Al-Cu-Fe-Mn intermetallic particle, (e) EDX maps of the Al-Cu-Fe-Mn intermetallic particle shown in (c)-(d), in the sequence of Al, Cu, Fe, Mn, Mg and O Figure 5.11: Scanning electron micrographs of Al-Cu-Fe-Mn intermetallic particles after 24 hours immersion with gentle polishing to remove the corrosion product layer (a)-(b) Typical Al-Cu-Fe-Mn intermetallic particles with linear de-alloyed bands, (c)-(d) A typical Al-Cu-Fe-Mn intermetallic particle with linear de-alloyed bands at different magnifications Figure 5.12: (a) Scanning electron micrograph of a typical intermetallic particle cluster prior to the immersion testing, (b)-(e) EDX spectra corresponding to points 1-4 shown in (a), (f)-(i) Kikuchi patterns along with the corresponding indexed results from point 1 and point 3, (j) Scanning electron micrograph of the intermetallic particle cluster after the immersion for 30 min Figure 5.13: (a) Scanning electron micrograph of the intermetallic particle cluster prior to the immersion testing, (b)-(d) EDX spectra corresponding to points 1-3 shown in (a), (e)-(g) Kikuchi patterns along with the corresponding indexed results from points 1-3 in shown in (a), (h) Scanning electron micrograph of the intermetallic particle cluster after 30 min immersion, (i)-(j) EDX spectra of point 1 and point 3 shown in (h) Figure 5.14: Scanning electron micrographs of intermetallic particle clusters after 2 hours immersion in a 3.5 wt. % NaCl solution (a) General view, (b)-(d) Typical clusters Figure 5.15: (a) Scanning electron micrograph of an attacked intermetallic particle cluster after 2 hours immersion in a 3.5 wt. % NaCl solution, (b) EDX maps of the intermetallic particle cluster shown in (a), in the sequence of Al, Cu, O, Mn, Fe and Mg Figure 5.16: Electrochemical measurement of AA2024-T351 aluminium alloy in a 3.5 wt. % NaCl solution (a) Voltage-current density curve during the anodic polarization, Scanning electron micrographs of the AA2024-T351 aluminium alloy after anodic polarization, (b) Plan-view, (c)-(e) Cross section at various magnifications Figure 5.17: Optical micrographs of AA2024-T351 aluminum alloy at different stages during the immersion testing (a) At the beginning of the immersion in a 3.5 wt. % NaCl solution, (b) After 30 min immersion in a 3.5 wt. % NaCl solution, (c) Moving to 9
10 deionized water after 30 min immersion in NaCl solution, (d) After 30 min immersion in deionized water Figure 5.18: Scanning electron micrographs of typical stable localized corrosion sites in AA2024-T351 aluminium alloy after the immersion in a 3.5 wt. % NaCl solution for 30 min followed by the immersion in deionized water for another 30 min (a) Plan-view, (b) Tilted 30, (c) Cross section with an attacked intermetallic particle intersected the alloy surface, (d) Attacked intermetallic particle in (c) at higher magnification; Other typical cross sections after the identical immersion testing, (e) Cross section with an attacked intermetallic particle buried beneath alloy surface, (f) Cross section with no attacked intermetallic particle beneath alloy surface Figure 5.19: Scanning electron micrographs of typical cross sections at stable localized corrosion sites in AA2024-T351 aluminium alloy after the immersion in a 3.5 wt. % NaCl solution for 30 min Figure 5.20: Scanning electron micrographs of typical cross sections at stable localized corrosion sites in AA2024-T351 aluminium alloy after the immersion in a 3.5 wt. % NaCl solution for 60 min Figure 5.21: 3D volumetric reconstruction of a typical stable localized corrosion site of AA2024-T351 aluminium alloy after the immersion in a 3.5 wt. % NaCl solution followed by deionized water, with selective transparency applied to alloy matrix, and red and yellow applied to represent intermetallic particles and corrosion product, respectively Figure 5.22: Scanning electron micrographs of AA2024 alloy surface (a)-(c) After the immersion in a 3.5 wt. % NaCl solution for 40 min followed by the immersion in 3.5 wt. % NaCl solution with 10-4 M copper chloride as addition for another 40 min, (d)-(f) After the immersion in a 3.5 wt. % NaCl solution for 40 min followed by the immersion in deionized water with 10-4 M copper chloride as addition for another 40 min, (g)-(j) After the immersion in a 3.5 wt. % NaCl solution for 40 min followed by the immersion in deionized water for another 40 min, then the specimen was immersed in 0.01 M copper chloride solution for 5 seconds Figure 5.23: TEM analysis of an intergranular corrosion filament in AA2024-T351 alloy after the immersion in a 3.5 wt. % NaCl solution for 30 min followed by deionized water for another 30 min (a) Bright field TEM micrograph, (b) HAADF micrograph, (c)-(d) EDX spectra from point 1, point 2 and point 3 in (b), (e) EDX line-scan result along line 1 in (b), (f) The copper EELS map of the corrosion front shown in (b), (g) High resolution TEM micrograph. Inset: fast Fourier transform of the framed region, indicating Al 2 Cu phase Figure 5.24: Typical HAADF micrographs of attacked grain boundaries along with the intergranular corrosion front in AA2024-T351 aluminium alloy after the immersion in a 3.5 wt. % NaCl solution for (a)-(b) 1 hour, (c)-(d) 8 hours Figure 5.25: (a) HAADF micrograph of AA2024-T351 aluminium alloy after alkaline etching, (b) Cathodic polarization curves for as-received and alkaline-etched AA2024- T351 alloy in de-aerated 3.5 wt. % NaCl (with HCl to ph=3) testing solution with a scanning rate of 1 mv/s
11 Figure 5.26: (a) Scanning electron micrograph of a typical stable localized corrosion site in AA2024-T351 aluminium alloy after the immersion in a 3.5 wt. % NaCl solution for 8 hours, with misorientations of attacked grain boundaries marked, (b) Histogram of the attacked grain boundary misorientation distribution in corroded AA2024-T351 aluminium alloy, with the abscissa axis representing the grain boundary misorientation value and longitudinal axis representing the frequency Figure 5.27: (a) SEM micrograph of a typical stable localized corrosion site on the surface of AA2024-T351 aluminium alloy, (b) Crystallographic orientation distribution in Euler's colour, (c) Grain-stored energy distribution in grey scale, with yellow lines applied to represent HAGBs, (d) SEM micrograph of a typical cross section at the stable localized corrosion site in AA2024-T351 aluminium alloy, (e) Crystallographic orientation distribution in Euler's colour, (f) Grain-stored energy distribution in grey scale Figure 5.28: Scanning electron micrographs of AA2024-T351 aluminium alloy after 15 hours immersion in a 3.5 wt. % NaCl solution (a) Plan-view of a typical stable localized corrosion site, (b) Framed area in (a) at increased magnification, (c)-(d) Typical crystallographic pits, (e) Cross section of a stable localized corrosion site, (f) Framed area in (e) at increased magnification Figure 5.29: Scanning electron micrographs of AA2024-T351 aluminium alloy after 15 hours immersion in a 3.5 wt. % NaCl solution (a)-(b) Typical stable localized corrosion sites, and a region containing an attacked grain boundary and crystallographic pits (c)-(d) At 1.5 kv, (e)-(f) At 10 kv, (g)-(h) At 20 kv Figure 5.30: (a) 3D reconstruction result of a typical localized corrosion site characterized by attacked grain boundaries and crystallographic pits, with yellow and red representing corrosion product and intermetallic particles, respectively, (b) 3D reconstruction result at the same site with only corrosion product shown Figure 5.31: (a) SEM micrograph of a typical localized corrosion site on the surface of AA2024-T351 aluminium alloy after 15 hours immersion in a 3.5 wt. % NaCl solution, with the inset displaying the crystallographic orientations ({111}: blue; {001}: red; {011}: green), (b) Kikuchi pattern obtained from the marked location as shown in (a), (c) Indexed result of the Kikuchi pattern shown in (b) Figure 5.32: HAADF micrographs and EDX analysis of crystallographic pits in AA2024-T351 aluminium alloy after the immersion in a 3.5 wt. % NaCl solution (a) General view of localized corrosion site, (b)-(c) Crystallographic pits along attacked grain boundary at different magnifications, (d)-(f) Crystallographic pits in the grain interior at various magnifications, (g) EDX spectra from point 1 and point 2 in (f), (h) Copper EELS map of the crystallographic pit shown in (f) Figure 5.33: Schematic diagram showing the development of intergranular corrosion in the corrosion front area Figure 5.34: Schematic diagram showing the development of crystallographic corrosion into the grain interior following the grain boundary attack Figure 6.1: Scanning electron micrographs of alloy surfaces after the immersion in a 3.5 wt. % NaCl solution for 5 hours (a) 2A97-T3, (b) 2A97-T4, (c) 2A97-T6, (d) 2A97-T8 Al-Cu-Li alloys
12 Figure 6.2: Typical intermetallic particle after 5 hours immersion in a 3.5 wt. % NaCl solution (a) Backscattered electron micrograph, (b) EDX maps, in the sequence of Al, Cu, Fe, Mn, Mg, Zn and O Figure 6.3: Typical intermetallic particles with banding structure along certain orientation after 5 hours immersion (a) BSE micrograph of the intermetallic particle on the alloy surface, (b) The framed area in (a) at increased magnification, (c)-(d) BSE and SE micrographs of the intermetallic particle on the cross section beneath the alloy surface, (e) EDX maps of the intermetallic particle shown in (a), in the sequence of Al, Cu, Fe, Mg, O, Mn and Zn Figure 6.4: Scanning electron micrographs of alloy surfaces after 20 hours immersion in a 3.5 wt. % NaCl solution (a) 2A97-T3, (b) 2A97-T4, (c) 2A97-T6 and (d) 2A97-T8 Al- Cu-Li alloys Figure 6.5: Scanning electron micrographs of the alloy surface after 20 hours immersion in a 3.5 wt. % NaCl solution (a) Secondary electron micrograph, (b) Backscattered electron micrograph, (c) EDX maps of the intermetallic particle shown in (b), in the sequence of Al, Cu, Fe, Mn, Mg, Zn and O Figure 6.6: Typical intermetallic particle after 20 hours immersion in a 3.5 wt. % NaCl solution (a) SEM micrograph of a typical intermetallic particle, (b) Framed area in (a) at increased magnification, (c) EDX maps of the intermetallic particle shown in (a), in the sequence of Al, Cu, Zn, Mn, Fe and O Figure 6.7: Typical intermetallic particles after 20 hours immersion in a 3.5 wt. % NaCl solution, with copper re-distribution (a)-(b) BSE micrographs of typical intermetallic particles, (c) EDX maps of the intermetallic particle shown in (a), in the sequence of Al, Cu, Fe, Mn, Mg, Zn and O Figure 6.8: Potentiodynamic polarization curves of 2A97 aluminium alloys in various tempers Figure 6.9: Scanning electron micrographs of typical stable localized corrosion sites in 2A97-T3 Al-Cu-Li alloy (a)-(b) Plan-view at different magnifications, (c) Typical cross section after 5 hours immersion, (d)-(f) Typical cross section after 20 hours immersion Figure 6.10: EBSD analysis of typical stable localized corrosion sites in 2A97-T3 Al- Cu-Li alloy (a)-(b) Scanning electron micrographs of localized corrosion sites, (c)-(e) EBSD reconstruction maps of the area containing the localized corrosion sites shown in (a)-(b), revealing the distribution of grain orientation in Euler s colour, grain-stored energy and subgrain-stored energy in grey scale, (f) Scanning electron micrograph of another localized corrosion site, (g)-(h) EBSD reconstruction maps of the area shown in (f), revealing the distribution of grain orientation in Euler's colour and grain-stored energy in grey scale Figure 6.11: TEM analysis of typical stable localized corrosion sites in 2A97-T3 Al-Cu- Li alloy (a)-(c) Bright field TEM micrographs at different magnifications, (d) HAADF micrograph, (e) EDX point spectra from points 1 and 2 in (d), (f) High resolution TEM micrograph with the FFT result of the framed area inset
13 Figure 6.12: (a) Cathodic polarization curves of as-received and etched 2A97-T3 aluminium alloys, (b) Bright field TEM micrograph of a typical cross section of etched 2A97-T3 aluminium alloy, (c) EDX line-scan result along the red line in (b) Figure 6.13: Scanning electron micrographs of typical stable localized corrosion sites in 2A97-T4 Al-Cu-Li alloy after the immersion in a 3.5 wt. % NaCl solution for 5 hours (a) Plan-view, (b)-(c) Cross section along A-A in (a) at different magnifications, (d)-(f) Another typical cross section at the stable localized corrosion site developed in 2A97- T4 Al-Cu-Li alloy at different magnifications Figure 6.14: Scanning electron micrographs of a typical stable localized corrosion site in 2A97-T4 Al-Cu-Li alloy after the immersion in a 3.5 wt. % NaCl solution for 20 hours (a) Plan-view, (b)-(c) Cross section along A-A in (a) at different magnifications, (d)-(f) Cross section along B-B in (a) at different magnifications Figure 6.15: EBSD analysis of a typical stable localized corrosion site in 2A97-T4 Al- Cu-Li alloy (a) Scanning electron micrograph, (b) Framed area in (a) at increased magnification, (c)-(d) Grain orientation distribution in Euler s colours and grain-stored energy distribution in grey-scale of the area shown in (a), (e)-(f) Kikuchi pattern and the corresponding indexed result from the area shown in (b) Figure 6.16: SEM micrographs of typical stable localized corrosion sites along with the corresponding Kikuchi patterns and indexed results (a)-(c) One site with banding structure in the direction parallel with {001} oriented planes, (d)-(f) Another site with banding structure in the direction parallel with {111} oriented planes Figure 6.17: TEM analysis of stable localized corrosion sites in 2A97-T4 Al-Cu-Li alloy (a)-(b) Bright field TEM micrographs, (c) HAADF micrograph, (d) EDX line-scan result along the red line in (c), (e) High resolution TEM micrograph with the FFT result of the framed area inset Figure 6.18: (a) Bright field TEM micrograph of the cross section of etched 2A97-T4 alloy, (b) HAADF micrograph of the cross section of etched 2A97-T4 alloy, (c) High resolution TEM micrograph along with FFT result of the framed area inset, (d) Cathodic polarization curves of as-received and etched 2A97-T4 aluminium alloys Figure 6.19: Scanning electron micrographs of typical stable localized corrosion sites in 2A97-T6 Al-Cu-Li alloy (a) Plan-view, (b)-(c) Cross section along A-A in (a) at different magnifications, (d)-(e) Typical cross section with banding structure at different magnifications Figure 6.20: EBSD analysis of a typical stable localized corrosion site in 2A97-T6 Al- Cu-Li alloy (a)-(b) Scanning electron micrographs of a typical stable localized corrosion site at different magnifications, (c) Grain orientation distribution in Euler's colour of the area shown in (a), (d) Grain-stored energy distribution in grey scale of the area shown in (a), (e) Dislocation distribution of the area shown in (a), (f)-(g) Kikuchi pattern along with the corresponding indexed result of the area shown in (b) Figure 6.21: SEM micrographs and the corresponding Kikuchi pattern of a typical localized corrosion with the banding structure (a) General view (b) Framed area in (a) at increased magnification, (c)-(d) Kikuchi pattern with the indexed result obtained from the marked point shown in (a)
14 Figure 6.22: TEM analysis of stable localized corrosion sites in 2A97-T6 Al-Cu-Li alloy (a)-(b) Bright field TEM micrographs, (c)-(d) HAADF micrographs, (e) EDX spectra of points 1 and 2 shown in (d), (f) Bright field TEM micrograph of the area for EELS analysis, (g)-(h) EELS mapping results of copper and lithium, (i) High resolution TEM micrograph with the corresponding FFT result of the framed area inset Figure 6.23: (a) Bright field TEM micrograph of the cross section of the etched 2A97- T6 aluminium alloy, (b) HAADF micrograph, (c)-(d) Bright field TEM micrograph of the selected area and the corresponding EELS Li map, (e) High resolution TEM micrograph with the FFT result of the framed area inset, (f) Cathodic polarization curves of as-received and etched 2A97-T6 aluminium alloys Figure 6.24: Scanning electron micrographs of a typical stable localized corrosion site in 2A97-T8 Al-Cu-Li alloy after 5 hours immersion in a 3.5 wt. % NaCl solution (a) Plan-view, (b) Cross section along A-A in (a), (c)-(f) Cross section along B-B in (a) at different magnifications Figure 6.25: Scanning electron micrographs of typical stable localized corrosion sites in 2A97-T8 Al-Cu-Li alloy after 20 hours immersion in a 3.5 wt. % NaCl solution (a)-(c) Plan-view of typical stable localized corrosion sites, (d) Typical crystallographic pits at increased magnification, (e)-(f) Cross sections of typical stable localized corrosion sites Figure 6.26: EBSD analysis of the 2A97-T8 Al-Cu-Li alloy applied for grain-stored energy study (a) Crystallographic orientation distribution map in Euler s colour, (b) IPFZ map of the corresponding area, (c)-(d) Stored energy distribution of the corresponding area Figure 6.27: Scanning electron micrographs of typical stable localized corrosion sites developed in the 2A97-T8 Al-Cu-Li alloy applied for grain-stored energy study after 20 hours immersion in a 3.5 wt. % NaCl solution at various magnifications Figure 6.28: Scanning electron micrographs and EBSD analysis of a typical stable localized corrosion in the 2A97-T8 Al-Cu-Li alloy for grain-stored energy study (a) General view, (b) The stable localized corrosion site at increased magnification, (c) Crystallographic orientation distribution in Euler s colour, (d) Grain-stored energy distribution in grey scale Figure 6.29: Scanning electron micrographs and the corresponding Kikuchi pattern on the surface of 2A97-T8 alloy after the immersion in a 3.5 wt. % NaCl solution for 20 hours (a) A typical localized corrosion site on the surface, (b)-(c) Kikuchi pattern and the corresponding indexed result of the area shown in (a), (d)-(e) Typical crystallographic pits in (a) at increased magnifications Figure 6.30: TEM analysis of typical stable localized corrosion sites developed in 2A97-T8 Al-Cu-Li alloy after the immersion in a 3.5 wt. % NaCl solution (a)-(b) Bright field TEM micrographs of crystallographic pits at different magnifications, (c) EDX spectra of points 1 and 2 as shown in (b), (d)-(e) Bright field TEM micrograph and HAADF micrograph of a typical localized corrosion site, (f) EDX spectra of points 3 and 4 as shown in (e), (g) Bright field TEM micrograph of the corrosion front area, (h) EELS Li map of the area shown in (g), (i) High resolution TEM micrograph with FFT result of the framed area inset
15 Figure 6.31: (a) Bright field TEM micrograph of an ultramicrotomed cross section of etched 2A97-T8 aluminium alloy, (b) Cathodic polarization curves of as-received and etched 2A97-T8 aluminium alloys Figure 6.32: Schematic diagrams displaying the microstructure of 2A97 Al-Cu-Li alloys under various thermomechanical conditions, with the needle-shaped symbol and grey level representing T 1 phase precipitate and copper content level in the alloy matrix, respectively (a) T3, (b) T4, (c) T6, (d) T Figure 6.33: Schematic diagram illustrating the corrosion mechanism of the development of the banding structure in 2A97 Al-Cu-Li alloys
16 List of Tables Table 2.1: The influence of alloying elements Table 2.2: Series of aluminium alloys Table 4.1: Compositions of α-phase particles corresponding to the EDX spectra in Figures 4.2 (c)-(d), with the red values indicating the evident difference of alloying element contents in both particles Table 5.1: Compositions of particle A, particle B and the alloy matrix (as shown in Figure 5.2) before and after the immersion in a 3.5 wt. % NaCl solution (wt. %) Table 5.2: Population density of localized corrosion sites on AA2024-T351 alloy surface after the immersion in 3.5 wt. % NaCl solution / deionized water Table 5.3: Average and maximum corrosion depth for AA2024-T351 alloy after the immersion in 3.5 wt. % NaCl solution / deionized water
17 Abstract In the present work, the relationship between the microstructure and the corrosion behaviour of Al-Cu-Mg and Al-Cu-Li alloys with various thermomechanical conditions has been studied. The microstructural characterization of the AA2024-T351 Al-Cu-Mg alloy revealed that the constituent intermetallic particles, assigned as S-phase (Al 2 CuMg), θ-phase (Al 2 Cu) and α-phase (Al-Cu-Fe-Mn-(Si)), are present individually or together as clusters. Further, precipitates along with Mg / Cu segregations were detected along the grain boundary network. It was also revealed that the cold working to obtain T351 temper resulted in the heterogeneous distribution of grain-stored energy. It was revealed that selective dissolution of Mg from the S-phase particle results in the copper-rich S-phase remnant, which contributes to the conversion of its electrochemical property. As a result, the micro-galvanic coupling between the S-phase remnant and the alloy matrix leads to the development of trenching at its adjacent. Trenching was also found in the periphery of the θ-phase particle and the α-phase particle, due to their more positive electrode potentials relative to that of the alloy matrix. Further, selective dissolution also occurred in the θ-phase and α-phase particles, resulting in the development of porous banding structure along certain orientation. Localized corrosion in the AA2024-T351 aluminium alloy preferentially propagated in the form of intergranular corrosion at the early stage of the exposure to sodium chloride solution. The distribution of grain-stored energy significantly affects the development of intergranular corrosion. With prolonged exposure time, localized corrosion propagated selectively into grain interior, resulting in the development of crystallographic pits. In the corrosion front area, the necessary chemical condition (low ph and chloride rich) was generated and maintained. Meanwhile, a copper-enriched layer beneath the corrosion product layer acted as an effective cathode to support the anodic dissolution. Therefore, the anodic dissolution of aluminium at the corrosion front is self-supported. The 2A97 Al-Cu-Li alloys in different thermomechanical conditions exhibited different amounts and distributions of T 1 phase (Al 2 CuLi) precipitates since the pre-ageing cold working and the ageing condition significantly affect the T 1 phase precipitation in Al- Cu-Li alloys. Further, the different thermomechanical histories also resulted in significantly different grain structures in the alloys. The corrosion morphology of the 2A97 alloy is closely associated with the distribution of T 1 phase precipitates. In the T3 condition, attacked grain boundaries are the dominant corrosion features since T 1 phase precipitates distribute along selective grain boundaries. In the T4 condition, localized corrosion propagated in the form of intergranular corrosion and developed into the grain interior with prolonged immersion time, related to the distribution of T 1 phase precipitates. In contrast, crystallographic pits are evident in the grain interior of 2A97-T6 alloy due to the high population density of matrix T 1 phase precipitates. Both grain interior and grain boundary were selectively attacked in the 2A97-T8 alloy during the immersion testing, which is consistent with the T 1 phase precipitates distribution. Further, it was also found that the selective corrosion behaviour in the 2A97 Al-Cu-Li alloys is closely associated with the heterogeneous distribution of grain-stored energy, with high localized corrosion susceptibility corresponding to high level of stored energy. 17
18 Declaration No portion of the work referred to in this thesis has been submitted in support of an application for another degree or qualification of this or any other university or other institution of learning Xinxin Zhang 18
19 Copyright Statement i. The author of this thesis (including any appendices and/or schedules to this thesis) owns certain copyright or related rights in it (the Copyright ) and s/he has given The University of Manchester certain rights to use such Copyright, including for administrative purposes. ii. Copies of this thesis, either in full or in extracts and whether in hard or electronic copy, may be made only in accordance with the Copyright, Designs and Patents Act 1988 (as amended) and regulations issued under it or, where appropriate, in accordance with licensing agreements which the University has from time to time. This page must form part of any such copies made. iii. The ownership of certain Copyright, patents, designs, trade marks and other intellectual property (the Intellectual Property ) and any reproductions of copyright works in the thesis, for example graphs and tables ( Reproductions ), which may be described in this thesis, may not be owned by the author and may be owned by third parties. Such Intellectual Property and Reproductions cannot and must not be made available for use without the prior written permission of the owner(s) of the relevant Intellectual Property and/or Reproductions. iv. Further information on the conditions under which disclosure, publication and commercialisation of this thesis, the Copyright and any Intellectual Property and/or Reproductions described in it may take place is available in the University IP Policy (see in any relevant Thesis restriction declarations deposited in the University Library, The University Library s regulations (see and in The University s policy on presentation of Theses. 19
20 Acknowledgements I would like to express my heartfelt appreciation and gratitude to my supervisor, Prof Xiaorong Zhou, for his invaluable guidance and great support throughout every stage of my graduate studies. Thanks to all the staff in Corrosion and Protection Centre and Materials Science Centre. It has been a great pleasure to work and interact with them. I express my gratitude to Mr. Teruo Hashimoto not only for his help with the high resolution TEM analysis, but also for his help and valuable discussion on my research work. My appreciation also goes to Dr Octav Ciuca for his kind help on twin-jet electropolishing. In addition, I wish to thank Dr John Lindsay for his assistance for TEM specimen preparation with FIB. Thanks to all my colleagues in Corrosion and Protection Centre and in the School of Materials, with whom I have spent three years together, in particular, Dr Bing Liu, Dr Bo Chen, Dr Jiantao Qi, Wei Shi, Daishu Qian, Yingwei Fan, Wu Wei and Gunan Shang. You made me feel quite happy all the time and I have learned a lot from all of you. I would like to acknowledge the Engineering and Physical Sciences Research Council LATEST2 Portfolio Partnership and China Scholarship Council for provision of financial support. Special thanks go to my parents and my boyfriend, for their love and encouragement, and for supporting me in many ways throughout my life. 20
21 Chapter 1: Introduction CHAPTER 1 Introduction 21
22 Chapter 1: Introduction 1 Introduction AA2024 aluminium alloy has been widely used in the aircraft industry as a structural material for decades due to its high strength to weight ratio and high damage tolerance. Although AA2024 alloy is being gradually replaced by new alloys, such as Al-Cu-Li alloys, the corrosion behaviour of AA2024 aluminium alloy still attracts significant attention to meet the request for safe operation and maintenance of the existing fleet of aircrafts that are still in service. Al-Cu-Li alloy, as a new generation aerospace aluminium alloy, is a promising substituent for traditional 2000 and 7000 series aluminium alloys due to its lower density along with superior mechanical properties. However, the alloy is not immune to localized corrosion in aggressive environment, which may limit its application in the aircraft industry. Therefore, a comprehensive understanding of the corrosion behaviour of Al-Cu-Li alloys is necessary for its wide application in the aircraft industry. Although extensive research on localized corrosion of aluminium alloys has been undertaken for more than half a century, the mechanisms of localized corrosion initiation and propagation are still under debate. The precise relationship between the local microstructure and the localized corrosion development has not been fully understood. Additionally, little investigation has been carried out to correlate the local grain structure and local strain with the corrosion propagation path, which is particularly important for cold worked alloys. Further, the influence of lithium addition on the localized corrosion resistance of the lithium-containing aluminium alloy has not been determined yet. The main goal of the present work is to establish the relationship between the alloy microstructure and the initiation and propagation of localized corrosion of AA2024- T351 and 2A97 aluminium alloys in different thermomechanical conditions. The thesis consists of seven chapters. Following the introductory chapter, literature review about relevant background and recent progress in the field is given in Chapter 2. The experimental method employed in the present work is described in Chapter 3. Chapters 4, 5 and 6 are focussed on the experimental results and related discussion. In Chapter 4, the microstructure of AA2024-T351 and 2A97 aluminium alloys in different thermomechanical conditions was characterized using a range of electron microscopy 22
23 Chapter 1: Introduction techniques, revealing the distribution of constituent intermetallic particles, dispersoids and precipitates as well as the grain structure of the aluminium alloys. The comprehensive understanding of the microstructure is the foundation for the subsequent work. The corrosion behaviour of AA2024-T351 aluminium alloy is addressed in Chapter 5. Electrochemical measurement along with a range of electron microscopy techniques, including scanning electron microscopy (SEM) and transmission electron microscopy (TEM), was applied to advance the understanding of the localized corrosion development in AA2024-T351 aluminium alloy. Two dominant corrosion types, i.e. intergranular corrosion and crystallographic pitting, were observed and discussed. Chapter 6 is aimed at understanding the influence of thermomechanical histories on the localized corrosion behaviour of 2A97 Al-Cu-Li alloys. The corrosion morphologies of the alloys after the immersion testing were examined, revealing the significant influence of the thermomechanical histories on the corrosion susceptibility of Al-Cu-Li alloys. Finally, the main conclusions and suggestions for future work are summarized in Chapter 7. 23
24 Chapter 2: Literature Review CHAPTER 2 Literature Review 24
25 Chapter 2: Literature Review 2 Literature Review 2.1 Introduction Aluminium has attractive properties for engineering application, such as high electrical and thermal conductivity, high reflectivity and high strength-to-weight ratio, with abundant resource in the earth s crust. Due to the protective oxide film developed on the surface of aluminium, aluminium also displays high corrosion resistance [1-4]. However, pure aluminium only has a narrow field of application due to its mechanical properties. Therefore, aluminium alloys are developed with the addition of alloying elements to achieve desirable mechanical properties for a wider application. Extensive work has been carried out about aluminium with various alloying elements and related processes (thermomechanical and manufacturing processes included) for over 100 years, resulting in a wide range of aluminium alloys to meet various engineering requirements [1, 5]. The most widely applied alloying elements in aluminium alloys include copper, magnesium, manganese, silicon, zinc and, recently, lithium. Generally, 1 to 7% alloying elements are added in aluminium alloys. However, in some extreme cases, up to 20% silicon is added to improve the casting behaviour of aluminium alloys. The general influence of the main alloying elements is displayed in Table 2.1 [4]. All aluminium products belong to one of the eight alloy series shown in Table 2.2 [4], depending on the types of alloying elements. Besides the classification based on the alloying elements, aluminium alloys can be classified into two groups as wrought and cast aluminium alloys, based on processing procedure [6, 7]. Around 75 to 80% of aluminium alloys are supplied as wrought products in sheet, rolled plate, foil and so on. The wrought aluminium alloys are generally produced from casting ingots and further manufactured by various processes, such as rolling, extrusion and forging [8]. Even though cast aluminium alloys generally have lower strengths with respective to wrought aluminium alloys, they are widely used as cost-effective products with complex geometrical shapes [7]. Aluminium alloys can also be classified into two groups as heat-treatable and non-heattreatable aluminium alloys, depending on heat treatability. Heat-treatable aluminium 25
26 Chapter 2: Literature Review alloys include 2XXX, 6XXX and 7XXX aluminium alloys. And additional mechanical properties of this type of aluminium alloys can be obtained through heat treatments like quenching or artificial ageing, which could also be obtained by introducing extra plastic deformation with mechanical working. In contrast, the mechanical properties of nonheat-treatable aluminium alloys, usually in 1XXX, 3XXX, 4XXX and 5XXX aluminium alloys, only depend on mechanical working [1]. 2.2 Microstructure of aluminium alloys Based on the different formation mechanisms, the distribution and the influence on the alloy property, second phases in aluminium alloys are divided into three types: constituent intermetallic particles, dispersoids and precipitates [1, 9]. Constituent intermetallic particles are also termed as coarse intermetallic compounds or intermetallic particles with the dimensions larger than 1 µm. The formation of constituent particle results from the liquid-solid eutectic reaction during the ingot solidification. The transformation of constituent particles is possible during subsequent heat treatments at high temperature. Constituent intermetallic particles could be divided into two groups based on the solubility during the thermomechanical process. One group is generally soluble, consisted of major alloying elements in the equilibrium intermetallic phase, such as Al 2 Cu, Al 2 CuMg and Mg 2 Si. In the ingot homogenization process, the dissolution of this type of constituent particles provides available alloying elements for further microstructural evolution. The other group has high resistance to dissolution during the heat treatment. The constituent particle in this group is usually comprised of alloying elements with relatively high melting points, such as iron. During the subsequent fabrication process, most constituent particles could be broken and re-distributed in the direction parallel with the metal flowing direction. In most applications, constituent intermetallic particles are detrimental to the property of the aluminium alloy. The corrosion resistance along with the damage tolerance could be compromised with the presence of constituent intermetallic particles. Dispersoids, with typical dimensions ranging from 0.05 µm to 0.5 µm, form during the ingot homogenization. The typical dispersoid contains transition metals, such as Zr, Mn and Cr. Unlike constituent intermetallic particles, dispersoids generally have high 26
27 Chapter 2: Literature Review stability, thereby resisting dissolution and coarsening during the subsequent thermomechanical treatment. As a result, dispersoids serve to pin the grain boundary and control the grain size during the thermomechanical treatments. Fine precipitates, typically with the dimensions smaller than 0.1 µm, generally form during the ageing process. The formation of precipitates has been extensively studied since the mechanical properties of heat treatable aluminium alloys mainly depend on precipitates formed during the ageing [9, 10] Microstructure of Al-Cu-Mg alloys Microstructural heterogeneity developed in Al-Cu-Mg alloys, especially the AA2024 aluminium alloy, has attracted wide attention due to its wide application in the transportation industry [11-13]. However, the microstructure of AA2024 aluminium alloy, comprising of the alloy matrix and a range of second phase particles, is complex and exhibits difference for different batches [14]. Even with extensive work, the full understanding of the microstructure in AA2024 aluminium alloy is never achieved Constituent intermetallic particles The characterization of the constituent intermetallic particles in AA2024-T3 aluminium alloy was also carried out by Campestrini et al. [15, 16]. Two types of constituent intermetallic particles were determined by the combination of SEM and EDX analysis, which are Al-Cu-Mg particles and Al-Cu-Fe-Mn particles. Typically, Al-Cu-Mg particles are round-shaped, with the dimension ranging from 1 to 5 µm. Due to the large penetration depth of the electron beam during the EDX analysis with respect to the Al- Cu-Mg particles, the quantitative identification of chemical composition of Al-Cu-Mg particles is difficult, which indicates the presence of a range of second phase particles rich in Mg and Cu in the alloy. Al-Cu-Fe-Mn particles have irregular shapes with much larger dimensions around 10 µm. EDX analysis of Al-Cu-Fe-Mn particles indicates that the composition of the particles varies, with significant difference on the contents of copper and silicon. Further, the characterization of constituent intermetallic particles in AA2024-T3 aluminium alloy was carried out with SEM, EPMA and XRD in Buchheit s work [17]. With the successful application of thermodynamic rules, most constituent particles in AA2024-T3 alloy were identified. It was revealed that over 60% constituent particles with the dimensions larger than 0.7 µm in AA2024-T3 alloy belongs to Al 2 CuMg phase (also termed as S-phase), covering around 2.7% of the total alloy 27
28 Chapter 2: Literature Review surface. The rest constituent particles generally contain Al, Cu, Fe and Mn, which are assigned as Al 6 (Cu,Fe,Mn), Al 7 Fe 2 Cu and (Al,Cu) 6 Mn chemical types. They are irregularly shaped with a more positive corrosion potential relative to the alloy matrix and S-phase particles. Still 17% constituent intermetallic particles failed to be assigned as a chemical type, suggesting the complication of the microstructure of AA2024 alloy. The microstructure examination of AA2024-T351 aluminium alloy was also conducted by Guillaumin et al., with the similar results as mentioned above [18]. Constituent intermetallic particles with a uniform distribution were classified into two types, spherical Al 2 CuMg phase particle along with irregularly shaped Al-Cu-Fe-Mn constituent particle based on the EDX analysis. On the contrary, it was revealed that three different types of constituent intermetallic particles, including Al 2 CuMg, Al 2 Cu and (Al,Cu) x (Fe,Mn) y Si, are present in AA2024 alloy as suggested in Gao s work [19]. The crystal structures along with the chemical compositions of the constituent intermetallic particles in AA2024 alloy were obtained using analytical electron microscopic technique. The analysis of the crystallographic structures suggested that Al 2 CuMg phase has orthorhombic structure and Al 2 Cu phase has body-centred tetragonal structure, while (Al,Cu) x (Fe,Mn) y Si phase has a rhombohedral structure. The observation of round-shaped Al 2 Cu phase particles (also termed as θ-phase) [19] with typical dimensions around 1-2 µm displays the difference with Buchheit s study [17], in which no evidence of Al 2 Cu phase was detected. In fact, the existence of Al 2 Cu phase is one of the most significant variations in the microstructure of AA2024 aluminium alloy. Some studies about the constituent intermetallic particles in AA2024 aluminium alloy display only S-phase without any θ- phase, similar to the conclusions of Buchheit s work [18, 20-23]. While in other investigations, relatively high population density of θ-phase particles could be detected as suggested by Gao et al. [14, 19, 24]. The possible explanation for the variation of θ- phase constituent particle in AA2024 aluminium alloy is attributed to incomplete homogenisation of θ-phase during the homogenisation treatment as suggested by Hughes [14]. Another significant debate about the microstructure in AA2024 aluminium alloy is about the classification of Al-Cu-Fe-Mn constituent particles. The chemical composition of Al-Cu-Fe-Mn constituent particles varies significantly, which, 28
29 Chapter 2: Literature Review consequently, results in different crystal structures. As a result, the assignment of Al- Cu-Fe-Mn constituent particles is difficult with various possibilities as expected. As mentioned above, constituent particles containing Al, Cu, Fe and Mn were assigned as Al 6 (Cu,Fe,Mn), Al 7 Fe 2 Cu and (Al,Cu) 6 Mn chemical types in Buchheit s work [17]. In Gao s work, Al-Cu-Fe-Mn constituent particle was identified as a rhombohedra phase with selected area diffraction pattern in TEM. The Al-Cu-Fe-Mn constituent particle is considered to be a modified form of Al 8 Fe 2 Si or Al 10 Mn 3 Si with the chemical composition close to (Al,Cu) x (Fe,Mn) y Si, with x=11 and y=3 in this case [19]. Al-Cu- Fe-Mn constituent particles were classified into two groups based on the Cu/Fe ratio. Al-Cu-Fe-Mn constituent particles with Cu/Fe ratio around 2.5 have lower corrosion resistance than that with Cu/Fe ratios around 0.5 [21]. More comprehensive study about the AA2024 aluminium alloy was conducted with a range of electron characterization techniques on a relatively large alloy surface area, providing the statistics analysis of the constituent particle compositions. The results revealed that nine different composition domains including the matrix and intermetallic compositions exist in the alloy. Among nine compositional domains, several popular ones are responsible for the compositional variation in Al-Cu-Fe-Mn constituent particles, enabling the detailed classification of the particles [14, 24]. Additionally, the existence of multi-phase constituent particles in AA2024 aluminium alloy has been reported in recent work. In Campestrini s study of the influence of quench delay on the microstructure of AA2024 aluminium alloy, a shell-shaped constituent particle was observed after a long quench delay time [15, 16]. The EDX analysis indicated the outer regions of the shell-shaped constituent particles are rich in Al, Cu and Mg whereas the inner region has relatively high content of Al, Cu, Fe and Mn. The formation of the multi-phase particle is attributed to precipitation of Mg and Cu around the irregularly shaped Al-Cu-Fe-Mn constituent particle due to the related dissolution and diffusion processes. Similar to the multi-phase particles reported by Campestrini, the existence of composite particles was also revealed in the studies of Hughes et al. [14, 24]. They reported a minimum of nine separate compositions, with at least one periphery zone around S-phase / θ-phase particles, whose composition is different from both particles and the alloy matrix. 29
30 Chapter 2: Literature Review Dispersoids Al 20 Mn 3 Cu 2 phase dispersoids displaying rod shapes with the typical dimensions around 200 nm has been widely observed in AA2024 aluminium alloy [9]. The distribution of dispersoids is relatively homogeneous in the alloy matrix except around coppercontaining constituent particles. Dispersoid-free zones around the copper-containing constituent particles were observed by Guillaumin et al. [18]. It was revealed that S- phase particle is rich in copper, contributing to copper depleted zone around it. Since Al 20 Mn 3 Cu 2 phase dispersoids have relatively high level of copper, the copper-depleted zone around S-phase particle retarded the formation of dispersoids, resulting in the development of dispersoid free zone around the S-phase particle. In contrast, little evidence of the existence of copper-depleted zone around the S-phase particle was revealed in Buchheit s work [17]. Further investigation is necessary to explain the difference Precipitates The S-phase precipitation behaviour in Al-Cu-Mg alloys has been extensively investigated due to its crucial role as the main strengthening precipitates in Al-Cu-Mg alloys [9, 10, 25, 26]. The distribution of precipitates was explored with TEM in AA2024 aluminium alloy. The results revealed the high population density of fine lath-shaped S-phase precipitates in the matrix of Al-Cu-Mg alloys [18, 20, 27]. Further, it was found that the distribution of S-phase precipitates in AA2024 alloy is sensitive to its thermomechanical history [27]. Therefore, a better understanding the microstructural evolution of S-phase precipitates during ageing is crucial, which could provide direct guidance to achieve higher strength in Al-Cu-Mg alloy and, thereby, to advance the understanding of the microstructure of AA2024 alloy. Two distinct stages of precipitation hardening have been revealed during the ageing process of Al-Cu-Mg alloys [1, 9, 25]. The first stage is associated with the rapid increase of strength after quenching. The second stage is characterized by the rise of strength to peak value, followed by a subsequent decrease with elongated ageing time. Previous studies using hardness measurement, differential scanning calorimetry along with transmission electron microscope observation revealed precipitation behaviour in 30
31 Chapter 2: Literature Review Al-Cu-Mg aluminium alloys. Traditionally, the precipitating mechanism is characterized by four stages: SSS GPB zone S S S (Al 2 CuMg) where SSS stands for supersaturated solid solution. The GPB (Guinier-Preston- Bagaryatsky) zone, S and S precipitates are both intermediate states of S-phase during the ageing of Al-Cu-Mg alloys. During the ageing process, the rapid increase of strength is attributed to the formation of GPB zones and the peak hardness is achieved by the combined effect of GPB zones and the formation of S or S phase [1, 9]. Recent studies, with the application of new generation techniques, including high resolution transmission electron microscopy and atomic probe technique, has achieved the improved understanding of the precipitation phenomenon during the ageing of Al- Cu-Mg alloy [10, 25, 28-33]. Therefore, the modified four-stage mechanism for the precipitation behaviour with a more convincing mechanism is proposed as follows: SSS co-clusters GPB2 zone/s S (Al 2 CuMg) where the co-clusters represents the Cu-Mg co-clusters as the dominant feature at the early stage. Further, it was revealed that two types of S-phase precipitates develop in Al-Cu-Mg alloys, displaying slight different orientation relationships with the alloy matrix. The orientation relationship difference is around 4 between the traditional relationship and new one, which may further modified the mechanism to: SSS co-clusters GPB2 zone/s S (Type 1) S (Type 2) where S (Type 2) has an orientation relationship with the alloy matrix that is rotated by 4 to the classic one [10, 25]. In order to correlate the microstructural evolution, mainly the precipitation process, with the strength of the alloy, the microstructure of different strength stages was examined. In Wang s work, it was revealed that the second stage hardening is dominated by S- phase since at the peak hardness stage, high population density of S-phase precipitates are formed with no significant amount of other phases detected [9, 10, 25]. More detailed work was conducted with atomic probes [28, 30]. It was claimed that first stage rapid increase in hardness is associated with the development of Cu-Mg co-cluster. The Cu and Mg segregation along the grain boundaries is another possible contributor. At 31
32 Chapter 2: Literature Review the peak hardness, the microstructure is dominated by high population density of GPB zones along with residual solute clusters comprised of Cu and Mg, contributing to the peak hardness in Al-Cu-Mg alloy. Meanwhile, coarse S-phase precipitates were detected in Al-Cu-Mg alloys at the stage. Additionally, the overaged Al-Cu-Mg alloys were also investigated, revealing exclusively coarse S-phase precipitates. Therefore, the combination of precipitate coarsening and coalescence is responsible for the deceased hardness with elongated ageing time [28]. It is worth mentioning that there exist some controversies about the exact mechanism of precipitation behaviour in Al-Cu-Mg alloys. Further work is necessary for a better understanding and the clarity of related issues Microstructure of Al-Cu-Li alloys Most related studies regarding the microstructure of Al-Cu-Li alloys focus on the evolution of precipitates due to its evident strengthening effect. Limited attention is given to constituent particles and dispersoids in Al-Cu-Li alloys The history of development of Al-Cu-Li alloys To achieve the demanding request of lower operation cost in the aerospace industry, Al- Cu-Li alloys are developed as the promising substitutes for conventional 2XXX and 7XXX aluminium alloys, providing lower density, improved stiffness along with higher strength [34-40]. With the addition of lithium as the alloying element, four main advantages can be achieved. First, lithium, with the lowest density of all metallic elements, lowers the density of Al-Li alloys. It was suggested that with 1 wt. % lithium addition, the Al-Li alloy achieves 3% decrease in density. Second, the addition of 1 wt. % lithium provides 6% increase in elastic modulus. Third, Li additions also facilitate the formation of hardening precipitates, improving the mechanical properties of Al-Cu-Li alloys and contributing to the higher fatigue crack growth resistance. Last, due to the similar behaviour during the extrusion, forging and other manufacturing processes with the traditional Al-Cu-Mg alloys, the lithium-containing aluminium alloys can be fabricated with existing facilities[34, 37, 38, 40]. The development of lithium-containing aluminium alloys was reported as early as the mid-1920s. The representative of the first generation Al-Li alloy is 2020 alloy, developed by Alcoa and used in the wings of the Navy s RA-5C Vigilante aircraft. The second generation of Al-Li alloys, such as: AA2090 and AA8090 alloys, were developed with the main purpose to capture weight saving by lowering the density in 32
33 Chapter 2: Literature Review the late-1970s. The second generation Al-Li alloys generally contains over 2 wt. % lithium with significant density reduction achieved. However, the shortcomings, such as high anisotropy of tensile properties, low toughness and high corrosion susceptibility, limit the application of the second generation Al-Cu-Li alloys in the aircraft industry. A detailed analysis of the negative performance of the second generation Al-Cu-Li alloys results in the recent development of the third generation Al-Li alloys with relatively low content of lithium, typical lower than 2 wt.%. Nowadays, the 3 rd generation Al-Cu-Li alloys, such as AA2099 aluminium alloy, have been widely used in the aircraft industry for fuselage and wing stringers [34, 35, 40] Constituent intermetallic particles and dispersoids The constituent intermetallic particles and dispersoids in the Al-Cu-Li alloy have been investigated by Ma et al. [41]. It was revealed that the constituent intermetallic particles are comprised of Al, Cu, Fe and Mn with varying contents of copper, based on the statistics results from EDX analysis. The high-copper-containing and low-coppercontaining constituent intermetallic particles could be together in the form of multiphase particles. It was also claimed that the formation of multi-phase particles was attributed to the copper diffusion between high-copper-containing particles and the alloy matrix at its adjacent. The complete diffusion of copper resulted in the development of low-copper-containing particles. If the copper diffusion was totally retarded, the highcopper-containing particle could exist individually on the alloy surface. In addition, the Al-Cu-Fe-Mn and Al-Cu-Fe intermetallic particles were also reported after the homogenization of Al-Cu-Li alloys with little evidence of the existence of multi-phase particle [42, 43]. As reported, dispersoids are distributed homogenously within the alloy matrix in Al-Cu- Li alloy. Dispersoids could be classified into two types, based on the shapes, rectangle and sphere, respectively. Further analysis suggested the spherical dispersoids are β phase (Al 3 Zr) dispersoids and the rectangular dispersoids are rich in aluminium, copper, manganese as well as lithium, therefore, termed as Al-Cu-Mn-Li dispersoids [41] Precipitates T 1 phase (Al 2 CuMg) precipitates have a crucial role in the development of high strength Al-Cu-Li alloys, acting as the main strengthening precipitates in 3 rd generation Al-Cu- Li alloys. Meanwhile, the active electrochemical property of T 1 phase determines its 33
34 Chapter 2: Literature Review influence on the corrosion behaviour of Al-Cu-Li alloys. Therefore, literature review in the section will focus on the evolution of T 1 phase precipitates. The distribution of T 1 phase precipitates is sensitive to thermomechanical history of the Al-Cu-Li alloys. The synergistic effect of pre-ageing plastic deformation and ageing conditions determines the development of T 1 phase precipitates in Al-Cu-Li alloys. The influence of plastic deformation prior to ageing on the T 1 phase precipitation has been widely investigated [44-46]. In Cassada s work, it was revealed that the T 1 phase precipitates preferentially nucleate along the dislocations and low angle grain boundaries [44, 45, 47]. The plastic deformation introduces high population density of dislocations, leading to the significant enhancement for the formation of T 1 phase precipitates during the ageing at 190 C. Also, the plastic deformation prior to artificial ageing significantly affects the dimensions of T 1 phase precipitates, with decreasing lengths and thicknesses of T 1 phase plate after the plastic deformation. Further, the influence of plastic deformation on the precipitation process in Al-Cu-Li alloy was investigated by Gable et al. [46, 48]. The evolution of T 1 and θ phase precipitates in Al-Cu-Li alloys was quantitatively analysed after different levels of induced plastic deformation prior to the artificial ageing process. It was suggested the change of number density, size and volume fraction of the precipitates in the alloy along with the level of pre-ageing plastic deformation, revealing the significantly increased population density of fine T 1 phase precipitates in the alloy matrix after increased level of plastic deformation prior to the artificial ageing. In addition, the enhanced T 1 precipitation kinetics was revealed after the pre-ageing plastic deformation. After high level of preageing plastic deformation, less ageing time of the alloy is necessary to achieve the same yield strength with respect to that with low level of plastic deformation. Specifically to 2A97 Al-Cu-Li alloys, it was claimed that the precipitation of uniformlydistributed fine T 1 phase in the alloy matrix was promoted after 4.7% plastic deformation prior to artificially ageing at 135 C for 48 hours. Additionally, the high strength of the 2A97 Al-Cu-Li alloy was achieved with pre-ageing plastic deformation due to the higher population density of T 1 phase precipitates in the alloy matrix [49]. The effect of ageing treatments on the precipitation in Al-Cu-Li alloys has been studied by various researchers [50-52]. It was suggested that with different ageing temperatures applied to 2198 Al-Cu-Li alloys, various configurations and morphologies of 34
35 Chapter 2: Literature Review precipitates are displayed. When the ageing temperature is lower than 160 C, the main strengthening precipitates are θ and δ phase with sparse T 1 phase detected while the ageing temperature exceeds 160 C, T 1 phase precipitate is dominant in amount, acting as the main strengthening precipitates in the Al-Cu-Li alloy. Fracture displays the feature of intergranular, due to the soft precipitate free zone along the grain boundaries [50]. In Jiang s study, it was found that the size of grain boundary T 1 phase precipitates and the width of precipitate free zone along the grain boundary increases with prolonged ageing time and increased ageing temperature [52]. The influence of ageing time on the microstructural evolution of T 1 phase was further studied by Li et al [51]. With the increasing ageing time at a constant ageing temperature 165 C, the volume fraction of T 1 phase increases, resulting in the additional strength in the alloy. However, a prolonged ageing time also results in the over-ageing phenomenon with the decrease of alloy strength due to the coarsening of T 1 phase precipitates. Besides, microstructural evolution of T 1 phase precipitates during the ageing of Al-Cu-Li alloy was also investigated with atom probe tomography to reveals the nucleation mechanism of T 1 phase [53-55]. Early ageing condition T 1 phase plates were observed to attach to the dislocations and subgrain boundaries associated with Mg and Cu co-segregation. At all ageing time, Mg and Ag segregate along the matrix- T 1 plates interface. The similar kinetics of Cu, Ag, and Mg with Li in solid solution resulted in the co-precipitated T 1 phase in the alloy after ageing [53]. The investigation on the microstructural evolution of Al-Li alloy under hot rolling, cold rolling and ageing was conducted to determine the microstructure of 2195 Al-Cu-Li alloy during the commercial production procedures. It was revealed that limited population density of T 1 phase precipitates were detected in hot -rolled plate with elongated grains containing fine, polygonised subgrains. On the contrary, the cold-rolled sheet displays pan-cake shaped grains with the high density dislocation cells. In the aged product, it was found that high population density of T 1 phase precipitates uniformly distribute in the alloy matrix along the direction parallel with {111} planes, which significantly strengthens the alloy [56]. In addition to the thermomechanical process, the compositions of Al-Cu-Li alloys also affect the development of T 1 phase precipitates [57-60]. AA2198 and AA2196 Al-Cu-Li alloys were employed to explore the influence of Cu/Li ratio on the microstructural evolution, revealing the small modification of the alloy composition could result in significant difference of the precipitation process during natural ageing. However, the 35
36 Chapter 2: Literature Review impact is limited to the ageing kinetics aspect when the alloys are submitted to artificial ageing, since T 1 phase precipitates with similar dimensions were developed in both alloys after the ageing process [60]. In summary, the microstructural evolution of T 1 phase precipitates in the Al-Cu-Li alloy is highly sensitive to the thermomechanical process and the alloy composition. Apart from T 1 phase precipitates as the dominant precipitates in Al-Cu-Li alloys with the lithium contents lower than 2 wt. %, the precipitation of S phase, θ phase and δ phase has been reported during the ageing process [53, 61-64]. 2.3 Corrosion behaviour of aluminium alloys Due to the development of a passive alumina film on the surface, pure aluminium displays extremely high corrosion resistance. However, with the addition of alloying elements, the corrosion resistance is generally compromised due to increased flaws in the passive film along with the increased electrochemical heterogeneity. The literature review regarding the localized corrosion of aluminium alloys mainly summarize the corrosion behaviour of Al-Cu-Mg/Li alloys Corrosion behaviour of Al-Cu-Mg alloys The corrosion behaviour of Al-Cu-Mg alloys, especially AA2024 aluminium alloy, has been extensively studied since the high content of copper compromises the corrosion resistance of AA2024 alloy [65-69]. Pitting corrosion related with constituent intermetallic particles and stable localized corrosion involving selective attack of grain boundary and grain interior are discussed in the following sections, respectively Corrosion behaviour of constituent intermetallic particles It is generally accepted that pitting corrosion of Al-Cu-Mg alloys is closely associated with the existence of second phase particles on the alloy surface due to the preferential flaws of the alumina film along with electrochemical coupling with the alloy matrix in the periphery [21, 23, 70]. Recent work has revealed that the initiation of stable localized corrosion is attributed to the cluster of the second phase particles in Al-Cu-Mg alloys [71-73]. 36
37 Chapter 2: Literature Review S-phase particles S-phase particle (Al 2 CuMg), as an important intermetallic phase in Al-Cu-Mg alloys, is widely existed in AA2024 aluminium alloy. The selective attack of S-phase particles on the alloy surface could result in the initiation of pitting corrosion in AA2024-T351 aluminium alloy in aggressive environment [74-77]. Therefore, the corrosion behaviour of S-phase particle receives extensive attention. Previous work focussed on electrochemical behaviour of S-phase particle. Synthesized bulk S-phase was applied to obtain its electrochemical properties, revealing its active nature with a more negative corrosion potential with respect to that of the adjacent alloy matrix [74, 78-80]. Besides, it was revealed that at the early stage, selective dissolution of Mg and possibly Al occurs in S-phase particles, leaving copper-rich remnants with typical porous morphology developed after the selective dissolution, which, consequently, leads to the trenching in the periphery due to the positive corrosion potential with respect to that of the alloy matrix [17, 78, 81]. Recent work has been carried out to reveal the selective dissolution process of S-phase particles in details. The galvanic coupling between the synthesized S-phase and aluminium wire was used to simulate the micro-coupling between the S-phase particle and the alloy matrix in AA2024 alloy. Scanning vibrating electrode technique and scanning ion-selective electrode technique were employed to measure the current density along with the concentrations of chloride and proton, respectively. It was found that both anodic and cathodic activities with high current density are present on the surface of S-phase particle, indicating that selective dissolution occurs on S-phase particles with different areas acting as cathode and anode. Additionally, it was also noticed that the aluminium around the S-phase particle displays relatively low current density, indicating the limited influence of the alloy matrix on the selective dissolution behaviour of S-phase particles in AA2024 alloy [82]. Besides, local alkaline around the dealloying S-phase was detected, which is considered to be responsible for the attack to its adjacent matrix since the alumina film is unstable in such aggressive environment [83, 84]. In Wang s study, the selective dissolution of S-phase particle is attributed to the decomposition of Al 20 Cu 2 Mn 3 approximants [85]. Large numbers of Al 20 Cu 2 Mn 3 inclusions were detected to be embedded in S-phase particles. However, the distribution 37
38 Chapter 2: Literature Review of Al 20 Cu 2 Mn 3 approximants is not uniform with increased population density in selective S-phase particles, leading to the dispersion in the kinetics of corrosion behaviour of S-phase. During the immersion testing, the preferential dissolution of Al 20 Cu 2 Mn 3 approximants resulted in the selective dissolution of Al and Mg at certain locations of the S-phase particle, probably due to the localized acid chemical condition from the dissolution of the inclusions. Besides, the Al 20 Cu 2 Mn 3 approximants located near the interface between the S-phase and the alloy matrix leads to the development of trenching, which is consistent with the previous work [21, 77, 86]. As reported in the study of King et al., the banding structure along preferred orientation was observed in the de-alloyed S-phase particle of AA2024 alloy [87]. Scrutiny of the banding structure revealed its copper rich nature along with spongy morphology as the consequence of selective dissolution. Therefore, selective dissolution preferentially occurred along certain orientation, resulting in the formation of the banding structure in the S-phase particle along with the subsequent development of metallic copper particle and the possible oxidization of copper. The copper-rich porous banding structure developed in the direction parallel with the {111} oriented planes of metallic copper particle. Additionally, crystallographic defects in the S-phase particle were observed, indicating the influence of plastic deformation on the selective dissolution behaviour of S-phase particles in AA2024 alloy. Three aspects of corrosion activities associated with S-phase particles are discussed as follows. Firstly, the selective dissolution process generally results in the formation of a nanoporous sponge rich in noble alloying elements. To S-phase particles, the copper-rich spongy structure has been widely observed in various testing conditions [74, 81, 88]. The examination of critical potential of dealloying contributes to better understanding of dealloying process, especially the formation of spongy structure during the dealloying process [88-90]. Generally, the critical dealloying potential, as the function of alloy composition, represents the onset of the dealloying of the bulk alloy [89, 90]. The preferential dissolution of less noble alloying element results in the regions of negative curvature on the surface with increasing interfacial area. To maintain the stability of the structure, roughening transition, due to the competition between the curvature effect and the diffusion process at the critical potential, decreases the surface energy of the system, lead to the formation of the final stable surface morphology, namely, spongy structure 38
39 Chapter 2: Literature Review in S-phase particle [91]. Recent study has revealed that the critical potential represents the onset of kinetic phase transition. The surface morphology was studied with scanning tunnelling microscopy at the potential below critical potential. It was found that the surface morphology evolution is associated with the current decay, indicating the influence of activation-controlled dissolution as well as surface mass-transport diffusion on the spongy structure development [90]. In Dimitrov s study, the surface morphology of de-alloying S-phase particles was observed below and above the critical potential [88]. It was revealed that the balance between metal dissolution, ion solubility and mass transport determines the kinetics of dealloying process, whereas curvature effect affects the ligament size characterizing the spongy porous structure. Additionally, a continuum mode has been proposed by Erlebacher et al., revealing the intrinsic dynamical pattern formation process is responsible for the nano-porosity after dealloying. The successful prediction of ligament length confirms the theory [92, 93]. The spongy structure formation mechanism of dealloying of S-phase particle based on experimental truth was also investigated. Recent study by Hashimoto revealed that a copper-rich nano-porous residual layer with relatively high content of Al and Mg was generated at the initial stage of the S-phase particle dealloying. The porosity of the residual layer allows the contact between the intact S-phase and the aggressive electrolyte, facilitating the subsequent dealloying of Al and Mg, which results in the increased free volume associated with structure rearrangement. As a result, a stable porous structure was generated [81]. Second, due to the selective dissolution of Al and Mg, the S-phase remnant is further rich in copper, which, finally, results in the copper re-distribution on the alloy surface. In King s work, the distribution of copper with different oxidation state was observed, with copper metallic particle buried deeply in sub-surface areas and copper oxidation (+1) near the alloy surface [87]. The diffraction pattern of the S-phase particle remnant suggests the existence of copper and copper oxidation (+1). The Cu 2 O cluster was also detected within the corrosion product [81]. In Lacroix s work, it was found that copper particles exist around the corroded intermetallic particles [76, 77]. Scanning Kelvin probe force microscopy (SKPFM) was carried out on a de-alloying S-phase particle, displaying a relatively wide potential extent about 2.5 times of the diameter of the asreceived S-phase particle, which suggests the copper re-distribution around the S-phase 39
40 Chapter 2: Literature Review particle. Additionally, it was also suggested that the copper nano-particles contribute to the increased passivity of the alloy matrix around the S-phase remnant. The exact mechanism of copper re-distribution has been extensively studied with several mechanisms proposed [67, 94, 95]. In Obispo s work of AA2024 alloy, the copper re-distribution is attributed to plating of copper in an electrochemical displacement reaction as proposed by the author [94]. The lift-off samples of alloy surface with copper deposition were examined by TEM, revealing various morphologies of the copper deposition. The distribution of copper deposition on the alloy surface reveals the copper deposition is not only on the cathodic intermetallic particle, but also at random sites on the aluminium alloy surface, which is consistent with other studies [23, 77]. The release of copper ions in the solution was further confirmed with the measurement of copper concentration in the NaCl solution before and after the immersion testing. The tripled copper concentration after 5 days immersion indicates the production of Cu ions, which promotes the electrochemical deposition on the alloy surface. It was also revealed that the copper deposition on iron-containing intermetallic particle is supported by the reaction between copper ions and iron [23]. As a result, the iron-containing precipitate becomes a better electropositive substrate, which further supports the mechanism of electrochemical reaction as the major method for the copper re-distribution in AA2024 alloy. The copper re-distribution mechanism involving non-faradaic liberation and transportation of copper from the alloy surface is also proposed [17, 67]. The dealloying of S-phase particles results in copper clusters detached from the S-phase particles, which were captured by hydrous corrosion product gel. The non-faradaic liberation of the copper cluster through mechanical dispersion and deposition on the alloy surface contributes to the copper-redistribution. Meanwhile, the metallic copper could be oxidized, leading to the generation of copper ions. As a result, the copper ion then plates back on the alloy surface [96]. The influence of non-faradaic process during the copper redistribution was further confirmed by comparing the amount of copper deposition obtained after the immersion in stagnant and stirred solutions [95]. It was revealed that within the stirred solution involving convection to promote the non-faradaic liberation, copper redistribution on the surface increased by the factor about 1.8. The electrical isolation of copper metallic cluster is necessary since the potential of the alloy is more negative than that for copper oxidation. Even though curvature effect and formation of 40
41 Chapter 2: Literature Review soluble metal complexes could cause a negative shift in E Cu, a large enough active shift simply failed to be generated, indicating the crucial role of non-faradaic detachment in the copper re-distribution [67, 87]. Finally, trenching around the S-phase remnant has been widely observed on the alloy surface [17, 21, 77]. The formation mechanism of trenching in the periphery of S-phase remnant is summarized. Generally, the trenching is attributed to the micro-coupling between the S-phase remnant and the alloy matrix in the periphery. Copper and copper-containing phases generally have a more positive corrosion potential with respect to that of the alloy matrix in the AA2024 alloy [1, 79]. Therefore, the corrosion potential of the copper-rich S-phase remnant tends to be more positive than that of the alloy matrix, resulting in the selective dissolution of the alloy matrix in the periphery of S-phase remnant. As a result, the trenching is developed around the particle. Besides, the localized alkalization due to the cathodic activity at the copper-rich S-phase remnant is considered to be the initiation of trenching formation since the alumina film is unstable when the ph reaches higher than 9 [82].It was found that the localized alkalization is responsible for the dissolution of corrosion product formed at the earlier stage, indicating the alkaline chemical condition in the regions containing dealloying S- phase particles [21]. The electrochemical modification of S-phase during the immersion in aggressive environment was also confirmed with the synthesized Al 2 CuMg alloy [17, 74, 77-79]. Recent studies propose several new ideas about the trenching development around the S-phase particles. In Wang s work, it was suggested that the initiation of the trenching behaviour around the S-phase particle is related with the existence of Al 20 Cu 2 Mn 3 inclusions near the interface between the alloy matrix and the S-phase particle. After the initiation, the micro-coupling between the S-phase remnant, which has a more positive potential, and the alloy matrix in the periphery is responsible for the propagation of the trenching around the intermetallic particle [85] θ/α-phase particles Compared to the extensive studies of the corrosion activities associated with S-phase particles, both θ and α-phase particles in AA2024 alloy received less attention. Limited 41
42 Chapter 2: Literature Review investigation focussed on θ and α-phase particles is attributed to two major reasons. First, the relatively inert nature of both intermetallic particles relative to the S-phase particle limits their influence on the corrosion behaviour of AA2024 aluminium alloy. Second, the limited existence of θ-phase particles and the complicated structure and composition of α-phase particles make the further investigation difficult [14, 17, 21]. However, with more attention of cathodic intermetallic particles in aluminium alloys, more work has been conducted about the corrosion behaviour of these cathodic intermetallic particles in AA2024 aluminium alloy. Electrochemical measurement was conducted on synthesised θ-phase bulk, indicating its positive corrosion potential with respect to that of the alloy matrix. Trenching, as the typical corrosion morphology around the cathodic intermetallic particles in AA2024 aluminium alloy, is evident around the θ-phase particle after the immersion testing [79]. Due to the composition of α-phase particles, the α-phase particle is also termed as Al- Cu-Fe-Mn intermetallic particle. Al-Cu-Fe-Mn particles are generally considered to be cathodic with respect to the alloy matrix due to the relatively high contents of copper and iron [21, 79]. Besides, copper deposition preferentially occurs on α-phase particles, as mentioned above, due to the increased content of iron [23, 94]. As revealed in Boag s work [21], the Al-Cu-Fe-Mn intermetallic particle is classified based on the Cu/Fe ratio and Si content. It was suggested that the corrosion susceptibilities of the particles is closely associated with the compositions of Al-Cu-Fe- Mn intermetallic particles. During the immersion testing, the development of trenching was evident in the periphery of the Al-Cu-Fe-Mn with Cu/Fe around 2.5. On the contrary, the Al-Cu-Fe-Mn intermetallic particle with lower Cu/Fe ratio, typically around 0.5, tends to be more inert, since the trenching occurred much later. The corrosion behaviour of Al-Cu-Fe-Mn intermetallic particle was also studied in AA2219 aluminium alloy with the application of AES (Auger electron spectroscopy), SAM (scanning Auger microscopy) and EDX. The results suggested the cathodic nature of Al-Cu-Fe-Mn intermetallic particles with respect to that of the alloy matrix, resulting in the development of trenching and the subsequent pitting corrosion. It was also revealed that iron first dissolved with iron oxide/ hydroxide observed and then deposited back on the surface, indicating the selective dissolution occurred to Al-Cu-Fe- Mn intermetallic particles. Further, copper and manganese displayed little activity 42
43 Chapter 2: Literature Review during the immersion testing. Corrosion product progressively accumulated around the particle and after 32 hours, the intermetallic particle was completely covered [97] Stable localized corrosion behaviour It has been widely reported that the initiation of stable localized corrosion is closely associated with the second phase particles on the alloy surface, due to flaws of alumina film along with the micro-coupling between the alloy matrix and the intermetallic particles [75, 98, 99]. However, individual intermetallic particles can t lead to stable localized corrosion due to the limited reaction volume and the relatively low frequency [21]. Therefore, the initiation of stable localized corrosion in AA2024 aluminium alloy preferentially occurred in the region containing a group of intermetallic particles. Within the intermetallic particle cluster on the alloy surface, the electrochemical difference from the microstructural heterogeneity along with the crystallographic defects in the corresponding alumina film on the alloy surface facilitates the initiation of the stable localized corrosion, providing a sufficiently larger reaction volume beneath the alloy surface and a high frequency of current transients [72, 100] The initiation of stable localized corrosion In previous work, in-situ monitoring of the surface of AA2024 aluminium alloy during the immersion testing revealed the crucial role of intermetallic particles in the initiation and propagation of localized corrosion. It was revealed that the distribution of intermetallic particles on the alloy surface determines the location and the severity of pitting corrosion. The author suggested that the severe pits result from the coalescence of corrosion pits associated with individual intermetallic particles. Therefore, the severe localized corrosion originating from the pits coalescence requires large numbers of individual intermetallic particles within a certain region, indicating the crucial role of intermetallic particle clusters in the development of the severe localized corrosion in AA2024 alloy [23, 70, 84, 101]. Recent studies have introduced more advanced characterization techniques to explore the initiation of the stable localized corrosion in AA2024 alloy. Cross sections of the stable localized corrosion sites were obtained with ultramicrotomy, revealing that at the stable localized corrosion site, a large group of intermetallic particles buried beneath the alloy surface [71, 102, 103]. To complement the inadequate information from 2D characterization technique, 3D characterization 43
44 Chapter 2: Literature Review technique was employed to investigate the typical stable localized corrosion site in AA2024 alloy. The high resolution three-dimension volumetric reconstructions provide the direct evidence regarding the initiation of stable localized corrosion, revealing that corrosion propagation initiates at the cluster of intermetallic particles intersecting the alloy surface [71, 104]. To correlate the intermetallic particle cluster with the development of stable localized corrosion on the surface of AA2024 alloy, pair correlation functions were employed to analyse the distribution of intermetallic particles in PIXE map before and after the immersion testing [72, 100]. It was found that the stable localized corrosion is likely to initiate in the region with higher population density of intermetallic particle around, suggesting the preferential initiation of stable localized corrosion at the intermetallic particle clusters in AA2024 alloy, which is consistent with previous conclusions [71, 102]. Additionally, it was also suggested that higher population density of intermetallic particles is necessary for the development of stable localized corrosion at the early stage while relatively lower number of intermetallic particles is required for the initiation of the stable localized corrosion. The tendency is associated with the cathodic electrochemical property of the S-phase remnants and the preferential copper deposition on Al-Cu-Fe-Mn intermetallic particles. Copper-rich S-phase remnant and copper deposition could provide high cathodic current to support the stable localized corrosion development, indicating the dominant role of cathodic particles in the initiation of stable localized corrosion [72, 80]. Furthermore, electrochemical measurement of intermetallic particles was conducted to establish the relationship between the initiation of stable localized corrosion and the intermetallic particles in AA2024 aluminium alloy [80]. The results suggested the intermetallic particles with net cathodic reaction at the OCP of AA2024 alloy is two to three orders lower than that with a net anodic reaction, indicating that the cathodic reaction is the rate limiting reaction, which is in good agreement with previous literature [84]. Therefore, the cluster containing intermetallic particles with opposite electrochemical properties is closely linked to the initiation of the stable localized corrosion in AA2024 alloy. Besides the presence of intermetallic particle cluster at the stable localized corrosion site, it has also been revealed in related literatures that the geometry of stable localized 44
45 Chapter 2: Literature Review corrosion site is crucial to maintain the chemical condition at the active corrosion front area, otherwise, the active corrosion front may re-passivate [71, 73, ]. In Galvele s work, it was suggested that 10 nm as a benchmark for the depth of the pit required to reach a ph for propagation [105]. Further, a stable pit could be created if the product of the current density and the pit depth was higher than 10-2 A/cm, indicating that the sufficiently long diffusion path is necessary for the stabilisation of the chemical condition at the corrosion front. In more recent work, the geometrical structure of the typical stable localized corrosion site was also examined with scanning electron microscopy (SEM), indicating two features of all stable localized corrosion sites, i.e. a large reaction volume beneath the alloy surface along with a small area of connection on the alloy surface. The special geometry contributes to the restricted diffusion between the bulk solution and the local electrolyte at the stable localized corrosion front area, which is acidified due to the rapid hydrolysis of aluminium ions and chloride enriched. The electrolyte in the corrosion front area provides the necessary chemical condition to support the further development of the stable localized corrosion when it propagates away from the intermetallic particle cluster and its influence area [71] Intergranular corrosion Intergranular corrosion, as one of the dominant corrosion type in high strength aluminium alloys, could be the initial sites for cracking initiation, leading to detrimental results. High strength Al-Cu-Mg alloy, with AA2024 alloy as the representative, is widely used in many aspects of transportation industry due to its high strength-toweight ratio and low manufacturing cost [11-13]. However, the high strength aluminium alloy is not immune to intergranular corrosion, especially in the chloride-containing environment [65, 66, 84, 108, 109]. Therefore, extensive attention has been paid to advance the understanding of the intergranular corrosion mechanism in high strength Al-Cu-Mg alloys. A. Compositional difference Most work revealed the compositional difference in the grain boundary area, resulting in the electrochemical heterogeneity, contributes to the high intergranular corrosion susceptibility in the high strength Al-Cu-Mg alloys. Therefore, the intergranular corrosion developed in high strength aluminium alloys is generally attributed to the preferential dissolution of more anodic part in the grain boundary area [18, 27, 66, 109, 110]. 45
46 Chapter 2: Literature Review The anodic region within the grain boundary area mainly contains three parts, i.e. the precipitate free zone (PFZ) with the depletion of noble alloying elements, anodic grain boundary precipitates along with the grain boundary segregates rich in active alloying elements. Thermomechanical treatments, including ageing and quenching, result in the preferential precipitation in the grain boundary. Therefore, certain alloying element is depleted within the area immediately adjacent to the grain boundary, leading to the formation of precipitation free zone along the grain boundary. In the early work of intergranular corrosion in copper-containing aluminium alloys, the development of grain boundary attack was attributed to the anodic dissolution of copper depleted zone in copper-containing aluminium alloys [20, 109, 111]. In Galvele s work about the intergranular corrosion mechanism of Al-Cu alloys, it was revealed that the lower breakdown potential of precipitate free zone along the grain boundaries is responsible for the high intergranular corrosion susceptibility in aged Al-Cu alloy[109]. The copper-rich precipitation formation is more rapid in the grain boundary area during the artificial ageing, resulting in the negative shift of breakdown potential of grain boundary area. As a result, the aged Al-Cu alloy is more susceptible to intergranular corrosion [111]. It also points out the increased anodic area in over-aged Al-Cu alloys favours the generalized corrosion, leading to the selective attack of both grain boundary and grain interior, even though precipitates free zone is only present along the grain boundary. More recently, in Kumai s work about Al-Cu-Li alloys, it was revealed that the precipitate free zone along the grain/subgrain boundary network can be developed under certain thermomechanical condition due to the depletion of copper along the grain/subgrain boundary area [ ].. The subgrain and grain boundaries attack is attributed to the pitting corrosion of the precipitate free zone. On the contrary, with the absence of precipitate free zone in the alloy, intergranular corrosion is not present in the alloy even though both alloys with/ without IGC features have the similar precipitates distribution The influence of precipitate free zone on intergranular corrosion susceptibility was also reported in AA7150 aluminium alloy. It was revealed that the AA7150-T6 aluminium alloy displays higher intergranular corrosion susceptibility than that of alloy in T7 condition, which is attributed to the dissolution kinetics of precipitate 46
47 Chapter 2: Literature Review free zone along the grain boundary area. TEM analysis suggested that the composition of the precipitate free zone in both alloys is similar. However, during the immersion testing, the dissolution of grain boundary precipitates resulted in various copper ion concentration within the grain boundary area. In T7 alloy, high copper ions content of the grain boundary area from alloy retards the further dissolution of precipitates free zone, lowering the intergranular corrosion susceptibility [115]. Additionally, it was revealed in the work of Svenningsen et al. that the intergranular corrosion susceptibility in extruded Al-Mg-Si alloy is closely associated with the composition of the grain boundary area [116, 117]. Selective grain boundary is decorated with continuous nano-scale copper film. And the micro-coupling between the cathodic continuous copper film and the precipitate free zone promotes the preferential dissolution of the precipitate free zone, resulting in the development of intergranular corrosion in the Al-Mg-Si alloy. The precipitates along the grain boundary network have been widely observed, exhibiting a range of configurations and population densities in high strength aluminium alloys. The grain boundary precipitate could be preferentially attacked when it is anodic with respect to the alloy matrix and the precipitate free zone (if exists). The selective dissolution of anodic grain boundary precipitates is evident in different alloy systems, indicating its crucial role in the development of intergranular attack, especially when the precipitation free zone is absent. In Zhang s work, no precipitate free zone was observed in AA2024-T3 alloy, which is highly susceptible to intergranular corrosion, while AA2024-T8 alloy, with precipitate free zone present along the grain boundary, suffered mainly from the attack of grain interior during the immersion testing [27]. It was believed that the selective dissolution of S-phase precipitates along the grain boundary in AA2024-T3 alloy results in the development of intergranular corrosion due to the more negative potential of S-phase than that of the alloy matrix. The corrosion morphological modification clearly fails to fit the precipitate free zone model, indicating the significant role of grain boundary precipitates in the intergranular corrosion development [27, 118, 119]. Moreover, in Guillaumin s work [18], TEM examination revealed that both small hardening Al 2 CuMg precipitates and needle-shaped Al 2 CuMg particles with the dimensions around 100 nm are evident along the grain boundary in AA2024-T351 aluminium alloy 47
48 Chapter 2: Literature Review with the absence of precipitation free zone. Intergranular corrosion in AA2024-T351 alloy is associated with the dissolution of S-phase precipitates along the grain boundary. The combined effect of the distribution of S-phase precipitates along the grain boundary and the relatively lower copper content of the grain boundary area results in relatively anodic nature of grain boundary area, leading to high intergranular corrosion susceptibility in AA2024-T351 aluminium alloy. Additionally, the influence of grain boundary precipitates on intergranular corrosion was discussed in Al-Cu-Li alloys. In Buchheit s work regarding AA2090 Al-Cu-Li alloy, it was revealed that the selective dissolution of grain boundary T 1 phase precipitates resulted in discrete grain boundary pits [120, 121]. The occluded cells provided necessary chemical condition for the further attack developed along the grain boundary network, leading to the continuous development of intergranular corrosion. The corrosion morphology is closely linked with the distribution of T 1 phase in Al-Cu- Li alloys. With artificial ageing leading to the increased population density of T 1 phase precipitates in the alloy matrix, the corrosion morphology changes dramatically from intergranular corrosion to intragranular corrosion [52, 122, 123]. And exfoliation corrosion is considered as the subsequent corrosion behaviour after severe intergranular corrosion, with its susceptibility determined by the size and population density of grain boundary T 1 phase precipitates [124]. Similarly, the intergranular corrosion mechanism in AA7XXX aluminium alloy is associated with the anodic MgZn 2 phase precipitation along the grain boundary. The formation of anodic precipitates in the grain boundary area results in the negative shift of electrochemical potential, making it more active and preferentially attacked [ ]. Besides the precipitate free zone along with grain boundary precipitates, segregation along the grain boundary also results in the compositional difference, hence electrochemical difference, which leads to the preferential attack along selective grain boundary in the alloy. It was found in the study of AA7075 aluminium alloy that the grain boundary segregation of Mg and Zn contributes to the high intergranular corrosion in AA7075-T6 aluminium alloy. Due to the special atomic arrangement of the grain boundary, the alloying elements like magnesium and zinc were segregated along the grain boundary, resulting in the preferential dissolution of the grain boundary. As a result, AA7075-T6 alloy display relatively high intergranular corrosion susceptibility 48
49 Chapter 2: Literature Review [128]. The influence of the grain boundary segregation on the intergranular corrosion susceptibility is unclear and further investigation is necessary. B. Structural difference More recent work has revealed that the selective attack of the grain boundary could occur when the compositional difference is absent within the grain boundary area. In AA2024-T351 alloy, it was revealed that only 15% grain boundaries are decorated with second phase precipitates (Al 2 Cu phase) with no evident segregation or precipitate free zone detected along the grain boundary network. However, intergranular attack occurred in more the half of the grain boundaries, indicating the significant role of structural factors in the intergranular corrosion development [102]. The influence of grain boundary misorientation on the selective attack of grain boundaries was investigated. The study about the extruded AA6061 aluminium alloy revealed that grain boundary with high grain boundary misorientation was more susceptible to localized corrosion. It was found that the area with high content of highangle grain boundaries along with evident precipitate free zone is more susceptible to intergranular corrosion. It was also revealed that the formation of precipitate free zone preferentially developed along the grain boundary with high misorientation, further confirming the influence of grain boundary misorientation on the intergranular corrosion susceptibility in AA6061 alloy [129]. Related investigation about the influence of grain boundary misorientation on intergranular corrosion behaviour in AA2024 aluminium alloy was also conducted. The statistics results indicated that attack preferentially occurs on the grain boundary with higher misorientation. It was also believed that the intergranular corrosion susceptibility of high angle grain boundaries is sensitive to the chloride concentration in the corrosive environment [130]. However, more recent investigation on the intergranular corrosion of AA2024-T351 aluminium alloy indicated the distribution of grain boundary misorientation of the as-received alloy and that of the attacked grain boundaries after the immersion testing are similar, suggesting the limited influence of grain boundary misorientation on the intergranular corrosion susceptibility in AA2024 alloy [102, 103].Therefore, the influence of grain boundary misorientation on the intergranular corrosion susceptibility is under debate, requiring further work to elucidate the impact. 49
50 Chapter 2: Literature Review The effect of grain boundary character on intergranular corrosion susceptibility was examined based on coincident site lattice (CSL) model. Apart from the extensive research on stainless steel, showing the high corrosion resistance of coherent twin grain boundaries [131, 132], the model was also employed to investigate the intergranular corrosion susceptibility in high strength aluminium alloys. It was revealed the low intergranular corrosion susceptibility of sigma-3 or sigma-7 grain boundaries in AA2124 aluminium alloy [133]. Similar conclusion about high stress corrosion and intergranular corrosion resistance of sigma-7 CSL grain boundary was also observed in AA2024 aluminium alloy [134]. More recent work on 2000 series aluminium alloys revealed the relationship between selective grain boundary attack and the distribution of grain-stored energy, which represents the population density of dislocations in individual grains. The results exhibited that the attacked grain boundaries tend to locate around the grain with high level of stored energy, correlating the high intergranular corrosion susceptibility to grain boundary around the grain with high stored energy. Further, the intergranular attack was not confined with the region immediately adjacent to grain boundary but preferentially developed into grain with high level stored energy [102, 103]. Meanwhile, the grain with high level of stored energy displays high corrosion susceptibility of grain interior attack in AA2099-T8 aluminium alloy. It was believed that the relationship between stored energy and corrosion susceptibility is attributed to the thermodynamics stability [135] Crystallographic corrosion Crystallographic corrosion indicates the corrosion preferentially develops in the highly ordered direction to obtain crystallographic pits bounded by pit walls along the directions parallel with crystallographic planes [136, 137]. Crystallographic corrosion is widely existed in high purity aluminium, which is also evident in selective aluminium alloys. A. Crystallographic corrosion in pure aluminium Crystallographic corrosion displays evident grain orientation dependence in pure aluminium [ ]. The literature review summarizes the grain orientation dependent phenomenon during the crystallographic dissolution in aluminium. 50
51 Chapter 2: Literature Review It is generally accepted that the initiation of pitting corrosion is associated with the breakdown of the oxide film on the aluminium surface [84, 105, 143, 144]. Therefore, the crystallographic pit nucleation is closely related to the alumina film on the surface, which affects the grain-orientation pitting behaviour. Due to the amorphous nature of the alumina film with no evident orientation dependent features, the influence of oxide film on orientation dependent pitting behaviour is attributed to the inherent stability of alumina film, namely, the flaws in the amorphous oxide film, which is in agreement with the conclusion from previous work, which indicated that flaws in the alumina film act as the pit nucleation sites [141]. It was found that the high population density of flaws results from higher degrees of atomic order from the underlying substrate. To maintain the atomic order at the interface, elastic strain was introduced, leading to the pre-existing flaws in the alumina film. Therefore, the flaw density on the crystal planes should follow the increasing order: {001} < {011} < {111}, which is consistent with that of the pit density on the crystal planes [138, 141, 145]. More detailed analysis was conducted to evaluate the stress state along with its following strain energy. In Jeong s work, it was suggested that the alumina films on the aluminium substrate is in a biaxial stress state, resulting from the elastic accommodation between the alumina film and the underlying aluminium, which leads to the anisotropy of strain energy of the amorphous oxide film [146]. The quantitative estimation was made based on the assumption regarding the proportional relationship between elastic strain energy of the oxide film and that of metal substrate. The calculation revealed that the strain energy follows the increasing order: {001} < {011} < {111}. It also pointed out that the difference between {001} and {011} oriented planes is much smaller compared to the difference between {111} oriented planes and planes along the other two orientations, i.e. {001} and {011} planes, which is consistent with the experimental results in previous work [138]. Pitting potential is a useful concept to compare the pitting corrosion resistance and also a characteristic threshold potential followed with a rapid rise of overall current density. The investigation of pitting potential advances the understanding of pitting nucleation [137, 140, 141, 147]. Even though pitting potential attracts wide attention, the results show great scattering. In Feller s work of aluminium single crystals, no difference of pitting potential between the {001}, {011} and {111} oriented surfaces in 0.01M NaCl was observed [143]. More recent work introduced statistical method to handle the 51
52 Chapter 2: Literature Review scattering data of pitting potential of surfaces following various crystallographic orientations. In Yasuda s work, the pitting behaviour of aluminium is apparently anisotropic [141]. The average values along with standard deviations of pitting potential confirm its dependence on surface orientation. The tendency of the pitting potential follows the decreasing order: {001} > {011} > {111}, indicating the susceptibility of pitting corrosion in the decreasing order: {001} > {011} > {111} [141]. Similarly, the work of Treacy et al. revealed the same order of pitting potential using statistical methods, indicating its dependence on the crystallographic orientation [140]. The formation of crystallographic pits on {001} oriented plane requires the removal of atoms along {111} substrate whereas the pitting behaviour on {111} oriented planes requires the dissolution of atoms along {001} substrate with lower atomic density than that along {111} orientation, contributing to the nature of orientation dependent pitting potential in aluminium. On the contrary, a slight different result was reported by Yu et al., with the pitting corrosion following the order: {011} > {001} > {111}[148]. Even with the disagreement between the relationship between {001} oriented single crystal aluminium and {011} oriented single crystal aluminium, it is widely accepted that {111} oriented plane has the most negative pitting potential, indicating its highest pitting corrosion susceptibility. Additionally, the metastable pitting behaviour below the pitting potential was also investigated on the aluminium single crystals with the orientations of {001}, {011} and {111}. It was found that {111} oriented planes display the highest number of metastable pitting events. Since the metastable pitting involves the breakdown and re-passivation of the aluminium oxide film, the highest number of metastable events in {111} oriented planes is consistent with instability of oxide film in {111} oriented planes as mentioned above [147]. More direct evidence of grain-orientation dependence of pitting corrosion was provided by the pit density and pit size on the surface of aluminium single crystal along different orientations. It was revealed that the pit density and pit size display anisotropy in single crystals along different orientations. Similar appearance on {001} and {011} oriented surfaces was observed, exhibiting a smaller number of pits with increased dimensions along with pit clusters comparing with that on {111} oriented surfaces [141]. The higher pit density on {111} oriented surface indicates its low pitting corrosion resistance. Besides, the average values of pit densities and pit size distributions for {001}, {011} and {111} oriented planes were measured after anodic polarization 52
53 Chapter 2: Literature Review followed by pre-treatment at optimum cathodic potential. The results suggested that pit density increases in the order: {011} < {001} < {111} whereas the surface area covered by pits is the smallest in {111} oriented plane, revealing the more localized corrosion behaviour on {111} oriented plane [138, 139]. In summary, the pitting behaviour is orientation dependent in aluminium due to the different stability of the corresponding oxide film. Although there are some discrepancy of pitting susceptibility between {011} and {001} oriented planes, it is generally accepted that {111} oriented plane has the lowest pitting resistance. As a result, {111} oriented plane has the highest pit density along with the most negative pitting potentials of the three low index crystal planes in high purity aluminium. Unlike the pit nucleation, the pit propagation is closely linked to the underlying aluminium substrate due to the breakdown of passive film during the pit nucleation [ ]. Typical crystallographic pit has a well-defined half-cube shape with sharp edges. It is generally accepted the pit walls are comprised of {001} oriented planes due to its highest thermodynamic stability along with the slowest dissolution rate [138, 149]. As a result, the mechanism for the formation of typical crystallographic pits is established. During the development of crystallographic pits, the rapid-dissolving facets disappear, leaving the most stable facet surrounding the crystallographic pit. The theory fits most experimental results since most crystallographic pits in pure aluminium are bound by {001} oriented planes. The occasional observation of {011} and {111} oriented planes is attributed to the transitional condition rather than thermodynamic stable condition. Additionally, the low population density of {011} and {111} oriented planes further confirms the transient nature as the crystallographic pit walls. In Yasuda s work, close examination of crystallographic pits reveals that pit walls are composed of {001} oriented planes with steps along <001> direction. It also reveals that with higher chloride concentration, the crystallographic pits are still composed of {001} oriented plane along <001> direction in a finer scale [141]. The crystallographic pit growth was also widely investigated. In previous work, the average pit growth rate was evaluated by measuring the time for perforation of thin metal foils by pitting corrosion [144, 150]. However, the later finding, namely the passivation of a large fraction of crystallographic pits during the testing, questioned the average pit growth rate from the foil-penetrating method, since the penetration time for 53
54 Chapter 2: Literature Review a thin film is still much larger than the active time of the individual active dissolution event. Therefore, an in-situ observation method was introduced to evaluate the pit growth rate by attaching the thin foils to a glass, which allows the in-situ observation from the back side with the assistance of microscopes [137, 151]. More recent work about the pit growth rate evaluation was conducted by Seo, based on the assumption about the independence of pit current density from anodic polarization time [138, 139]. As a result, the pit current density calculated by total anodic charge and the total active surface represents the pit growth rate. The results revealed that the lowest growth rate is on {001} oriented plane. It was also revealed after pit nucleation, the fastest dissolving plane is the {011} oriented plane due to its highest surface energy. Additionally, in Ono s work regarding single crystal aluminium along {001} oriented planes, the pit propagation rate was evaluated using the largest pit size and pulse duration since a significant fraction of pits remain passivated during the testing. The propagation rate was found to follow the Arrhenius temperature dependence with the activation energy value around 7.2 kcal/ mol [152]. Further, as reviewed in section 3.2.1, it is believed that necessary chemical condition with high chloride concentration along with low ph is crucial for the development of stable crystallographic pit, which is defined as stable localized corrosion developed in the form of crystallographic pitting [84, 153, 154]. It has been revealed that a large fraction of pits remain passivated during the crystallographic dissolution of aluminium. In other words, the individual dissolution event has its limited lifetime [139, 149]. In the recent work, the metastable pitting behaviour of aluminium single crystals were explored by Davis et al., revealing the {110} oriented planes display the least number of metastable events whereas {111} oriented planes exhibit the highest number [147]. It was also revealed that {111} oriented planes with higher atomic density result in more localized corrosion morphology, namely low surface area with increased depth beneath the alloy surface. The structural features of the localized corrosion sites contribute to the stabilisation of the local chemical condition, which is characterized by the low ph required for the development of stable pitting, due to the rapid hydrolysis from high concentration of aluminium ions. In Tak s work, a model based on limited lifetime of dissolution event was proposed [155]. The examination of the aluminium surface revealed that the active area with adsorbed chloride ions into the surface and passive area covered by alumina film were both existed. Re-passivation occurred with de-sorption of chloride ions 54
55 Chapter 2: Literature Review whereas re-activation occurred along with adsorption of chloride ions. The rapid desorption and absorption of chloride ions determines that only a small fraction of crystallographic pits remain active. Further propagation of crystallographic pits could result in corrosion tunnelling when the crystallographic pit walls remain passivated and only the tips stay active. Based on the formation of tunnelling followed by crystallographic pitting, anodic etching of aluminium foil along the orientation parallel with {001} oriented plane can produce a high population density of tunnelling vertical to the aluminium surface, which has been widely applied in the industry for the fabrication of electrolytic capacitors [136, 149, 156, 157]. In Ono s work, it was revealed that the tunnelling propagation rate fits the Arrhenius temperature dependence with higher activation energy, indicating the higher stability of the structure as corrosion tunnelling [152]. Additionally, as suggested the author, the chemisorbed chloride complex plays a crucial role for the transformation from crystallographic pitting to corrosion tunnelling. B. Crystallographic corrosion in aluminium alloys Due to the presence of alloying elements in the aluminium alloys, the crystallographic dissolution behaviour is less evident than that in high purity aluminium. Therefore, relatively limited work has been done to explore the crystallographic dissolution behaviour in aluminium alloys. It was revealed that crystallographic pit was developed on the surface of the homogeneous Al-Cu aluminium alloy after polarized to pitting potential or above pitting potential. Similar with the morphology of the pit developed during the crystallographic dissolution in pure aluminium, crystallographic pits with relatively well-defend shapes are present with rounded pit walls. TEM analysis of the crystallographic pits revealed the rounded pit walls were comprised of {001} oriented planes in a finer scale [137]. In Yasuda s work, the pitting behaviour of homogenized Al-Cu single crystals was investigated to explore the influence of copper on the crystallographic dissolution behaviour [141]. The results revealed that the presence of copper leads to a positive shift of pitting potential, and significantly reduces the dependence of pitting potential on the crystallographic orientation, resulting in a complete transformation of pit morphology from the faceted to the irregularly-shaped. 55
56 Chapter 2: Literature Review The modification of the morphology of the crystallographic pits due to the addition of copper in the alloy is mainly attributed to the build-up of copper on the pit walls during the anodic dissolution of aluminium. The copper enrichment at the preferential site for aluminium dissolution leads to the cessation of dissolution, requiring higher driving force to recommence it. As a result, the pitting potential increases. The increase of pitting potential caused by the addition by copper is much larger than the difference existed between crystal planes along different orientations, leading to the absence of orientation dependence in pitting potentials. Meanwhile, the dissolution at the favoured regions, i.e. kinks, is retarded due to the copper build-up, resulting in the dissolution at the less preferential sites and finally at random sites on the terrace, which disturbs the formation of faceted pits. Therefore, the pit morphology was modified in Al-Cu alloy [141]. In more recent work, crystallographic pitting behaviour was also investigated in the commercial aluminium alloy. In Laferrere s work to explore the crystallographic corrosion behaviour in heat exchanger aluminium alloys, faceted pits from crystallographic corrosion are evident [158]. Diffraction pattern was employed to identify the orientation of pit wall, revealing the pit walls are comprised of {001} oriented planes. The pit propagation within an individual grain is similar with the propagation mechanism in pure aluminium, namely the disappearance of rapidlygrowing facets and the maintenance of more stable facets with the slowest dissolution rate. However, when the corrosion front reached the grain boundary, the crystallographic dissolution was interrupted due to the absence of fast-dissolving planes in the direction vertical to grain boundary planes, leading to the elongated dissolved polyhedral pits along the grain boundary. Therefore, the corrosion front developed along the grain boundary, penetrating deeper into the alloy instead of crossing the grain boundary Corrosion behaviour of Al-Cu-Li alloys As summarized in the section 2.2.2, the microstructural evolution in Al-Cu-Li alloys involves the development of T 1 phase precipitates during the thermomechanical process. Due to the high corrosion susceptibility of T 1 phase precipitates, the corrosion morphology and susceptibility of Al-Cu-Li alloys are closely linked to the distribution and population density of T 1 phase precipitates. Therefore, the corrosion behaviour of 56
57 Chapter 2: Literature Review T 1 phase precipitates and its influence on corrosion behaviour of Al-Cu-Li alloy is reviewed in the following sections Corrosion behaviour of T 1 phase The corrosion behaviour of T 1 phase has been widely studied with the model alloy [120, 121, ] since the high corrosion susceptibility of T 1 phase significantly affects the corrosion behaviour of Al-Cu-Li alloys. The previous work by Buchheit studied the electrochemical behaviour of synthesized bulk T 1 phase in chloride-containing environment. The result revealed T 1 phase has a more negative corrosion potential with respect to the alloy matrix. It was also pointed out that the current density of T 1 phase is around three orders of magnitudes higher than that of the alloy matrix, indicating the high corrosion susceptibility of T 1 phase. The author also suggested the high corrosion susceptibility of AA2090 is attributed to the high concentration of T 1 phase precipitates [120, 121]. More recent work by Li et al. proposed the corrosion mechanism associated with T 1 phase in Al-Li alloy, by immersing the galvanic coupling consisting of the synthesized T 1 phase bulk and alloy matrix in the NaCl solution. The corrosion potential conversion behaviour was noticed. At first, T 1 phase with a more negative potential suffered self-dissolution, resulting in the preferential dissolution of Li and possibly Al along with enrichment of Cu in the T 1 phase remnant. As a result, the positive shift of the corrosion potential of T 1 phase occurred and the T 1 phase remnant becomes cathodic with respect to the alloy matrix. The micro-coupling between the T 1 phase remnant and the alloy matrix resulted in the preferential dissolution of the alloy matrix at its adjacent periphery, resulting in the trenching and subsequently detachment from the alloy matrix [159, 160] Localized corrosion in Al-Cu-Li alloys Extensive work has been done to study the localized corrosion behaviour of Al-Cu-Li alloys, revealing the relationship between T 1 phase precipitates and corrosion behaviour of the alloys [112, , ]. Previous work was focussed on the intergranular corrosion susceptibility in Al-Cu-Li alloys. In the work of Buchheit et al., it was revealed that the subgrain boundary attack is evident at the localized corrosion sites in AA2090 Al-Cu-Li alloy, corresponding to the high population density of T 1 phase precipitates along the subgrain boundary network. With the selective dissolution of T 1 phase precipitates along subgrain 57
58 Chapter 2: Literature Review boundary, subgrain boundary pitting occurred, resulting in an occluded corrosive environment with low ph, and consequently leading to the continuous attack along the subgrain boundary [120, 121]. The corrosion mechanism associated with subgrain boundary T 1 phase precipitates was further confirmed by Kertz et al. [163]. When T 1 phase precipitates along the grain boundary reaches a critical concentration, selective dissolution of active T 1 precipitates contributes to the subgrain boundary attack. On the contrary, when T 1 phase is absent or under the critical concentration and T B and θ phase precipitates are present along the boundary, the alloy displays high corrosion resistance to intergranular attack and inter-subgranular attack. However, the intergranular corrosion susceptibility is attributed to the precipitate free zone along the grain boundary, as suggested by other researchers. After ageing at 200 C, the Al-Cu-Li alloy displays a 0.2µm wide copper-enriched precipitation free zone, leading to the micro-coupling between the grain boundary and the precipitate free zone and consequently the preferential dissolution of the anodic regions along the subgrain/grain boundary network [112]. The high intergranular corrosion sensitivity was found in a 2197 type Al-Li alloy. The intergranular corrosion is mainly attributed to the combined effect of the T 1 phase precipitates with larger dimensions and the precipitation free zone with increased dimensions [165]. Recent work on Al-Cu-Li AA2050 alloy without artificial ageing reported that the relatively high population density of T 1 phase precipitates along the grain boundary leads to intergranular corrosion in NHT (non-heat treatment) specimen. However, the artificial ageing increases the volume fraction, resulting in higher population density of T 1 phase precipitates in both grain boundary and the alloy matrix. The development of T 1 phase precipitates consumes copper in the alloy matrix, leading to the decreased copper content as solid solutes in the matrix. As a result, the corrosion susceptibility of the grain interior increases, leading to intragranular corrosion, as the dominant corrosion features, in AA2050 aluminium alloy after 9 hours ageing treatment at 155 C [122, 123, 162, 164]. Additionally, the exfoliation corrosion was another typical corrosion morphology that could lead to detrimental results. The exfoliation corrosion susceptibility is associated with intergranular corrosion in the alloys. The exfoliation corrosion behaviour of Al-Li alloys under T6 and T8 temper was investigated by Li [124]. The results revealed that alloy in T6 temper has higher exfoliation corrosion susceptibility due to the larger amount of T 1 phase precipitates with increased 58
59 Chapter 2: Literature Review dimensions along the grain boundary. Therefore, more corrosion product caused by the intergranular corrosion along the grain boundary in the alloy in T6 temper results in stronger lifting force, which finally leads to high exfoliation corrosion susceptibility of the Al-Cu-Li alloy in T6 condition. In summary, due to the negative potential of T 1 phase with respect to the alloy matrix, the distribution and population densities of T 1 phase precipitates significantly affect the localized corrosion behaviour of lithium-containing aluminium alloys. 59
60 Chapter 2: Literature Review Table 2.1: The influence of alloying elements. Table 2.2: Series of aluminium alloys. 60
61 Chapter 3: Experimental Methods CHAPTER 3 Experimental Methods 61
62 Chapter 3: Experimental Methods 3 Experimental Methods 3.1 Materials AA2024-T351 aluminium alloy A 1.2 mm thick AA2024-T351 aluminium alloy sheet was used in the present study. The composition of the AA2024 alloy was determined by inductively coupled plasmaatomic emission spectroscopy with the results as follow: Cu 4.65 wt.%; Fe 0.21 wt.%; Mg 1.54 wt.%; Mn 0.52 wt.%; Si wt.%; Zn 0.11 wt.% ; Al rem A97 aluminium alloys The 2A97 aluminium alloys in four different thermomechanical conditions were investigated in the present study. The 2A97-T3 (solution treatment, followed by cold working and natural aging) and 2A97-T8 (solution treatment, followed by cold working and artificial aging) aluminium alloys were supplied as the 1 mm thick sheets. And 2A97-T4 (solution treatment, followed by natural aging) and 2A97-T6 (solution treatment, followed by artificial aging) aluminium alloys were supplied as the 2 mm thick plates for the present study. The elemental composition of the 2A97 alloy was determined using inductively coupled plasma-atomic emission spectroscopy, with the results as follow: Li 1.38 wt.%; Cu 3.59 wt.%; Zn 0.59 wt.%; Mg 0.30 wt.%; Mn 0.31 wt.%; Fe 0.09 wt.%; Al rem. 3.2 Specimen preparation Mechanical polishing To remove the surface roughness developed during the fabrication process, specimens were mechanically ground with 600, 1200, 2500 and 4000 grit silicon carbide paper and polished sequentially with 3 µm and 1 µm diamond pastes with mecaprex polishing liquid as lubricant. Colloidal silica suspension (also known as OPS, oxide polishing suspensions) with the nano-particles with the dimensions around 40 nm was also used as the final step of certain specimens as stated elsewhere. Following the mechanical polishing, the specimens were agitated ultrasonically in the acetone bath for degreasing, rinsed in deionized water and dried in a cold air stream. 62
63 Chapter 3: Experimental Methods Electropolishing Electron back scatter diffraction (EBSD) analysis is an effective method to reveal the crystallographic structure of aluminium alloys. Since EBSD signal was collected from several nanometres in thickness from the alloy surface, it is necessary to remove the near surface deformed layer and oxide layer on the alloy surface since they compromised the quality of EBSD pattern. Therefore, electropolishing was applied to reduce macroscopic heterogeneities on the alloy surface and, consequently, to prepare the stress-free surface for EBSD analysis. The electrolyte for electropolishing, i.e. a mixture of perchloric acid and ethanol in the proportion of 1:4, was prepared in an ice bath, by adding 200 ml of perchloric acid into 800 ml of ethanol. Due to the highly oxidising nature of the mixture, the temperature during the solution preparation process was monitored and maintained below 7 C. In the present study, the specimen was first mechanically polished to 1 µm prior to the electropolishing. Electropolishing was carried out at 20 V with the polished specimen as anode and high purity aluminium as cathode. Figure 3.1 displays the equipment set-up during the electropolishing process. The periods of the electropolishing depended on the surface condition, ranging from 30 seconds to 180 seconds for different specimens. The temperature during the electropolishing was maintained below 10 C. Following the electropolishing, the specimen was removed from the electropolishing electrolyte immediately and rinsed first in ethanol for 30 seconds, following by rinsed in deionized water for another 30 seconds before dried in a stream of cold air. During the entire process, the experiment was carried out in a fume cupboard Alkaline etching Alkaline etching, which is also termed as caustic etching, is an important surface pretreatment method in the surface engineering, to remove the surface contamination and the near surface deformed layer on the alloy surface. It has been widely reported that both morphological and compositional modification of the near surface area are evident after the alkaline etching [ ]. Specifically, a copper-enriched layer could develop on the surface of the etched copper-containing aluminium alloys. In the present study, the alkaline etching was used in both AA2024-T351 alloy and 2A97 alloys in various conditions to obtain the copper build-up on the etched alloy 63
64 Chapter 3: Experimental Methods surfaces. Prior to alkaline etching, the specimens were mechanically polished to 1 µm. The mechanically-polished specimens were etched in 10 wt. % NaOH solution at 60 C for 5 minutes. After the alkaline etching, the specimens were rinsed in deionized water and desmutted in 30 vol. % HNO 3 solution for 30 seconds. Then the specimens were rinsed in deionized water and finally dried in a stream of cold air Ultramicrotomy Ultramicrotomy for specimen preparation is from biological field, and receives wide application in aluminium alloys to obtain cross sections as well as electron transparent foils at specific locations. In the present work, ultramicrotomy was applied to create cross sections and thin foils with the thickness around 15 nm at the stable localized corrosion site after the immersion testing. The ultramicrotomed specimens were generated in the following procedure. First, a sharp tip was generated from the alloy sheet by cutting with hacksaw, following by mechanical grinding. The sharp tip was then trimmed by a glass knife to generate a cutting area around µm 2, which is illustrated in Figure 3.2 (a). Finally, a diamond knife was applied to obtain thin sections with the nominal thickness 15 nm. If the specimen was prepared as the cross section for SEM observation, then the preparation process was finished after series cutting with the diamond knife. To obtain the electron transparent foils, the thin foils cut by diamond knife were spread in deionized water and collected onto 400 mesh nickel grids for further TEM observation, as illustrated in Figure 3.2 (b) GDOS etching Glow discharge optical emission spectroscopy (GDOS) is widely used to provide direct information regarding compositional analysis and depth profiling by sputtering specimens in an argon atmosphere. The atoms generated by sputtering undergo collisions with the plasma, resulting in the complicated excitation and emission of photons with characteristic wavelengths for element identification and the subsequent depth profiling. In present work, GDOS was employed to prepare the stress-free surface for EBSD analysis, especially for the specimen after the immersion testing since electropolishing removed the corrosion features developed on the alloy surface and led to the 64
65 Chapter 3: Experimental Methods development of etching pits, affecting the further analysis of the stable localized corrosion. Argon gas plasma not only removed the near surface deformed layer and any surface contamination, including the residual corrosion product, but also maintained the corrosion morphology at the stable localized corrosion site, which make it a better method to prepare stress-free surface for corroded specimens Focused ion beam Focused ion beam, also known as FIB, is a technique used increasingly in materials science for site-specific analysis. In the present study, FEI Quanta 3D, a dual beam FIB SEM (with a gallium ion beam and an electron beam) was used for the production of cross-sections and TEM samples. First, platinum can be deposited on the sample to protect the surface during the milling. Further, gallium ion beam hits the sample surface and sputters a small amount of material, allowing milling of the sample to be achieved. At the stage, the cross section is ready for SEM observation. For the production of TEM specimens, after the milling, an Omni probe micro manipulator is employed for the manipulation and collection. 3.3 Testing To investigate the corrosion behaviour of aluminium alloys, different testing methods were employed to both AA2024-T351 aluminium alloy and 2A97 aluminium alloys in various tempers Immersion testing The immersion testing was carried out with mechanically polished aluminium alloy specimens in air at ambient temperature, using different testing solutions for different purposes. The 3.5 wt. % NaCl solution was the most common testing solution for the immersion testing in the present study. To accelerate the corrosion process, droplets of 20 vol. % hydrogen peroxide were added to the testing solution. Apart from the standard corrosion immersion testing method that immersing the specimen in a 3.5 wt. % NaCl solution with/without addition of H 2 O 2, a new corrosion immersion testing consisting of immersion in 3.5 wt. % NaCl (H 2 O 2 ) solution followed by deionized water for various periods was also used. Additionally, copper chloride with different concentrations was 65
66 Chapter 3: Experimental Methods added in the testing solution during the immersion to identify the active cathodic reaction sites on the alloy surface. Prior to immersion testing, Lacquer 45 was applied to protect the edge of the specimens to avoid any interference. During the immersion testing, an in-situ video system was employed to record the surface morphology in the monitored area. After the immersion testing, the tested specimens were rinsed in deionized water and then dried in a stream of cold air, which essentially halted the corrosion of the alloy. With prolonged immersion time, a thick layer of corrosion product developed during the immersion testing, which prevented the further observation and analysis of the corroded alloy surface. To remove the corrosion product layer, gentle polishing with 1 µm diamond paste was applied. Besides, the application of GDOS is also an effective alternative for the purpose Electrochemical measurement For the electrochemical measurement set-up, a three-electrode electrochemical cell was employed with a platinum gird as the auxiliary electrode (AE) and a saturated calomel electrode (SCE) as the counter electrode (CE). The specimen with the mechanicallypolished surface was first masked with lacquer, with only 1 cm 2 exposed surface to the testing solution as the working electrode (WE). A Solarton 1090 electrochemical measuring unit was employed for the electrochemical measurement, with high purity nitrogen to obtain de-aerated testing solution. The set-up of the electrochemical cell is illustrated in the schematic diagram as shown in Figure 3.3. Anodic potentiodynamic polarization was conducted in a 3.5 wt. % NaCl solution, scanning from -50 mv to 550 mv with respect to the open circuit potential. A scanning rate of 0.5 mv/s was employed. Prior to the potentiodynamic polarization, the specimen was immersed in the identical testing solution for 5 minutes for the establishment of stable surface condition. Cathodic potentiodynamic polarization was conducted in an acidified electrolyte containing 3.5 wt. % NaCl with HCl to adjust the ph of the electrolyte to 3. Both asreceived alloys after mechanical polishing and etched alloys after alkaline etching were used as the working electrodes. Before the potentiodynamic polarization, the electrolyte was de-aerated with high purity nitrogen for at least 2 hours. Cathodic polarization was 66
67 Chapter 3: Experimental Methods conducted from 50 mv to -550 mv with respect to the open circuit potential at a scanning rate of 1 mv/s. 3.4 Characterization Optical microscopy Optical microscope produces magnified images with visible light and a system of lenses, revealing the topographical information of the specimen surface. In order to monitor the surface morphology changes during the immersion testing, the in-situ observation system consisted of a stereo optical microscope (Olympus BHM) connected with a computer was applied. Series optical micrographs were taken at the interval of 10 seconds to record the surface morphology during the immersion testing. Selected images from the in-situ monitoring system clearly delineated the surface appearance evolution with immersion time Scanning electron microscopy Unlike optical microscope, scanning electron microscope produces the images with a focused beam of electrons scanning the specimen surface. The interaction between the electron beam and the specimen generates various signals. Based on this, the secondary electron (SE) micrograph and backscattered electron (BSE) micrograph are generated, revealing the topographical and compositional information of the specimen, respectively. Detailed examination of the morphology and composition of interesting regions on the surfaces and cross sections of the alloy after various treatments were performed in either Zeiss Ultra 55 FEG-SEM or Magellan high resolution FEG-SEM, fitted with energy dispersive X-ray (EDX) facilities and electron backscatter diffraction (EBSD) detector for compositional and crystallographic structural analysis. A FEI Sirion FEG-SEM with EBSD detector was specially used for EBSD analysis of stable localized corrosion sites after the GDOS cleaning. To obtain high-resolution SEM micrograph for the detailed morphology, a lower voltage of 1.5 kv was applied for higher topographic sensitivity. For the compositional and crystallographic structural information, typical voltage of 15 kv or 20 kv was employed for backscattered electron micrograph, EDX analysis and EBSD analysis of interesting regions. 67
68 Chapter 3: Experimental Methods Environmental scanning electron microscope equipped with the special diamond knife was employed to obtain serial cross sections at the step size of 15 nm with ultramicrotomy technique. Successively acquired 2-D backscattered electron micrographs after aligned followed with correction for stage drifting and tilting were applied to generate 3-D volumetric reconstruction. Due to the contrast in the BSE micrograph from atomic number difference, different corrosion features can be segmented with different colours to create the 3-D volumetric reconstruction Transmission electron microscopy In the present work, transmission electron microscopy observation was carried out using a Joel 2000 FXII for bright field TEM microscope and FEI Tecnai G2 20 (fitted with EDX facility) along with a FEI Tecnai G 2 F30 transmission electron microscope (fitted with EDX facility and electron energy loss spectroscopy (EELS) system) for microchemical analysis. Joel 2000 FXII with the tungsten filament was operated at an accelerating voltage of 120 kv. For Tecnai G2, the LaB 6 gun filament with low work function was equipped, enabling the voltage reaching as high as 200 kv. With the application of field emission gun, Tecnai F30 could be operated at the voltage of 300 kv, enabling the high resolution TEM micrograph at atomic resolution, which is also termed as lattice image. The analysis of lattice image was processed using Gatan Digital Micrograph software, which provided direct information about the crystallographic parameters, facilitating the identity of the phase and local crystallographic orientation relationship. Two methods were applied in the present work to prepare TEM specimens. Besides the ultramicrotomy as mentioned below, twin-jet electropolishing was employed in the present study. For microstructure characterization of AA2024-T351 alloy and 2A97 aluminium alloys in various conditions, twin-jet electropolishing was selected to prepare TEM specimens. After mechanical grinding and gentle polishing to 3 µm, the thickness of the specimen should be in the range from 60 µm to 100 µm, with a relatively shiny surface appearance. Discs of 3.0 mm diameter were then punched from mechanical polished thin plates. Twin-jet electropolishing was performed in a Tenupol-3 instrument at selective voltages in the range of 12 V to 14 V. The electropolishing was conducted in a mixed solution of 30 vol.% nitric acid and 70 vol.% methanol with the cooling system 68
69 Chapter 3: Experimental Methods to maintain the temperature around -35 C during the twin-jet electropolishing process. After the twin-jet electropolishing, the electron transparent foils were removed from the holder, carefully rinsed in methanol and dried on a piece of filter paper prior to the TEM observation. 69

70 Chapter 3: Experimental Methods Figure 3.1: Schematic diagram of the equipment set-up during electropolishing process. 70
71 Chapter 3: Experimental Methods (a) (b) Figure 3.2: Schematic diagrams showing the sectioning process of ultramicrotomy (a) Trimming process by glass knives, (b) Sectioning process by the diamond knife. 71

72 Chapter 3: Experimental Methods Figure 3.3: Schematic diagram of the electrochemical cell for potentiodynamic polarization measurement in a de-aerated testing solution. 72
73 Chapter 4: Microstructure Characterization of AA2024-T351 and 2A97 Aluminium Alloys CHAPTER 4 Microstructure Characterization of AA2024-T351 and 2A97 Aluminium Alloys 73
74 Chapter 4: Microstructure Characterization of AA2024-T351 and 2A97 Aluminium Alloys 4 Microstructure Characterization of AA2024-T351 and 2A97 Aluminium Alloys The addition of alloying elements in aluminium alloys is applied to obtain better mechanical performance, which also results in the microstructural heterogeneity in the alloys. Since the microstructure has a significant impact on the corrosion resistance of the alloys, the comprehensive understanding of the microstructure is necessary for the successful application in aircraft industry. In the first part of the Chapter, the microstructure of AA2024-T351 Al-Cu-Mg alloy is discussed, with the particular interest in the intermetallic particle due to its crucial role in the localized corrosion of AA2024 alloy [67, 70, 172]. The distribution and the composition of constituent intermetallic particles were determined by SEM and EDX analysis. The crystallographic structure of constituent intermetallic particles was characterized by EBSD as well as TEM. A range of configurations and population densities of precipitates and segregations along the grain boundaries were analysed with TEM. Crystallographic structure of the alloy matrix was investigated with EBSD to display the distribution of grain-stored energy and grain boundary misorientation in AA2024 alloy. In the second part of the Chapter, the microstructure of 2A97 Al-Cu-Li alloys under various thermomechanical conditions is explored, with particular attention paid to the precipitate due to its significant influence on the corrosion behaviour of Al-Cu-Li alloys [ ]. SEM along with EDX analysis was carried out to reveal the distribution and composition of the constituent intermetallic particles in 2A97 Al-Cu-Li alloys. The distribution of dispersoids and precipitates in the 2A97 Al-Cu-Li alloys were explored with high resolution SEM and TEM. EDX analysis was also conducted to determine the composition of dispersoids and precipitates. The crystallographic structure of the 2A97 Al-Cu-Li alloys, which is sensitive to the thermomechanical history, was determined with EBSD in the present work. 4.1 Microstructure of AA2024-T351 aluminium alloy Constituent intermetallic particles 74
75 Chapter 4: Microstructure Characterization of AA2024-T351 and 2A97 Aluminium Alloys The distribution of intermetallic particles As shown in Figures 4.1 (a)-(b), the backscattered electron micrographs display the surface of AA2024-T351 aluminium alloy after mechanically polished with 1 µm diamond paste and silica suspension (i.e. OPS), respectively. Bright features of micrometre scale dimensions are constituent intermetallic particles on the alloy surface. The results reveal a uniform distribution of constituent intermetallic particles, with the dimensions ranging from 0.54 µm to 19.2 µm. EDX analysis was employed to obtain the compositional information from the constituent intermetallic particles on the mechanically-polished alloy surface. With more than 100 intermetallic particles examined, the constituent intermetallic particles in AA2024-T351 aluminium alloy were identified and classified into three types based on the EDX analysis results. The constituent intermetallic particle that is rich in aluminium, copper and magnesium is assigned as S-phase and that is only rich in aluminium and copper is assigned as θ- phase. Typical S-phase particle with the relatively regular spherical shape has the size ranging from 0.54 µm to 4.57 µm, accounting for 22.2% of all constituent intermetallic particles on the alloy surface. Typical θ-phase particle, which is also characterized by the spherical shapes, has a slightly larger size ranging from 0.73 µm to 6.18 µm, which accounts for 40.4% of all constituent intermetallic particles on the alloy surface. The third type of constituent intermetallic particle is termed as α-phase (also termed as Al- Cu-Fe-Mn-(Si) particle) in the present work, which is rich in aluminium, copper, iron, manganese and silicon. The variation in the amount of alloying elements is evident with different contents of Cu, Fe, Mn and Si in α-phase particles. Typical α-phase particle has an irregular shape with a larger dimension ranging from 1.19 µm to 19.2 µm and accounts for 37.4% of all constituent intermetallic particles on the alloy surface. Typical EDX spectra of S-phase, θ-phase and α-phase are shown in Figures 4.2 (a)-(d), respectively. Surprisingly, the EDX spectra of both S-phase and θ-phase particles contain the peaks of aluminium, copper and magnesium as shown in Figures 4.2 (a)-(b). The interaction volume between the electron beam and the alloy should be considered since the accelerating voltage of 20 kv was employed during the EDX analysis, with the penetration depth around several microns into the alloy. Therefore, when the intermetallic particle is not large enough, the X-ray signals collected by EDX detector 75
76 Chapter 4: Microstructure Characterization of AA2024-T351 and 2A97 Aluminium Alloys contain compositional information from both the intermetallic particle and its adjacent alloy matrix. The alloy matrix in the periphery contains certain amount of magnesium, which, consequently, results in the Mg peak in the EDX spectra of θ-phase particles. Even though EDX spectra of S-phase and θ-phase particles may contain the same peaks, it is still distinguishable since the S-phase particle has relatively high content of magnesium, resulting in more evident magnesium peak with respect to that of θ-phase particle in the EDX spectrum. Semi-quantitative EDX analysis is also available to distinguish S-phase and θ-phase. It is suggested the Mg/Cu ratio should be higher than 0.5 in S-phase particles as an empirical rule. EDX spectra of α-phase particles display the yields from Al, Fe, Mn, Cu and Si, with the evident variations in compositions. Quantitative EDX analysis provides the contents of alloying elements in both α-phase particles, with the corresponding results shown in Table 4.1. It is evident that the contents of Si and Cu vary significantly, while those of Mn and Fe are less variable. However, on the surface of the AA2024-T351 aluminium alloy after polished by OPS, only 14.6% of constituent intermetallic particles belong to S-phase whereas 48.3% of the intermetallic particles are θ-phase intermetallic particles, suggesting the increased population density of θ-phase particles with respect to that after mechanically polished to 1 µm. The different ratios of percentages between θ-phase particles and S-phase particles after two different surface finishing treatments are attributed to the chemical effect during the OPS polishing, which could lead to the selective dissolution of Mg from S-phase particles. EDX analysis collected compositional information in the intermetallic particle regardless of its crystallographic structure. The dealloying behaviour of S-phase particle prior to EDX analysis results in the increased population density of intermetallic particles rich only in aluminium and copper, which contains the θ-phase particles as well as the S-phase remnants after selective dissolution of Mg due to the chemical effect from OPS polishing. Therefore, the percentage of so-called θphase particles increases on the surface of AA2024 alloy after OPS polishing. As mentioned above, the absence of crystallographic structural information may lead to misjudgement between S-phase and θ-phase since S-phase has similar dimension and composition with θ-phase. Therefore, in the present study, Kikuchi pattern obtained by EBSD was employed to analyse the classification of constituent intermetallic particles in the AA2024-T351 aluminium alloy. Typical Kikuchi patterns obtained from S-phase and θ-phase intermetallic particle are shown in Figure 4.3 along with the corresponding 76
77 Chapter 4: Microstructure Characterization of AA2024-T351 and 2A97 Aluminium Alloys indexed results automatically achieved from the software. The variation in the amounts of alloying elements in α-phase particles results in variation of the crystallographic structure, making it difficult to index the corresponding Kikuchi pattern. In Figure 4.3 (e), a typical Kikuchi pattern of selected α-phase particles (which was confirmed by EDX analysis) is shown with no indexed result. The Kikuchi pattern confirms the classification of intermetallic particles and provides a convincing method to identify intermetallic particles in AA2024-T351 aluminium alloy S-phase and θ-phase particles Figure 4.4 show backscattered electron micrographs of typical regions on the alloy surface, containing high population density of S-phase and θ-phase particles, which were identified with EDX analysis. The micrographs suggest that both S-phase and θ- phase particles on the surface of AA2024-T351 alloy exist in two forms, i.e. single intermetallic particles embedded in the alloy matrix and clustered particles grouped with θ/s-phase particles. The existence of intermetallic particles cluster was also detected using Kikuchi patterns to reveal the crystallographic structure of intermetallic particles. A typical example of intermetallic particle cluster of S-phase and θ-phase particles mixture is shown in Figure 4.5. The indexing of the Kikuchi pattern reveals that particle 1 belongs to θ-phase while the neighbouring particle 2 is an S-phase particle. More typical intermetallic particle clusters between S-phase and θ-phase particles are displayed in Figure 4.6. The voids displayed in Figure 4.6 are likely to be the result of mechanical polishing prior to SEM observation, causing the detachment of certain intermetallic particles from the alloy surface. Since the backscattered electron micrograph is sensitive to atomic number difference with heavy alloying elements displaying higher brightness, the contrast difference in Figure 4.6 reveals the heterogeneous distribution of alloying elements in the intermetallic particle cluster on the alloy surface. The average atomic number in θ-phase (Al 2 Cu) particle is higher than that of S-phase particle (Al 2 CuMg), indicating the intermetallic particle with darker appearance to be S-phase and that with brighter appearance to be θ-phase. EDX mapping was performed on the typical intermetallic particle clusters consisting of S-phase and θ-phase particles on the surface of the AA2024 alloy with the typical results shown in Figures Prior to EDX analysis, the contrast of the BSE 77
78 Chapter 4: Microstructure Characterization of AA2024-T351 and 2A97 Aluminium Alloys micrograph was adjusted to identify the clusters. The distribution of elements, including Al, Cu, Mg, Fe, Mn and Si were revealed in the EDX maps. A typical intermetallic particle cluster is shown in the backscattered electron micrograph (Figure 4.7 (a)), displaying two small spherical particles embedded into the intermetallic particle with a relatively large dimension. As shown in the Cu map, the content of copper in the intermetallic particle cluster is higher than that in the alloy matrix, indicating the existence of copper-containing intermetallic particles. The similar intensity of Fe, Mn and Si between the adjacent alloy matrix and the intermetallic particle clusters, as shown in corresponding maps, indicates the uniform distributions of such alloying elements. The heterogeneous distribution of Mg is evident, as shown in Mg map, revealing that two round-shaped particles within the large particle are rich in Mg while the large particle has the similar Mg content with the adjacent alloy matrix. Therefore, the intermetallic particle cluster in Figure 4.7 is comprised of the θ-phase particle and two S-phase particles embedded into it. The same analysis was repeated on the intermetallic particle cluster as shown in Figure 4.8 (a), displaying a typical intermetallic particle cluster consisted of two neighbouring intermetallic particles. The similar shapes between Mg-rich area revealed in Mg map and intermetallic particle 1 (Figure 4.8 (a)) suggests the Mg-rich nature of particle 1, which is considered to be an S-phase particle. The increased copper content of particle 2 and its similar content of Mg with that of the alloy matrix indicate particle 2 belongs to θ-phase. Therefore, the intermetallic particle cluster in Figure 4.8 is an intermetallic particle cluster consisted of S-phase and θ-phase particles α-phase particles Figure 4.9 displays several regions containing α-phase intermetallic particles. Two types of α-phase intermetallic particles were observed, differentiated by the relative contrast, which is consistent with the composition variation shown in Figure 4.2. Similar with the existence forms of S-phase and θ-phase intermetallic particles, two types of α-phase intermetallic particles are present individually or together as a cluster. Figures 4.10 (a)-(b) displays typical individual α-phase intermetallic particles and the corresponding EDX spectrum obtained from the point 1. The EDX spectrum indicates Al, Cu, Fe, Mn and Si in the particle, which is consistent with the definition of α-phase in literature. 78
79 Chapter 4: Microstructure Characterization of AA2024-T351 and 2A97 Aluminium Alloys Unlike S-phase/ θ-phase particles, α-phase intermetallic particles preferentially cluster together, existing as an intermetallic particle cluster with evident composition variation. Typical BSE micrographs of α-phase intermetallic particles are shown in Figures 4.11 (a)-(b), with obvious contrast difference between the outer regions and the inner regions. In addition to the typical shell-core structure, other distinct configurations of α-phase intermetallic particles clusters are also revealed, as shown in Figures 4.11 (c)-(d). Due to the matching geometries of the fracture interfaces belonging to the adjacent particles, it is believed that extra cold working to obtain T351 temper broke the original α-phase intermetallic particle with typical shell-core structure. The α-phase intermetallic particle cluster broke into small particles, which were re-distributed during the subsequent fabrication process, resulting in the configurations in Figures 4.11 (c)-(d). EDX mapping was performed at a typical α-phase intermetallic particle cluster as shown in Figure 4.12 (a). Elements, such as Mn, Si, Mg, Fe and Cu, were revealed in addition to Al. The copper map reveals that the inner region, which corresponds to the region with relatively darker appearance in the BSE micrograph, belongs to the lowcopper-containing α-phase whereas the outer region, displaying higher brightness in the BSE micrograph, has relatively higher copper content. Interestingly, according to the Si map, the low-copper-containing region as the core has relatively higher content of silicon while the silicon content is obviously lower in the high-copper-containing region as the shell. As shown in the Mg map, there is basically no Mg in the intermetallic particles. According to the Fe and Mn maps, the concentrations of Fe and Mn are generally constant across the α-phase intermetallic particle cluster, regardless of the difference in copper / silicon contents. As mentioned above, the shell-core structure was sometimes interrupted during the fabrication process of AA2024 alloy. A typical example is shown in Figure 4.13 (a) with the corresponding EDX mapping results displayed in Figure 4.13 (b). The distribution of alloying elements in the intermetallic particle cluster is consistent with that shown in Figure 4.12 (b). It is revealed that the intermetallic particle with darker appearance belongs to the low-copper-containing region with high Si content in contrast to the high-copper-containing region with low Si content displaying higher brightness in the backscattered electron micrograph. Therefore, the fabrication process, such as cold rolling, which broke the intermetallic particle and modified its distribution, has little impact on its composition. 79
80 Chapter 4: Microstructure Characterization of AA2024-T351 and 2A97 Aluminium Alloys TEM analysis of intermetallic particles Detailed TEM analysis of intermetallic particles was conducted on a twin-jet electropolished TEM specimen of as-received AA2024-T351 aluminium alloy. A high angle annular dark field (HAADF) micrograph is displayed in Figure 4.14 (a) along with EDX spectra at corresponding sites (Figures 4.14 (b)-(d)). It is revealed that the spherical constituent intermetallic particle on the right side of three particles in the HAADF micrograph is a θ-phase particle and the other intermetallic particles belong to α-phase. No dispersoid-free zone is present around the intermetallic particle. Some dispersoids appear to be overlapped with intermetallic particles, as indicated with red arrows, which is likely to be the consequence of the thickness of the TEM specimen. On the edge of twin-jet electropolished TEM specimen of AA2024-T351 aluminium alloy, a cluster of intermetallic particles was detected, displaying various massthickness contrasts as shown in Figure 4.15 (a), which may arise from the compositional difference. The EDX analysis determined that the cluster is consisted of S-phase and θ- phase particles. The framed area in Figure 4.15 (a) is displayed in a bright field TEM micrograph at increased magnification, revealing the existence of linear crystallographic defects along certain orientation, as marked with red arrows in Figure 4.15 (b). Analysis of the diffraction pattern obtained from the corresponding intermetallic particle indicates that the linear crystallographic defect generally developed in the direction parallel with {011} oriented plane in the θ-phase particle. The linear crystallographic defects in θ-phase particles were repeatedly detected as shown in Figure 4.15 (d). Figure 4.15(e) displays the framed area in Figure 4.15 (d) at higher magnification, revealing the similar morphology of the linear crystallographic defects with that in Figure 4.15 (b). Additionally, the corresponding diffraction pattern of the θ-phase particle in Figure 4.15 (d) was obtained, as shown in Figure 4.15 (f). Comparing the morphology of the defects with the corresponding diffraction pattern, it is revealed that the orientation of the linear crystallographic defects were aligned with the {011} oriented plane in the θ-phase particle. Other typical examples of θ-phase particles decorated with linear crystallographic defects were shown in Figures 4.15 (g)-(h). Large numbers of θ-phase particles were examined with TEM, it is revealed that only a small fraction of θ-phase particles in AA2024-T351 aluminium alloy are decorated with linear crystallographic defects along certain orientation. 80
81 Chapter 4: Microstructure Characterization of AA2024-T351 and 2A97 Aluminium Alloys What s more, the linear crystallographic defects were detected in selected α-phase intermetallic particles with a typical example shown in Figure 4.16 (a). The linear feature is evident in the α-phase intermetallic particles as shown in the framed area of Figure 4.16 (a). Figure 4.16 (b) displays the framed area at higher magnification, exhibiting the morphology of the linear crystallographic defects. It is revealed the linear crystallographic defects are characterized with well-defined lines along certain orientation in α-phase intermetallic particles Dispersoids and precipitates Dispersoids Bright field TEM micrographs in Figure 4.17 display the distribution of dispersoids in the AA2024-T351 aluminium alloy at different magnifications. In Figure 4.17 (a), it is revealed that dispersoids in grains with different crystallographic orientations are roughly aligned with the same orientation, which is likely to be the rolling direction. More morphological information of dispersoids in the alloy matrix is shown in Figure 4.17 (b) at higher magnification. The micrograph displays two types of dispersoids in the alloy matrix based on the shapes. Most dispersoids have the rectangular shapes while a few have the round shapes. The dimension of the rectangular dispersoid is around nm length and around nm width, which is in the same order of magnitude as the diameter of the round-shaped dispersoid, ranging from 50 nm to 90 nm. EDX point analysis was performed on dispersoids of both shapes as well as the adjacent alloy matrix. EDX spectra, as shown in Figures 4.17 (c)-(d), reveal that both types of dispersoids are rich in Al, Cu and Mn, indicating the presence of Al-Cu-Mn phase. The dimensions and the compositions of dispersoids in the matrix of the AA2024 alloy are consistent with those of Al 20 Cu 2 Mn 3 phase dispersoids as reported in previous literature, which is widely existed in Al-Cu-Mg alloys [9]. The similarity of dimension and composition between round-shaped dispersoids and rectangular dispersoids indicates the rectangular and round-shaped dispersoids correspond to long and short transverse faces of rod-like dispersoids, which is in good agreement with the fabrication process to obtain the AA2024-T351 sheet. As mentioned in the previous literature [9], dispersoids were formed during the homogenization. The 81
82 Chapter 4: Microstructure Characterization of AA2024-T351 and 2A97 Aluminium Alloys subsequent hot and cold rolling process contributed to the alignment of most dispersoids from different grains with the same direction, supposedly the cold working direction. However, the axes of a small fraction of dispersoids failed to adjust to be aligned with the cold working direction and remained perpendicular of the specimen surface, resulting in the appearance of round-shaped dispersoids in the alloy matrix. Even though the distribution of dispersoids is relatively homogeneous in the matrix of AA2024 alloy, the dispersoid free zones around a fraction of constituent intermetallic particles were detected, as shown in Figures 4.18 (a)-(d). It is evident that in the periphery of selective intermetallic particles, the population density of dispersoids is much lower than that in the alloy matrix away from the influence zone of the particle. EDX analysis was carried out on the intermetallic particles with dispersoid free zone in the periphery, indicating that dispersoid free zone can exist around S-phase particle, θ- phase particle and the cluster of S-phase and θ-phase particles Grain boundary decoration A range of configurations and population densities of second phase precipitates and dispersoids were found along the grain boundaries in the AA2024-T351 aluminium alloy as shown in Figure Figures 4.19 (a)-(b) show bright field and dark field scanning transmission electron micrographs of a triple junction of the grain boundaries, displaying various configurations and population densities of precipitates and dispersoids along the grain boundaries. As shown in Figure 4.19 (b), grain boundary A-A is decorated with both rod-like dispersoids and a continuous precipitate film, as indicated with red arrows, which is supposed to be the consequence of the overlapping of high population density of needle-shaped precipitates [102]. Fine precipitates of relatively low population density are shown along the grain boundary B-B as marked with red arrows. Along grain boundary C-C, only one precipitate with relatively large dimension is present while the other part along the grain boundary remains relatively clean. The large precipitate along grain boundary C-C is elongated along the grain boundary, suggesting the dependence of its growth on the grain boundary. EDX line-scanning was performed along lines 1 and 2, as indicated in Figure 4.19 (a), to obtain the compositional information about grain boundary decoration with the results shown in Figures 4.19 (c)-(d), respectively. As shown in the EDX lines along 82
83 Chapter 4: Microstructure Characterization of AA2024-T351 and 2A97 Aluminium Alloys line 1, the copper line displays the obvious peak while the peak is absent along the Mg line, revealing the grain boundary precipitate is rich in copper. Considering the shape, dimension and composition, the grain boundary precipitate belongs to Al 2 Cu phase, which has been reported in related literature [9, 102]. According to the EDX lines along line 2, the dispersoid along the grain boundary is rich in Cu and Mn, displaying the similar shape and dimension with that in the alloy matrix, which suggests the decoration of Al 20 Cu 2 Mn 3 phase along the grain boundary in the alloy. Clean grain boundary was also found in the AA2024-T351 alloy with a typical example shown in Figure 4.19 (e) with the absence of precipitates and dispersoids along the grain boundary. EDX line-scanning was conducted along the red line in Figure 4.19 (e), revealing the absence of grain boundary segregation with the EDX lines shown in Figure 4.19 (f). However, EDX line-scan analysis performed along some other grain boundaries with no evident precipitate decoration revealed the existence of grain boundary segregations. Among a small fraction of explored grain boundaries in the alloy, the segregation of copper and magnesium was detected. HAADF micrographs of two individual grain boundaries in AA2024-T351 aluminium alloy are shown in Figures 4.19 (g) and (i), with the corresponding EDX lines shown in Figures 4.19 (h) and (j), respectively. Both grain boundaries display no decoration of precipitates or dispersoids, while the EDX line-scanning result indicates the enrichment of Mg and/ or Cu, suggesting the presence of Cu and Mg grain boundary segregation along selective grain boundaries. The grain boundary segregation is widely existed in aluminium alloy and has a significant impact on the corrosion behaviour of aluminium alloys [116, 117] Crystallographic structure and stored energy Crystallographic structure EBSD analysis was performed on a typical region on the alloy surface. A step size of 0.5 µm was applied for mapping and over 90% of the examined area was indexed. Figure 4.20 (a) shows the distribution of crystallographic orientation in Euler s colour, displaying the typical pancake-shaped grains on the surface of the AA2024-T351 alloy. The grain size varies from 3 µm to 64 µm along the rolling direction, whereas the grain size along the orientation vertical to the rolling direction has a relatively small range, 83
84 Chapter 4: Microstructure Characterization of AA2024-T351 and 2A97 Aluminium Alloys from 5 µm to 39 µm, indicating the slight elongation of the grains along the rolling direction. Additionally, the average grain aspect ratio on the alloy surface is around 1.3, which is also consistent with previous conclusion. The grain boundary is characterized in terms of grain boundary misorientation, which is defined as the orientation difference between two neighbouring grains. In the present work, grain boundary with the misorientation larger than 15 is defined as high angle grain boundary (HAGB), whereas grain boundary is classified as low angle grain boundary (LAGB) with the misorientation between 1 and 15. During the EBSD analysis, the orientation of an individual pixel was determined. As an analogy, comparing the orientation between two neighbouring pixels, if the misorientation is higher than 15, then a HAGB exists in the pixel pair. While, if the misorientation is in the range between 1 and 15, the pixel pair indicates the existence of a LAGB. The grain boundary misorientation map of the corresponding area is displayed in Figure 4.20 (b), with yellow and black lines representing high angle grain boundaries and low angle grain boundaries, respectively. It is revealed that most grain boundaries in the region belong to high angle grain boundary while low angle grain boundaries distribute heterogeneously within the grains bounded by HAGBs. To show more details about the distribution of misorientation in the region, the grain boundaries were segmented with selected colour based on their misorientation, as shown in Figure 4.20 (c). It is revealed that the grain boundary misorientation around 45 is preferred. The histogram of grain boundary misorientation distribution in the alloy is shown in Figure 4.20 (d). It is found that the frequency of misorientation increases slowly from 0 to 30 followed by a dramatic increase to 45. After reaching the peak value, the frequency drops rapidly back to zero. It displays a similar trend with that of a completely random orientated grain in face centred cubic (FCC) structure materials [102]. The slight difference is possibly attributed to the cold working to obtain the T351 temper, which may cause slight texture with preferred grain orientation Grain-stored energy The misorientation map in Figure 4.20 (b) reveals the LAGBs, usually with the misorientation around 1-2, randomly distribute within the grains bounded by HAGBs, indicating a sharp misalignment between two neighbouring pixels instead of orientation gradient within the individual grain. To maintain the stability, an individual dislocation 84
85 Chapter 4: Microstructure Characterization of AA2024-T351 and 2A97 Aluminium Alloys would be introduced to compromise the sharp misalignment. Therefore, the population density of LAGBs (i.e. misorientation), which is defined as the number of LAGBs per unit area within one grain, represents the population density of dislocations in the grain. The population density of LAGBs could be represented by grain-stored energy. Following the determination of the misorientation by comparing the orientation between a pixel and its neighbouring pixel during the EBSD analysis, the stored energy of an individual misorientation could be calculated by Read-Shockley equation shown as follows: γ s = γ 0 θ (A ln θ) where θ=b/h, γ 0 =Gb/4π(1-ν), A=1+In(b/2 πr 0 ), G is the shear modulus, ν is poison s ratio, and r 0 is the radius of the dislocation core. The sum of the stored energy from all individual LAGBs within the grain determines the stored energy of the grain, which enables the grain-stored energy map of the region to be generated. Therefore, grainstored energy map, which represents the spatial distribution of grain-stored energy, can alternatively illustrate the distribution of LAGBs, namely the distribution of dislocations in the alloy. The grain reconstruction method is employed to analyse the grain structure and to obtain the grain-stored energy map, using either absolute referencing or relative referencing. To absolute referencing, the misorientation is obtained by comparing orientation between the pixel and the referencing point randomly selected on the map. When the misorientation is lower than the threshold, in the present work 15, the pixel belongs to the same grain with the selected referencing points. If the misorientation is in the range from 1 to 15, then the pixel belongs to the same subgrain of the referencing points. While to relative referencing, the referencing point is defined as the pixel at its adjacent and the misorientation between neighbouring pixels is the crucial factor for the EBSD map reconstruction. To emphasize the misorientation between neighbouring pixels, the relative referencing reconstruction method is used to obtain the grain-stored energy map. Figure 4.20 (e) shows the grain-stored energy map with yellow lines applied to represent the HAGBs, displaying the distribution of grain-stored energy in the corresponding area. The grain-stored energy map is a grey-scale map with the brighter 85
86 Chapter 4: Microstructure Characterization of AA2024-T351 and 2A97 Aluminium Alloys appearance representing the high level of stored energy and darker appearance indicating the low level of stored energy. The variation of stored energy in individual grains in AA2024-T351 aluminium alloy is attributed to the cold working applied to achieve T351 temper. During the cold working process, the different levels of dislocations are introduced to individual grains since grains with different crystallographic orientations tend to be loaded with different shear stress based on the Schmidt factors. The Schmidt factor is determined by the following equation: m = cos(φ) cos (λ) where φ represents the angle between the stress applied to the material and the slip plane and λ represents the angle between the stress and the slip direction. With larger Schmidt factors, the higher shear stress is applied to increase the number of available slip systems, leading to a high level of plastic deformation in the individual grain, which, consequently, increases its population density of dislocations. In contrast, lower population density of dislocations is introduced to the grain with smaller Schmidt factor. The heterogeneous distribution of Schmidt factors is shown in Figure 4.20 (f), accounting for the grain-orientation dependent distribution of dislocations. Interestingly, the distribution of Schmidt factors as shown in Figure 4.20 (f) shows little similarity with the grain-stored energy map (Figure 4.20 (e)) in the region. Complex fabrication history to obtain the sheet of the AA2024-T351 alloy may contribute to the difference. During the fabrication process, the grains tend to rotate to accommodate with the metal flow direction, resulting in the dynamic modification of the orientation. And the distribution of second phase particles also affects the process. For example, the dispersoid along certain grain boundary could pin the grain boundary, retarding further its rotation, which, consequently, leads to a significant impact on the distribution of dislocations in AA2024-T351 aluminium alloy Discussion Multi-phase α-phase particle Al-Cu-Fe-Mn-(Si) constituent intermetallic particles could be present in the form of multi-phase particle clusters with typical shell-core structure in AA2024-T351 86
87 Chapter 4: Microstructure Characterization of AA2024-T351 and 2A97 Aluminium Alloys aluminium alloy (Figure 4.11). For the intermetallic particle cluster, the peripheral region is rich in copper and depleted in silicon whereas the central region is consisted of low-copper-containing phase with high silicon content (Figures ). The multi-phase particle in AA2024 alloy has been widely reported [14-16, 24, 81]. In Campestrini s work, a shell-shaped intermetallic particle resulting from quench delay was observed in the AA2024 alloy. The EDX analysis of the multi-phase particle in AA2024 aluminium alloy revealed that the outer region is rich in Al, Cu and Mg while the inner region is rich in Al, Cu, Fe, Mn and Si. The author claimed the formation of the multi-phase particle is attributed to re-precipitation of magnesium and copper. After the homogenization treatment, the selective dissolution of Al-Cu-Mg particles continued to occur before quenching. Subsequently, copper and magnesium diffused and precipitated in the form of Al-Cu-Mg particles at the interface between the matrix and irregularly shaped Al-Cu-Fe-Mn-Si intermetallic particles, resulting in the formation of multi-phase particles [15, 16]. Fine particles rich in iron were detected within large particles in AA2024 aluminium alloy from 3D characterization [81]. Because of the high melting point of the iron-containing particle, it could survive during the solubilisation and act as a nucleation site for the subsequent development of the intermetallic particle in AA2024 aluminium alloy. Additionally, in AA2099-T8 alloy, multi-phase Al-Fe-Cu-Mn intermetallic particles were also reported [41]. As suggested by the author, the formation of the multi-phase particles is attributed to the diffusion of copper from the high-copper-containing particle to its adjacent alloy matrix. The highcopper-containing particles were formed during the solidification, and in the subsequent thermomechanical process, copper diffused from high-copper-containing area to lowcopper-containing area due to the concentration gradient, resulting in the development of the shell-shaped multi-phase particle with its inner region rich in copper and the outer region depleted in copper. In the present work, the diffusion of copper fails to explain the formation of multi-phase particles in the AA2024-T351 aluminium alloy due to the higher copper content in the outer region instead of the inner region. Therefore, in the present work, the formation mechanism of multi-phase Al-Cu-Fe-Mn intermetallic particle is attributed to the precipitation behaviour at preferred sites. 87
88 Chapter 4: Microstructure Characterization of AA2024-T351 and 2A97 Aluminium Alloys At the early stage of the solidification process, the copper-containing particle with relatively high concentration of Si formed and served as the favourable nucleation site for the further development of intermetallic particles. The combined effect of the low solubility of silicon with respect to that of copper and the limited content of silicon in the AA2024 alloy resulted in the solution around the nucleation site was rich in copper but highly poor in silicon at this stage of the solidification. Therefore, the outer region, formed at the later stage of the solidification around the copper-containing particle, was rich in copper with decreased content of silicon. When the iron and manganese was depleted in the surrounding solution, the development of the intermetallic particle ceased, resulting in the multi-phase Al-Cu-Fe-Mn-(Si) intermetallic particles with heterogeneous distribution of copper and silicon in the AA2024 alloy Dispersoid free zone around intermetallic particle There has been an argument about the existence of dispersoid free zone around the S- phase particle in AA2024-T351 aluminium alloy [17, 18, 173]. In Guillaumin s work, it was revealed that all coarse intermetallic particles are surrounded by dispersoid (Al 20 Mn 3 Cu 2 ) free zones. The formation of copper-containing intermetallic particles (including Al 2 CuMg, Al 2 Cu and Al-Cu-Fe-Mn intermetallic particles) resulted in the copper-depleted zone around the particles, which retarded the formation of Al 20 Mn 3 Cu 2 dispersoid since the development of the copper-containing dispersoids required necessary copper content [18]. However, in the work of Buchheit, EDX line-scanning performed along S-phase particles on the AA2024 alloy surface revealed no copperdepleted zone existed around S-phase intermetallic particles [17]. In the present work, as shown in Figure 4.18, some S-phase particles are surrounded by dispersoid free zones while most S-phase particles show no sign of copper depletion in the periphery. Most of S-phase particles formed during the solidification and failed to dissolute in the subsequent fabrication process, which would not consume copper from the adjacent alloy matrix since the copper solubility is relatively high. Therefore, no copper-depleted zone is developed at the adjacency of the S-phase particle. However, the nucleation and growth of S-phase particles are also possible during the cooling after solution heat treatment. At this stage, the development of S-phase particle consumed the copper form its adjacent alloy matrix, leading to the formation of copper-depleted zone. Therefore, the dispersoid free zone could be developed around S-phase particle in the second conditions. Additionally, the dispersoid-free zone was also developed in the 88
89 Chapter 4: Microstructure Characterization of AA2024-T351 and 2A97 Aluminium Alloys mechanism, as mentioned above, in the periphery of θ-phase intermetallic particles as well as clusters of S-phase and θ-phase particles Grain-stored energy As mentioned above, the population density of dislocations in the individual grain determines its stored energy. And the microstructural evolution of AA2024 aluminium alloy, which affects the dislocation density significantly, controls the distribution of grain-stored energy in the alloy. As the equilibrium structural feature in the aluminium alloy, the as-casting AA2024 aluminium alloy has a relatively low population density of dislocations. The development of dislocations in AA2024 aluminium alloy is affected significantly by its thermomechanical history. First, dislocations were generated during quenching after solution heat treatment. The population density of dislocation was affected by quenching strains as well as the solute concentration, which determined the vacancy concentration. Second, during the cold working involved to achieve T351 temper, plastic deformation was introduced, resulting in the increase of dislocation population density in the alloy. Finally, during the ageing process, a fraction of dislocations disappeared to achieve higher stability. And some dislocations were consumed for the nucleation of certain precipitates. The re-arrangement of the dislocations could also results in the development of subgrain boundaries. After all the fabrication process, the remaining dislocation density determined the grain-stored energy distribution in AA2024-T351 aluminium alloy. In all three major factors during the thermomechanical history, the impacts from the quenching and the ageing display no grain-orientation dependence. Therefore, the heterogeneous distribution of dislocations in the AA2024 aluminium alloy as shown in Figure 4.20, which is significantly affected by grain orientation distribution, is attributed to the cold working prior to natural ageing. It is well-known that cold working introduces plastic deformation to aluminium alloys, significantly increasing the population density of dislocations. For aluminium and its alloy, the generation of dislocation through cold working is highly grain-orientation dependent, especially when subjected to relatively low or intermediate strain, which fits the cold working condition to achieve T351 temper in AA2024 aluminium alloy [174]. Under this condition, the plastic deformation is achieved by dislocation slip, with the 89
90 Chapter 4: Microstructure Characterization of AA2024-T351 and 2A97 Aluminium Alloys plastic deformation level depending on the number of available active slip systems in individual grains. If the orientation of a grain is favourable with large numbers of active slip systems available, geometry changing and rotation is easily achieved during the cold working process. As a result, the population density of dislocations in the grain increases due to the high level of plastic deformation introduced during the cold working process. Meanwhile, the dislocation multiplication and the nucleation of new dislocations further increase the population density of dislocations in the individual grain. Therefore, high level of grain-stored energy can be achieved in selected grains. In contrast, unfavourable orientation results in fewer active slip systems within the individual grain, retarding the plastic deformation. Gradual orientation changing preferentially develops in such grains, resulting in relatively lower population density of dislocations. 4.2 Microstructure of 2A97 aluminium alloys Constituent intermetallic particles Mechanically-polished specimens were examined by SEM along with EDX analysis, revealing the distribution and composition of constituent intermetallic particles in the 2A97 Al-Cu-Li alloys. Figures 4.21 (a)-(d) display backscattered electron micrographs of 2A97 Al-Cu-Li alloys in T3, T4, T6 and T8 tempers, respectively. The bright features of micrometre scale dimensions in the SEM micrographs are intermetallic particles, which are relatively uniformly distributed on the surfaces of 2A97 alloys. The size of the intermetallic particles varies from several microns to tens of microns. Some cavities of micrometre scale dimensions are also evident on the alloy surfaces, which possibly arise from the removal of the intermetallic particles during the mechanical polishing. Figure 4.22 displays typical constituent intermetallic particles in the alloy at increased magnification, revealing that intermetallic particles are present individually or in cluster in the 2A97-T3 alloy. Well-defined sharp interfaces between the alloy matrix and constituent intermetallic particles are displayed in Figures 4.22 (a)-(b), as marked with red arrows, indicating the intermetallic particles were broken into small pieces and redistributed during the fabrication process. The uniform contrast of the intermetallic 90
91 Chapter 4: Microstructure Characterization of AA2024-T351 and 2A97 Aluminium Alloys particles in the backscattered electron micrograph suggests similar composition of these particles. The cluster of constituent intermetallic particles with relatively round shapes is displayed in Figures 4.22 (c)-(d). The brightness in the backscattered electron micrographs represents the average atomic number of the region. As a result, the contrast in the backscattered electron micrographs (Figures 4.22 (c)-(d)) reveals the heterogeneous distribution of the alloying elements within the intermetallic particle cluster. The shapes and the heterogeneous distribution of alloy elements are crucial to understand the formation of intermetallic particle clusters, which is elucidated in the discussion section. EDX analysis was employed to investigate the composition of constituent intermetallic particles in the alloy. Typical EDX spectra are displayed in Figures 4.22 (e)-(f), indicating the presence of Al, Fe, Mn and Cu in the intermetallic particles, which is similar with that in α-phase particles (Al-Cu-Fe-Mn particles) in the AA2024 alloy. Small amount of Ag was also detected as shown in Figure 4.22 (e), which is possibly due to the large interaction volume between the electron beam and the specimen during the EDX analysis, allowing the detection of Ag from the alloy matrix in the periphery of the intermetallic particle, especially when the dimension of the particle is small. EDX mapping was performed on the typical intermetallic particle clusters, as shown in Figures 4.23 (a) and (c), respectively. The heterogeneous distribution of alloying elements, differentiated by the relative brightness, is displayed in the backscattered electron micrographs. To the intermetallic particle in Figure 4.23 (a), alloying elements such as Ag, Zn and Mg in addition to Al, Fe, Mn and Cu were revealed in the EDX maps shown in Figure 4.23(b), which is consistent with the EDX spectra (Figures 4.22 (e)-(f)). According to the EDX maps of Al, Ag and Mg, it is revealed that lower contents of those elements in the intermetallic particle with respect to those in the alloy matrix. As revealed in Cu, Fe and Zn maps, the concentrations of these alloying elements are constant in the intermetallic particle. Mn map indicates the evidently heterogeneous distribution of Mn in the intermetallic particle, which is considered to be responsible for the contrast within the particle in the backscattered electron micrograph (Figure 4.23 (a)). 91
92 Chapter 4: Microstructure Characterization of AA2024-T351 and 2A97 Aluminium Alloys The same analysis was also conducted on the intermetallic particle cluster in Figure 4.23 (c) with the corresponding EDX maps shown in Figure 4.23 (d). The distribution of alloying elements in intermetallic particle cluster is in good agreement with that in Figure 4.23 (a), displaying the similar alloying elements distribution in the intermetallic particle cluster on the surface of 2A97-T3 alloy. Two types of intermetallic particles are revealed in the 2A97-T4 alloy, including the individual intermetallic particle and the intermetallic particle cluster with typical examples shown in Figures 4.24 (a)-(d). The intermetallic particle broke into small particles, leading to the development of relatively sharp interfaces between the alloy matrix and the intermetallic particle during the fabrication process. The uniform contrast in the backscattered electron micrographs (Figures 4.24 (a)-(b)) indicates the uniform distribution of alloying elements in the individual intermetallic particles. Figures 4.24 (c)-(d) display the typical intermetallic particle clusters on the surface of 2A97-T4 alloy. The heterogeneous distribution of alloying elements in the intermetallic particle cluster is distinguishable, with evident brightness difference in the backscattered electron micrographs (Figures 4.24 (c)-(d)). EDX analysis was conducted on the intermetallic particles with typical EDX spectra shown in Figures 4.24 (e)-(f), suggesting the existence of Al, Fe, Mn and Cu elements in the intermetallic particles. The peaks corresponding to Ag and Ba alloying elements were also revealed in the EDX spectra, which possibly arises from the large interaction volume between the electron beam and the specimen due to the application of the electron beam at 15 kv accelerating voltage during the EDX analysis. EDX mapping was also performed on the intermetallic particle clusters as shown in Figures 4.24 (c) and (d), with the corresponding results shown in Figure Figure 4.25 (a) displays the EDX maps of the intermetallic particle cluster in Figure 4.24 (c), revealing the distribution of Ag, Ba, Mg and Zn in addition to Al, Fe, Mn and Cu. The maps of Cu and Fe indicate the uniform distributions of those alloying elements across the intermetallic particle cluster, regardless of the Mn content. The Mn map displays the increased Mn content of selective areas in the intermetallic particle cluster, corresponding to the relatively dark regions in the BSE micrograph. Therefore, the heterogeneous distribution of Mn in the intermetallic particle cluster contributes to the contrast of the intermetallic particle cluster in the backscattered electron micrograph. 92
93 Chapter 4: Microstructure Characterization of AA2024-T351 and 2A97 Aluminium Alloys According to the Mg and Ag maps, there is basically no Mg and Ag in the intermetallic particles. While, the Ba map is generally featureless, indicating that alloying element Ba uniformly distributes in the intermetallic particles and the alloy matrix, even though two Ba-rich particles are revealed, as marked with red arrows, in the Ba map. Interestingly, Zn, which was not detected in EDX spot analysis, was revealed in the EDX mapping. The map of Zn indicates slight enrichment of Zn in the intermetallic particle due to the higher brightness in the regions of particles than that of the alloy matrix. The same EDX analysis was repeated on the intermetallic particle cluster in Figure 4.24 (d) with the corresponding result shown in Figure 4.25 (b). The distribution of alloying elements in the intermetallic particles is consistent with that shown in Figure 4.25 (b), suggesting the similar alloying element distribution in the constituent intermetallic particles in T4 alloy. In the 2A97-T6 and 2A97-T8 aluminium alloys, constituent intermetallic particles are also classified into two types, namely, intermetallic particles that may break into pieces during the subsequent fabrication process and intermetallic particles clusters that consist of intermetallic particles with relatively small dimensions. Figures 4.26 (a)-(b) and Figures 4.28 (a)-(b) display the typical intermetallic particles and intermetallic particle clusters in 2A97-T6 and 2A97-T8 alloys, respectively, displaying the similar morphologies with those in the alloys under T3 and T4 tempers. Typical EDX spectra in 2A97-T6 alloy are shown in Figures 4.26 (c)-(d), revealing yields from alloying elements of Ca, Ba, Ag and Zn in addition to Al, Fe, Mn and Cu in the intermetallic particle. EDX mapping was performed on the typical intermetallic particle cluster in Figure 4.26 (b) with the corresponding EDX maps shown in Figure 4.27(a), revealing that the intermetallic particle cluster has increased contents of Cu, Fe and Mn with respect to the alloy matrix. It is also revealed that slight enrichment of Ca and Zn along with the depletion of Ag and Mg in the intermetallic particle. It is believed that the heterogeneous distribution of Mn in the intermetallic particle cluster contributes to the different brightness of the intermetallic particle cluster in the backscattered electron micrograph as shown in Figure 4.26 (b). The analysis was repeated on the intermetallic particle cluster in Figure 4.27 (b), with the corresponding EDX maps of intermetallic particles shown in Figure 4.27 (c). Elements, such as Zn, Ag and Mg in addition to Al, Fe Cu and Mn, were detected 93
94 Chapter 4: Microstructure Characterization of AA2024-T351 and 2A97 Aluminium Alloys during the EDX mapping. According to the corresponding EDX maps, the alloying elements distribution in the intermetallic particle cluster is similar with that shown in Figure 4.27 (a). Significant enrichment of Cu, Fe and unevenly-distributed Mn are evident in the intermetallic particle cluster. Slight enrichment of Zn along with the depletion of Ag is also consistent with that shown in Figure 4.27 (a). However, in contrast to the heterogeneous distribution of Ca between the intermetallic particles and the alloy matrix, as shown Figure 4.27 (a), the similar contents of Ca is revealed between the intermetallic particle cluster and the alloy matrix, since the Ca map is featureless. The difference indicates the composition variation in the intermetallic particles in Al-Cu-Li alloys. Interestingly, Ba, which was detected in EDX spot analysis, was not revealed during the EDX mapping. The difference is likely to be attributed to the dwell time difference for each pixel. Generally, the dwell time for a pixel during the EDX mapping is much less than that for EDX spot analysis, thereby, Ba, as a trace element in the alloy was not detected during the EDX mapping since not enough X-rays were collected. Typical EDX spectra in the 2A97-T8 alloy are shown in Figures 4.28 (c)-(d), displaying the alloying elements of Ag, Mg, and Zn in addition to Cu, Fe, Mn and Al in the intermetallic particle. The EDX mapping performed on the intermetallic particles in Figures 4.28 (a)-(b) further examines the distribution of alloying elements in the intermetallic particles on the surface of 2A97-T8 alloy. EDX maps of the intermetallic particle in Figure 4.28 (a) are shown in Figure 4.29 (a), exhibiting the distribution of Al, Ag, Cu, Mg,Mn, Fe and Zn in the examined region, which is in agreement with the EDX point analysis (Figures 4.28(c)-(d)). According to the maps of Cu, Fe, Mn and Zn, it is suggested that the increased yields of those alloying elements are present in the particles. The relatively lower contents of Ag, Mg and Al in the intermetallic particle relative to that of the alloy matrix are obviously displayed in corresponding EDX maps. In contrast to the heterogeneously distributed Mn in the intermetallic particles cluster, the distribution of Mn is uniform in the intermetallic particles, corresponding to the uniform contrast of the particles in the backscattered electron micrograph, as shown in Figure 4.28 (a). EDX mapping was also conducted on the intermetallic particle cluster (Figure 4.28 (b)) with the corresponding maps displayed in Figure 4.29 (b). The heterogeneous 94
95 Chapter 4: Microstructure Characterization of AA2024-T351 and 2A97 Aluminium Alloys distribution of Mn in the intermetallic particle cluster is evident as shown in the Mn map, with the Mn-rich region corresponding to the area with dark appearance in the BSE micrograph. Besides, the distribution of other alloying elements in the intermetallic particle cluster is consistent with that in Figure 4.29 (a), with relatively lower contents of Al, Ag and Mg and higher contents of Mn, Fe, Zn and Cu in the intermetallic particle cluster relative to those in the alloy matrix. In summary, intermetallic particles on the surfaces of the 2A97 alloys are mainly composed of Al, Cu, Fe and Mn evident along with some trace alloying elements, i.e. Ag, Zn, Ba and Ca. It is worth mentioning that lithium is undetectable during the EDX analysis. The presence of Li in the intermetallic particles has been reported in related literature [175], indicating the possible existence of Li in the intermetallic particles. The composition variation in the intermetallic particles is evident, differentiated by the contrast in the BSE micrographs. Two existence forms of intermetallic particles are evident, i.e. individual intermetallic particles as well as intermetallic particle clusters. EDX mapping on the intermetallic particle cluster indicates the heterogeneous distribution of Mn in the intermetallic particle cluster is responsible for brightness difference in the corresponding backscattered electron micrograph Crystallographic structure The crystallographic structure of 2A97 Al-Cu-Li alloys displays significant difference as a consequence of the different thermomechanical histories. Extra cold working was applied to 2A97 alloys to achieve T3 and T8 tempers in contrast to the absence of cold working for 2A97-T4 and 2A97-T6 alloys prior to ageing. Backscattered electron micrographs of the surfaces of electropolished 2A97 alloys in various tempers are shown in Figures 4.30 (a)-(d). Bright features with dimensions ranging from several micrometres to tens of micrometres are shown, corresponding to the intermetallic particles as revealed by EDX analysis. Cavities of micrometre scale dimensions are also evident, displaying the similar dimension with that of intermetallic particles. It is believed that cavities were generated due to the removal of intermetallic particles since the selective dissolution of the alloy matrix occurred in the periphery of the particles during the electropolishing. 95
96 Chapter 4: Microstructure Characterization of AA2024-T351 and 2A97 Aluminium Alloys Additionally, the grain structure of the alloys is displayed with evident channelling contrast between the individual grains and subgrains of different orientations. The similar grain structure between the alloys in T3 and T8 tempers is noticed as shown in Figures 4.30 (a) and (d). The grain size varies significantly, ranging from several micrometres to over a hundred micrometres. Figures 4.30 (b) and (d) reveals the grain structure in the 2A97-T4 and 2A97-T6 alloys, displaying the similar grain size distribution of 2A97 alloys in T4 and T6 tempers, due to the absence of cold working in the corresponding thermomechanical process to obtain both tempers. The average grain size in the alloys of T4 and T6 tempers is distributed uniformly with respect to that in T3 and T8 alloys, ranging from tens of micrometres to hundreds of micrometres. EBSD analysis was performed on typical regions to reveal the crystallographic structure of 2A97 alloys. A step size of 0.5 µm was used for 2A97-T3 and 2A97-T8 alloys since the grains have the wide range of the dimensions, whereas a step size of 1 µm was applied for 2A97-T4 and 2A97-T6 alloys since alloys in T4 and T6 tempers have relatively uniform grain size distribution. Over 90% of the examined area was indexed during the EBSD scanning. A typical area with the dimension of 500 µm 250 µm on the surface of T3 alloy was examined with EBSD analysis. Figure 4.31 (a) exhibits the IPFZ map to reveal the crystallographic orientation distribution on the 2A97-T3 alloy surface. The IPFZ map indicates a texture was generated during the fabrication process since green colour covers over 80% areas, indicating the crystallographic planes with the orientation close to {011} were preferentially developed. Figure 4.31 (b) shows the misorientation map of the corresponding area, where the high angle grain boundary (HAGB, with grain boundary misorientation larger than 15 ) is shown with the black line and low angle grain boundary is exhibited (LAGB, with grain boundary misorientation between 1 and 15 ) with the grey line. Two types of grains are displayed, i.e. the larger coarse grains and the recrystallized fine grains. Within the coarse grains, numbers of fine and approximately equiaxed subgrains are displayed. And the grain size distribution is in good agreement with that shown in Figure 4.30 (a). The grain boundary misorientation distribution is shown as a histogram in Figure 4.31 (c), exhibiting higher population density of HAGBs than that of LAGBs. The lengths of columns decrease dramatically from 0 to 30, reaching the minimum around 35, then show a significant increase to maximum around 55 and drop back to zero rapidly. The trend, as shown in Figure
97 Chapter 4: Microstructure Characterization of AA2024-T351 and 2A97 Aluminium Alloys (c), displays the significant difference with theoretical grain boundary misorientation distribution in a completely randomly oriented set of grains for FCC structure [102]. The difference can be attributed to the cold working to achieve T3 temper in the 2A97 alloy. The distribution of grain-stored energy of the corresponding area is displayed in Figure 4.31 (d), representing the distribution of dislocations and LAGBs. Higher brightness represents increased grain-stored energy in contrast to the grain with relatively low stored energy displaying a relatively dark appearance. The reconstruction of the grain-stored energy map will be illustrated in the discussion session. A typical area with the dimension of 250 µm 500 µm on the alloy surface of 2A97-T8 alloy was examined using EBSD with the corresponding results displayed in Figures 4.32 (a)-(c). Figure 4.32 (a) displays the IPFZ map of the examined area, revealing the distribution of crystallographic orientation on the surface of 2A97-T8 aluminium alloy. It is revealed that green colour still accounts for over 60% surface area, indicating the generation of the texture with the dominant orientation of the crystallographic planes close to {011}. Figure 4.32 (b) exhibits the distribution of misorientation in the area, with black lines and grey lines representing HAGBs and LAGBs, respectively. Two types of coarse grains of similar dimensions with and without subgrains due to partial recovery are revealed. The grain size dimension distribution in Figure 4.32 (b) is consistent with that in Figure 4.30 (d). The grain boundary misorientation distribution is displayed as a histogram, as shown in Figure 4.32 (c), exhibiting its significant difference with the theoretical tendency. It is believed that cold working during the fabrication process contributes to the deviation of the grain boundary misorientation distribution from the theoretical one in FCC structure crystal. During the cold working process, plastic deformation are introduced to aluminium alloys, resulting in the increased amount of dislocations within the individual grain based on its crystallographic orientation. Since grains with favourable orientations tend to be loaded with higher shear stress, higher population density of dislocations could be expected in such grains. The re-arrangement of introduced dislocations can form subgrain boundaries during the subsequent fabrication process to obtain the 2A97-T8 alloy. The distribution of grain-stored energy of the corresponding area in T8 alloy is displayed in Figure 4.32 (d), exhibiting the heterogeneous distribution of grain-stored energy in the alloy. 97
98 Chapter 4: Microstructure Characterization of AA2024-T351 and 2A97 Aluminium Alloys Due to the relative large grain size, the step size for the EBSD scanning was adjusted to 1 µm for the crystallographic orientation characterization in the 2A97-T4 alloy with a large area analysed (1000 µm 500 µm). Figure 4.33 (a) exhibits IPFZ map of the corresponding area, revealing the crystallographic orientation distribution in the 2A97- T4 alloy with orientation-related colours. The distribution of crystallographic orientation is quite uniform with no preferential colour, indicating the absence of texture during the thermomechanical process to obtain T4 temper. The grain size distribution, as shown in Figure 4.33 (a), is consistent with that shown in Figure 4.30 (b). The misorientation map of the corresponding area is shown in Figure 4.33 (b), with black lines and grey lines applied to represent HAGBs and LAGBs, respectively. The large and approximately equiaxed grains are dominant, with little evidence of fine recrystallized subgrain revealed. The histogram of grain boundary misorientation distribution is shown in Figure 4.33 (c). It is revealed that in the 2A97-T4 alloy, most grain boundaries have the misorientation larger than 15. The frequency increases from 0 to 40, and reaches the maximum around 45, following with a rapid decrease to zero. The distribution of grain boundary misorientation is in a similar tendency with that under the theoretical condition, revealing the little texture was generated in the T4 alloy during the thermomechanical process. The distribution of grain-stored energy of the corresponding area is shown in Figure 4.33 (d). The grain-stored energy map is a greyscale map, with higher stored energy displaying high brightness. Similar EBSD analysis was repeated in a typical region of the 2A97-T6 alloy with the result shown in Figure Figure 4.34 (a) exhibits IPFZ map of the corresponding area in the 2A97-T6 alloy, displaying the crystallographic orientation distribution in the alloy with orientation-related colours. The grain size distribution, as shown in Figure 4.34 (a), is in good agreement with that shown in Figure 4.30 (c). No preferential orientation is found with the relatively uniform distribution of crystallographic orientations on the alloy surface, indicating the absence of texture in the 2A97-T6 alloy. The misorientation maps along with the histogram exhibiting the distribution of grain boundary misorientation are shown in Figures 4.34 (b)-(c), respectively. As expected, most grain boundary has misorientation larger than 15, and the tendency is similar with the theoretical one, confirming the presence of little texture in the 2A97-T6 alloy. The distribution of grain-stored energy of the corresponding area in the 2A97-T6 alloy is also displayed in a grey-scale map, as shown in Figure 4.34 (d). 98
99 Chapter 4: Microstructure Characterization of AA2024-T351 and 2A97 Aluminium Alloys Dispersoids High angle annular dark field (HAADF) micrographs of twin-jet electropolished foils of the alloys are displayed in Figures 4.35 (a)-(d). Bright features with dimensions ranging from tens of nanometres to hundreds of nanometres are displayed, revealing the distribution of dispersoids in Al-Cu-Li alloys. Rectangular dispersoids and roundshaped dispersoids are distributed randomly in the alloy matrix. The dimension of the rectangular dispersoid is around nm length and 200 nm width, while the diameter of the round-shaped dispersoid is around 200 nm, corresponding to the long and short transverse faces of a rod-like shape. EDX analysis, as shown in Figure 4.35 (e), indicates the similar composition of dispersoids in two different shapes, with the presence of Al, Cu and Mn. It has been suggested that the dispersoid belongs to Al 20 Cu 2 Mn 3 phase, which is popular in Al-Cu-Mg-(Li) alloys [9]. Since the lithium is undetectable by EDX analysis, the existence of lithium in the dispersoids is unclear. It has been reported in related literatures of AA2099 Al-Cu-Li alloy, revealing that rodlike dispersoid is rich in lithium as well as aluminium, copper and magnesium [176]. Since the dimension and shape of the dispersoids in the AA2099 alloy are similar with that of in the 2A97 alloys, it is likely that the dispersoids are also lithium rich in the present study. As mentioned in the literature review, the dispersoids in aluminium alloys are formed by solid-solid reaction during the homogenization process [9]. Due to the low solubility of the main dispersoid forming elements, the subsequent ageing process has limited influence on the composition of dispersoids in the alloy. However, the cold working prior the ageing may affect the preferred orientation of dispersoids. With cold working applied to the 2A97 aluminium alloy, the long axis of the dispersoid could adjust and became preferentially aligned with the metal flow direction, which also led to the rectangular shapes as the dominant shapes of dispersoids in T3 and T8 alloys (Figures 4.35 (a) and (d)). On the contrary, the absence of cold working during the fabrication process resulted in the randomly oriented dispersoids and, consequently, a relatively higher population density of round-shaped dispersoids in the matrix of T4 and T6 alloys (Figures 4.35 (b)-(c)) with respect to that in T3 and T8 alloys. Therefore, the observation of rectangular dispersoids originated from the rod-shaped dispersoids with its long axis parallel to TEM specimen, while the axis of spherical dispersoid failed to 99
100 Chapter 4: Microstructure Characterization of AA2024-T351 and 2A97 Aluminium Alloys be adjusted to the preferred direction during the fabrication process, leaving the round cross section on the alloy surface parallel to TEM specimen. Scrutiny of HAADF micrographs in Figure 4.35 reveals the existence of spherical dispersoids with the dimensions of tens of nanometres, as indicates with red arrows. EDX analysis of the spherical dispersoids of nanometre scale dimensions indicates high content of zirconium in the sphere, indicating the presence of Al 3 Zr phase in the Al-Cu- Li alloys (Figure 4.35 (f)). The presence of Al 3 Zr phase dispersoids is widely observed in zirconium containing Al-Cu-Li alloys [62] The distribution of precipitates As a precipitate- strengthening aluminium alloy, the precipitates evolution in Al-Cu-Li alloys is closely linked to its thermomechanical history [58, 63]. It has been reported that the main strengthening precipitates in 2A97 Al-Cu-Li alloys is T 1 phase precipitates (Al 2 CuLi) [49, 177]. The distribution of T 1 phase precipitates significantly affects the performance of the alloy, especially the corrosion behaviour of 2A97 Al-Cu-Li alloys. Ultra-high resolution SEM micrograph of the electropolished 2A97-T3 alloy (as shown in Figure 4.36 (a)) exhibits the needle-shaped precipitates with the dimension ranging from 400 nm to 1.8 µm, which are randomly distributed in the matrix as well as along selective grain boundary. The needle-shaped precipitate with the similar dimension with that in the SEM micrograph is also displayed in the HAADF micrograph as shown in Figure 4.36 (b) (marked with the white arrow). EDX analysis of the needle-shaped precipitate indicates its increased yield of Cu. The dimension is in the same order of magnitude as the dimension of T B phase (Al 7 Cu 4 Li) in Al-Cu-Li alloys [163], consequently suggesting the existence of T B phase precipitates in T3 alloy. Besides the needle-shaped precipitates of micrometre scale dimensions, a range of configurations of grain boundary precipitates is revealed in the HAADF micrograph, as shown in Figure 4.36 (b), where the high brightness origins from the high atomic number. The bright bands, as indicated with red arrows, indicate the second phase continuous film decorating the selective grain boundaries. The continuous film is suggested to be either the overlapping of the high population density of grain boundary precipitates or grain boundary segregation. The grain boundary with the absence of precipitates is also found, exhibiting similar brightness with that of the alloy matrix. 100
101 Chapter 4: Microstructure Characterization of AA2024-T351 and 2A97 Aluminium Alloys Figures 4.36 (c)-(d) exhibit the selective grain boundaries decorated by continuous films at increased magnification, revealing that the high population density of needle-shaped precipitates along the grain boundary. Scrutiny of Figures 4.36 (c)-(d) reveals the needle-shaped precipitates with dimensions ranging from 50 nm to 200 nm developed along the preferred orientation, which is in good agreement with the typical morphologies and dimensions of T 1 phase precipitates along the grain boundary in Al- Cu-Li alloys [122, 163]. Little evidence of needle-shaped precipitates with the same order of dimensions is revealed in the alloy matrix as shown in Figure 4.36, suggesting the absence of T 1 phase precipitates in T3 alloy matrix. The distribution of precipitates in the 2A97-T4 alloy is revealed in the ultra-high resolution SEM micrographs in Figures 4.37 (a)-(b). Figure 4.37 (a) exhibits selected grain boundary pinned by an intermetallic particle, displaying a continuous precipitates film decorating the grain boundary A-A and a relatively clean grain boundary B-B. Figure 4.37 (b) displays the grain boundary A-A at increased magnification, suggesting the continuous film is consisted of high population density of needle-shaped precipitates along certain orientation. Since the dimension of the needle-shaped precipitate is consistent with that of grain boundary T 1 phase precipitate as mentioned above, it is believed that selected grain boundary in T4 alloy is decorated with T 1 phase precipitates. Additionally, scrutiny of SEM micrographs indicates lower population density of T 1 phase precipitates in the matrix of T4 alloy with respect to that along the grain boundary. As shown in Figures 4.37 (c)-(d), TEM micrographs of the twin-jet electropolished 2A97-T4 alloy foil display the similar precipitates distribution features with that in SEM micrographs. Occasionally, relatively large precipitates and dispersoids are also found along the grain boundary in T4 alloy. As shown in Figure 4.37 (a), along B-B grain boundary, a large precipitate is elongated along the grain boundary, indicating a dependence of its growth on the grain boundary. Dispersoids, as indicated with red arrows in Figure 4.37 (c), are also revealed along the grain boundary in the alloy. HAADF micrographs, as shown in Figure 4.38, show the distribution of precipitates in the matrix of 2A97-T4 alloy. It is revealed that spherical precipitates (which is believed to be Al 3 Li phase [41]) with the dimensions around tens of nanometres are popular with a relatively uniform distribution in the matrix on contrary to low population density of the matrix needle-shaped precipitates. As shown in Figures 4.38 (a)-(b), the distribution of needle-shaped precipitates is evidently heterogeneous with different configurations. 101
102 Chapter 4: Microstructure Characterization of AA2024-T351 and 2A97 Aluminium Alloys As revealed in Figure 4.38 (a), needle-shaped precipitates of micrometre scale dimensions distribute in the periphery of the grain boundary within grain A whereas no such precipitates was observed in grain B. Figure 4.38 (b) show another example of the heterogeneous distribution of needle-shaped precipitates with the dimensions around hundreds of nanometres. It is noticed that higher population density of needle-shaped precipitates exist in grain C (as indicated with red arrows) in contrast to the absence of matrix needle-shaped precipitates in grain D. The dimension of needle-shaped precipitates in T4 alloy is comparable with typical T 1 /θ phase precipitates. What s more, the work of Gable suggested that θ phase precipitates are preferentially formed when the pre-ageing cold work is absent [46], indicating the preferential precipitation of θ phase in grain C rather than the neighbouring grain D. Two types of distinctive features, i.e. continuous precipitates film along the grain boundary and banding structure within the grain (the framed area), are revealed in Figure 4.38 (c). Figure 4.38 (d) displays the framed area at increased magnification, indicating the banding structure is comprised of high concentration of precipitates along certain orientation. It is found that the in selected region within the individual grain, needle-shaped precipitates with the dimension around 100 nm developed along the preferred orientation, resulting in the band with dense needle-shaped precipitates. Therefore, banding structure with higher population density of precipitates (supposedly T 1 /θ phase precipitates due to the dimensions) relative to the adjacent alloy matrix exists within selective grain interior in the 2A97- T4 alloy. On the contrary to 2A97 alloys in T3 and T4 tempers with needle-shaped precipitates mainly distributing along grain boundary network, high population density of needleshaped precipitates are evident in the matrix of the 2A97-T6 alloy as shown in Figure A bright field TEM micrograph and an HAADF micrograph of the alloy matrix are displayed in Figures 4.39 (a)-(b), revealing the dense needle-shaped precipitates in the matrix of T6 alloy. Apparently, two types of needle-shaped precipitates are revealed with different orientations and dimensions, which are supposed to be T 1 phase and θ phase precipitates, respectively. It has been revealed that T 1 phase precipitates develop on {111} planes while θ phase preferentially precipitates on {001} planes in the alloy matrix [41, 46, 50]. High resolution TEM micrograph of the relatively large needleshaped precipitates was obtained as shown in Figure 4.39 (c), with the corresponding FFT result inset. It is revealed that the needle-shaped precipitates with large dimensions 102
103 Chapter 4: Microstructure Characterization of AA2024-T351 and 2A97 Aluminium Alloys developed along {111} planes in the alloy matrix, suggesting that the T 1 phase precipitate has a relatively larger dimension than θ phase precipitates in T6 alloy matrix. Therefore, the needle-shaped precipitates with the dimension around 250 nm belongs tot 1 phase whereas those with typical dimensions around 50 nm are θ phase precipitates. Banding structure along certain orientation was also found in the 2A97-T6 alloy as shown in Figure 4.39 (d), in addition to the high population density of needle-shaped precipitates in the alloy matrix. Since the contrast in the HAADF micrograph arises from the atomic number difference, the banding structure is likely to be consisted of higher population density of precipitates with respect to that in the alloy matrix. A range of population densities and configurations of grain boundary precipitates are revealed in the HAADF micrograph (Figure 4.40 (a)). Occasionally, coarse second phase particles are evident along selective grain boundaries, as marked with red arrows, as shown in Figure 4.40 (a). Typical grain boundary area is displayed in Figure 4.40 (b), revealing the precipitate free zone developed immediately adjacent to the grain boundary in 2A97-T6 alloy. High population density of precipitates along with coarse second phase particles are also evident along the grain boundary, as indicated with red arrows in Figure 4.40 (b), which may consume the solute elements and consequently result in the development of precipitate free zone along the grain boundary. The precipitates free zone in the grain boundary area, in addition to the high population density of precipitates in the alloy matrix as well as along the grain boundary, is displayed in the ultra-high resolution SEM micrographs, as shown in Figures 4.40 (c)- (d), which exhibit the similar distribution features with that in Figure 4.40 (b). As shown in Figure 4.41(a), a high population density of needle-shaped precipitates is displayed both in the grain interior and along grain boundary in the 2A97-T8 alloy. The needle-shaped precipitates in the matrix of T8 alloy are comparable with those in the matrix of T6 alloy, displaying two distinctive dimensions and orientations. High resolution TEM micrograph of needle-shaped precipitates with the relatively larger dimension was obtained with the lattice image shown in Figure 4.40 (b). FFT (fast Fourier transformation) analysis suggests that the orientation of the large needle-shaped precipitate is parallel with {111} planes, indicating that T 1 phase precipitate has a relatively larger dimension with respect to that of θ phase precipitates. Therefore, in the 103
104 Chapter 4: Microstructure Characterization of AA2024-T351 and 2A97 Aluminium Alloys alloy matrix, high population density of T 1 phase precipitates with the typical dimensions of 100 nm and θ phase precipitates with the dimensions around 50 nm are present in the alloy matrix. A range of configurations of grain boundary decoration is displayed in Figure 4.41 (c). Along grain boundaries A-A and B-B, the grain boundary precipitates are present as fine and continuous films. Besides, dispersoids, which pins the grain boundary B-B, and relatively large precipitates decorating the grain boundary C-C were observed, as indicated with red arrows in Figure 4.41 (c). The appearance of grain boundary precipitates is highly sensitive to the orientation relationship between the electron beams and the grain boundary planes in the TEM specimen. Therefore, the morphology of grain boundary precipitates can be verified by comparing the morphologies of the precipitates on the same boundary before and after tilting the TEM specimens. Figures 4.41 (d)-(e) display the grain boundary precipitates of the identical location with different tilting angles. In Figure 4.41 (d), a continuous precipitate film is displayed. On the contrary, individual needle-shaped precipitates were detected in the same grain boundary area after tilting the TEM specimen, as shown in Figure 4.41 (e) at increased magnifications, suggesting the appearance of continuous precipitates film arises from the overlapping of high population density of needleshaped precipitates. It is worth mentioning that due to the thermomechanical history to obtain T8 temper, needle-shaped precipitates along grain boundaries are always T 1 phase precipitates as suggested in related literatures [122, 163]. As shown in Figures 4.41 (a) and (e), needle-shaped precipitates display the similar dimension with the typical grain boundary T 1 phase precipitate, suggesting the high population density of T 1 phase precipitates along the grain boundaries in the 2A97-T8 alloy. Typical configurations of grain boundary precipitates are also shown in the HAADF micrograph (Figure 4.41 (f)), displaying a triple junction of grain boundaries. Along grain boundaries D-D and E-E, high population density of T 1 phase precipitates with the dimensions around 100nm is shown whereas the grain boundary F-F is decorated with a continuous precipitate film, which is likely to the result of the overlapping of high population density of T 1 phase precipitates Discussion 104
105 Chapter 4: Microstructure Characterization of AA2024-T351 and 2A97 Aluminium Alloys The formation of intermetallic particles It has been suggested in previous literature that the constituent intermetallic particle is generated from the liquid-solid eutectic reaction during solidification and remains stable in the subsequent thermomechanical process due to its relatively high melting point [9]. As mentioned above, in the 2A97 Al-Cu-Li alloys, the intermetallic particles are present individually as single-phase intermetallic particles or together as an intermetallic particle cluster (Figures 4.22, 4.24, 4.26 and 4.28). Multi-phase intermetallic particle clusters have been widely observed in Al-Cu-Li/Mg alloys [15, 16, 41, 81]. In the present study, the formation of multi-phase intermetallic particle clusters is attributed to the high population density of nucleation events during the first stage of solidification. At the early stage of solidification, the nucleus rich in Mn was generated. Due to the high melting point of Mn, the nucleus rich in Mn first occurred and remained stable, which could develop further. The low diffusion rate along with the low concentration of Mn (comparing with Cu and Fe) indicates that Mn would become depleted in the melt first, which limited the Mn content of the later-developed part of intermetallic particles. The development of individual intermetallic particles ceased rapidly when contacting with each other due to the relatively high population density of nucleus. As a result, intermetallic particle cluster consisted of numbers of small individual intermetallic particles were developed with heterogeneously distributed Mn across the cluster during the early stage of solidification. Due to the consumption of solution at the first stage, the decreased number of the available nucleus was present at the later stage. The growth of the individual intermetallic particles could proceed until the melt solution was depleted, which could develop the individual intermetallic particle in the alloys. The development of individual intermetallic particles was relatively slow, providing enough time for the transportation of Mn and, consequently, developing the particles with uniform distribution of Mn. As revealed in the result (Figures 4.22, 4.24, 4.26 and 4.28), individual intermetallic particles could be bounded by well-defined fracture interfaces. It is believed that the large intermetallic particles were broken into smaller particles, which could be redistributed during the subsequent fabrication process with the typical micrograph shown in Figure The matching geometries of the fracture interfaces of the neighbouring 105
106 Chapter 4: Microstructure Characterization of AA2024-T351 and 2A97 Aluminium Alloys particles provide solid evidence for the formation mechanism as mentioned above. EDX analysis suggests the little composition variation in the small intermetallic particles, which were originally from the fracture of the same large intermetallic particle developed in the solidification. The little composition variation also confirms that the thermomechanical processing has little influence on the composition of the intermetallic particles. The cold working also broke the intermetallic particle cluster in Al-Cu-Li alloys during the fabrication process. However, the fracture preferentially occurred at the boundary between individual intermetallic particles without generation the well-defined fracture planes. Also, the subsequent thermal treatment may contribute to the re-distribution of Mn through the intermetallic particle cluster, but unable to eliminate the heterogeneous distribution of Mn in the multi-phase intermetallic particle cluster due to its relatively low temperature comparing with the melting points of the intermetallic particles. Therefore, the intermetallic particle cluster in the 2A97 alloys has a heterogeneous distribution of Mn as shown in Figures 4.23, 4.25, 4.27 and T 1 phase precipitates distribution As the main strengthening precipitate in the 2A97 Al-Cu-Li alloys, the distribution of T 1 phase precipitates attracts great attention. It was revealed that the formation of T 1 phase precipitates is closely associated with the thermomechanical history of the Al-Cu- Li alloy. The two major factors contributing to the difference are the presence of preageing cold working and the subsequent ageing process [44-46, 122]. Different thermomechanical treatments resulted in significant difference of the distribution of T 1 phase precipitates in the 2A97 Al-Cu-Li alloys. As revealed in the Figures , it is evident that the 2A97 alloys in T6 and T8 tempers are characterized with high population density of T 1 phase precipitates in the alloy matrix in contrast to the absence of matrix T 1 phase precipitates in the T3 and T4 conditions. Artificial ageing provides the necessary temperature, thereby, precipitation energy, which significantly promotes the T 1 phase precipitation at the preferential sites (i.e. dislocations and low angle grain boundaries). The observation of Al-Cu-Li alloys with various ageing time has revealed that the population density of T 1 phase precipitates in the alloy matrix increase with the increase in the ageing time and ageing temperature [50-52, 122, 163]. 106
107 Chapter 4: Microstructure Characterization of AA2024-T351 and 2A97 Aluminium Alloys In the present study, the difference of the population density of T 1 phase precipitates in the matrix between T4 and T6 alloys is attributed to the artificial ageing since no cold working prior to ageing is applied for 2A97 alloys to obtain T4 and T6 tempers. In T6 alloy, artificial ageing with the temperature around C in contrast to the natural ageing at ambient temperature to obtain T4 alloy (Figures ), results in the much high population density of matrix T 1 phase precipitates in T6 alloy (Figures ). Since the 2A97 alloy in both T3 and T8 tempers is cold worked to a similar level prior to ageing, which provides high population density dislocations as the preferential sites for precipitation, the ageing temperature is considered to be responsible to the different distribution of T 1 phase precipitates. High population density of T 1 phase precipitates decorate both grain boundary and grain interior in T8 alloy (Figure 4.41) whereas T 1 phase precipitates mainly distribute along selective grain boundaries in T3 alloy (Figure 4.36), indicating the influence of artificial ageing on the T 1 phase precipitation in Al-Cu-Li alloys. Therefore, the artificial ageing significantly facilitates the formation of high population density of T 1 phase precipitates in the 2A97 Al-Cu-Li alloys. It is well-known that the dislocations and low angle grain boundary could act as preferential sites for the precipitation of T 1 phase in the Al-Cu-Li alloys [44-46]. Cold working introduces plastic deformation, leading to high population density of dislocations in the matrix as the preferential site for T 1 phase precipitation. It was suggested that, as a consequence of increased level of plastic deformation, the increased population density of precipitates along with the refinement of T 1 phase precipitate dimension occurred due to the limited diffusion field. Further, T 1 phase precipitation in the alloy matrix is promoted significantly after cold working to increase its strength and ductility while the alloy in a non-stretched condition only exhibits grain boundary T 1 phase precipitate [46]. In the present study,t8 alloy exhibits the increased population density of T 1 phase precipitates with fine dimensions (Figure 4.41) t with respect to that in T6 alloy (Figures ). It was also revealed that the T 1 phase precipitates mainly distribute along grain boundaries in the T3 (Figure 4.36) and T4 (Figures ) conditions since the grain boundary has the higher dislocation density than average level of the grain interior. 107
108 Chapter 4: Microstructure Characterization of AA2024-T351 and 2A97 Aluminium Alloys Grain-stored energy As discussed in AA2024-T351 aluminium alloy, the grain-stored energy represents the population density of dislocations within individual grains. As an analogy, in the 2A97 Al-Cu-Li alloys, both dislocations and subgrain boundaries (which are considered to be arrays of dislocations) within the grain area contribute to its grain-stored energy. As mentioned above, prior to the ageing treatment, the cold working was applied to the 2A97 Al-Cu-Li alloys to obtain T3 and T8 tempers. To a polycrystalline material, the level of plastic deformation of individual grain varies depending on its crystallographic orientation since the grain with different orientation has different numbers of active slip systems, which is determined by the relationship between the fabrication direction and the corresponding grain orientation. Therefore, grains of different orientations tend to have various dislocation population densities, resulting in the heterogeneous distribution of grain-stored energy in T3 and T8 alloys (Figures 4.31 (d) and 4.32 (d)). Since the materials are supplied as the thin sheets, plastic deformation is introduced during the sheet formation process (i.e. coil process), resulting in the heterogeneous distribution of dislocations in 2A97-T4 and T6 alloys. Therefore, the difference of stored energy of individual grains is discernible, representing the population density of crystallographic defects (Figures 4.33 (d) and 4.34 (d)), even though the difference is less evident comparing with that of T3 and T8 alloys due to the absence of pre-ageing cold working. In the subsequent thermomechanical process, the re-arrangement of dislocations could result in the generation of subgrain boundaries within individual grains. Therefore, the grain-stored energy in 2A97 aluminium alloys represents the population density of dislocations as well as subgrain boundaries within the individual grain area. During the EBSD scanning, the orientation of an individual pixel could be determined. When the orientation difference between the two neighbouring pixels is higher than a selected threshold value (1, in the present work), the misorientation between the neighbouring pixels represents the presence of a dislocation. Therefore, the population density of misorientations within a grain reflects that of dislocations in the individual grain. 108
109 Chapter 4: Microstructure Characterization of AA2024-T351 and 2A97 Aluminium Alloys It is known that the energy associated with misorientation above a selected threshold value (1 ) can be calculated using the Read-Shockley equation: γ s = γ 0 θ (A ln θ) where θ is the misorientation angle, γ 0 and A are constants. The stored energy of an individual grain is determined by averaging the sum of the mean energies of pixels over the area of the individual grain. Then, the spatial distribution of the grain-stored energy is represented as a map, which reflects the average population densities of dislocations in the individual grains. In the grain-stored energy map, various appearances of brightness represent the different levels of stored energy, with brighter appearance representing the grain with high level of stored energy and darker appearance indicating the grain with relatively low stored energy. As mentioned above, the evolution of matrix T 1 phase precipitates is closely linked to the dislocation as well as low angle grain boundary. Therefore, heterogeneous distribution of T 1 phase precipitates in the 2A97 alloys is expected due to the different dislocation population densities of individual grains. The heterogeneous distribution of needle-shaped precipitates in the alloy matrix is evidently displayed in Figures , indicating the relationship between the grain-stored energy and the population density of matrix T 1 phase precipitates in the 2A97 alloys. 109
110 Chapter 4: Microstructure Characterization of AA2024-T351 and 2A97 Aluminium Alloys 4.3 Conclusions In the AA2024-T351 aluminium alloy, three types of intermetallic particles, i.e. S-phase (Al 2 CuMg), θ-phase (Al 2 Cu) and α-phase (Al-Cu-Fe-Mn) particles, were identified. The S-phase particle has a relatively regular spherical shape with the size ranging from 0.54 µm to 4.57 µm, accounting for 22.2% of all constituent intermetallic particles on the alloy surface. The θ-phase particle also displays a spherical shape with the dimension ranging from 0.73 µm to 6.18 µm, which accounts for 40.4% of all constituent intermetallic particles. The α-phase particles, which have evident variations in the alloying element contents, display irregular shapes with the sizes ranging from 1.19 µm to 19.2 µm, accounting for 37.4% of all constituent intermetallic particles. Further, it was revealed that intermetallic particles exist either as individual intermetallic particles or as multi-phase intermetallic particle clusters. The clusters consisted of S-phase and θ- phase particles and the multi-phase α-phase particles with heterogeneous distributions of copper and silicon are widely existed on the surface of AA2024-T351 aluminium alloy. Additionally, the linear crystallographic defects were noticed in both θ-phase particles and α-phase particles. It was also revealed that the crystallographic defects in θ-phase particles developed along the orientation parallel with {011} oriented plane. Rectangular and rounded-shaped dispersoids in the AA2024-T351 alloy correspond to the different sections of rod-like Al 20 Cu 2 Mn 3 phase dispersoids. It was revealed that the preferred orientation of the dispersoids in the alloy matrix resulted from the rotation of dispersoids during the thermomechanical process, with the orientation of dispersoids adjusted to accommodate the shear stress. The dispersoid free zone was also detected around selective copper-rich intermetallic particles and intermetallic particle clusters. Further, a range of configurations and population densities of grain boundary precipitates were revealed. The grain boundary segregations of Mg and/or Cu were also detected in the AA2024-T351 aluminium alloy. The distributions of crystallographic orientation and grain-stored energy in the AA2024-T351 aluminium alloy were revealed using EBSD. It was noticed that the distribution of grain boundary misorientation is similar to the theoretical distribution in FFC structure crystal, indicating the absence of texture in the AA2024-T351 aluminium alloy. 110
111 Chapter 4: Microstructure Characterization of AA2024-T351 and 2A97 Aluminium Alloys In the 2A97 Al-Cu-Li alloys of various tempers, the compositions of intermetallic particles and dispersoids are similar due to the relatively low temperature applied in the ageing process. The typical intermetallic particles in the 2A97 Al-Cu-Li alloys mainly contain Al, Cu, Fe and Mn along with certain tracing alloying elements (such as Ag, Ba, Zn and possibly Li [175]), which are present individually or together as intermetallic particle clusters with the heterogeneous distribution of Mn. The main dispersoids in the 2A97 Al-Cu-Li alloys are rich in Al, Cu and Mn, indicating the presence of Al 20 Cu 2 Mn 3 phase dispersoids. In addition, EDX analysis also suggested the existence of Al 3 Zr phase dispersoids. The distributions of T 1 phase precipitates in the 2A97 Al-Cu-Li alloys of various tempers display significant difference. In the T3 and T4 conditions, T 1 phase precipitates mainly distribute along the grain boundary network due to the absence of artificial ageing. In addition, it was noticed that low population density of T 1 phase precipitates heterogeneously distributed in the interior of selective grains in the T4 alloy. By contrast, in the 2A97-T6 Al-Cu-Li alloy, high population density of T 1 phase precipitates in the grain interior and the precipitate free zones along the grain boundary network were detected. It was also revealed that both the grain boundary network and the grain interior are decorated by high population density of T 1 phase precipitates in the 2A97-T8 Al-Cu-Li alloy. The 2A97 Al-Cu-Li alloys in different thermomechanical conditions also display different crystallographic structures. In the T3 condition, two types of grains, i.e. the large coarse grains and the recrystallized fine grains, are present. In the 2A97-T8 alloy, two types of coarse grains of similar dimensions with and without subgrains were also revealed. By contrast, the pancake-shaped grains are dominant in the 2A97-T4 and T6 alloys. The average grain sizes of 2A97-T4 and T6 alloys are much larger than those of 2A97-T3 and T8 alloys. Further, the absence of cold working prior to ageing results in the absence of texture in the 2A97-T4 and T6 alloys, whereas, the texture is evident in the 2A97-T3 and T8 alloys. 111
 (b) Figure 4.")
 Mechanical polishing with 1 µm diamond")
112 Chapter 4: Microstructure Characterization of AA2024-T351 and 2A97 Aluminium Alloys (a) (b) Figure 4.1: Scanning electron micrographs of AA2024-T351 aluminium alloy surface (a) Mechanical polishing with 1 µm diamond paste, (b) OPS polishing. 112
 S-phase, (b) θ- phase, (c) α-phase without")

113 Chapter 4: Microstructure Characterization of AA2024-T351 and 2A97 Aluminium Alloys (a) (b) (c) (d) Figure 4.2: Typical EDX spectra of constituent intermetallic particles (a) S-phase, (b) θ- phase, (c) α-phase without silicon, (d) α-phase with silicon. Table 4.1: Compositions of α-phase particles corresponding to the EDX spectra in Figures 4.2 (c)-(d), with the red values indicating the evident difference of alloying element contents in both particles. 113
 (b)")

-(b) S-phase,")
114 Chapter 4: Microstructure Characterization of AA2024-T351 and 2A97 Aluminium Alloys (a) (b) (c) (d) (e) Figure 4.3: Typical Kikuchi patterns along with the corresponding indexed results of constituent intermetallic particles (a)-(b) S-phase, (c)-(d) θ-phase, (e) α-phase. 114

 (c) (d) Figure 4.")


115 Chapter 4: Microstructure Characterization of AA2024-T351 and 2A97 Aluminium Alloys (a) (b) (c) (d) Figure 4.4: Backscattered electron micrographs of different existence forms of S-phase and θ-phase intermetallic particles in AA2024-T351 aluminium alloy. 115
 (b) (c) (d)")

-(d) Kikuchi")
-(f) Kikuchi S-phase at point")
116 Chapter 4: Microstructure Characterization of AA2024-T351 and 2A97 Aluminium Alloys (a) (b) (c) (d) (e) (f) Figure 4.5: Typical S-phase and θ-phase intermetallic particle cluster (a) Backscattered electron micrograph, (b) Secondary electron micrograph, (c)-(d) Kikuchi pattern with its corresponding indexed result of θ-phase at point 1, (e)-(f) Kikuchi pattern with its corresponding indexed result of S-phase at point

 (c) (d) Figure 4.")


117 Chapter 4: Microstructure Characterization of AA2024-T351 and 2A97 Aluminium Alloys (a) (b) (c) (d) Figure 4.6: Backscattered electron micrographs of typical intermetallic particle clusters of S-phase and θ-phase particles in AA2024-T351 aluminium alloy. 117


 Figure 4.")


 EDX maps, in the")
118 Chapter 4: Microstructure Characterization of AA2024-T351 and 2A97 Aluminium Alloys (a) (b) Figure 4.7: (a) Scanning electron micrograph of a typical intermetallic particle cluster, (b) EDX maps, in the sequence of Al, Cu, Fe, Mn, Si and Mg. 118


 Figure 4.")


 EDX maps, in the")
119 Chapter 4: Microstructure Characterization of AA2024-T351 and 2A97 Aluminium Alloys (a) 2 1 (b) Figure 4.8: (a) Scanning electron micrograph of a typical intermetallic particle cluster, (b) EDX maps, in the sequence of Al, Cu, Mn, Si, Mg and Fe. 119

 (d) Figure 4.")


120 Chapter 4: Microstructure Characterization of AA2024-T351 and 2A97 Aluminium Alloys (a) (b) (c) (d) Figure 4.9: Backscattered electron micrographs of typical α-phase intermetallic particles on the surface of AA2024-T351 aluminium alloy, existing individually and in cluster. 120
 Typical scanning electron micrograph of individual α-phase intermetallic particles, (b) Corresponding EDX spectrum")
121 Chapter 4: Microstructure Characterization of AA2024-T351 and 2A97 Aluminium Alloys (a) 1 (b) Figure 4.10: (a) Typical scanning electron micrograph of individual α-phase intermetallic particles, (b) Corresponding EDX spectrum from point 1 in (a). 121

 (b) (c)")


122 Chapter 4: Microstructure Characterization of AA2024-T351 and 2A97 Aluminium Alloys (a) (b) (c) (d) Figure 4.11: Backscattered electron micrographs of typical α-phase intermetallic particle clusters in AA2024-T351 aluminium alloy. 122


123 Chapter 4: Microstructure Characterization of AA2024-T351 and 2A97 Aluminium Alloys (a) (b) Figure 4.12: (a) Scanning electron micrograph of a typical α-phase intermetallic particle cluster with well-defined shell-core structure, (b) EDX maps, in the sequence of Al, Cu, Mn, Si, Fe and Mg. 123


124 Chapter 4: Microstructure Characterization of AA2024-T351 and 2A97 Aluminium Alloys (a) (b) Figure 4.13: (a) Scanning electron micrograph of a typical α-phase intermetallic particle cluster without well-defined shell-core structure, (b) EDX maps, in the sequence of Al, Cu, Mg, Fe, Mn and Si. 124
 HAADF micrograph of a typical region in the twin-jet electropolished AA2024-T351 aluminium alloy, (b)-(d) EDX spectra from")
125 Chapter 4: Microstructure Characterization of AA2024-T351 and 2A97 Aluminium Alloys (a) (b) (c) (d) Figure 4.14: (a) HAADF micrograph of a typical region in the twin-jet electropolished AA2024-T351 aluminium alloy, (b)-(d) EDX spectra from points 1-3 in (a). 125

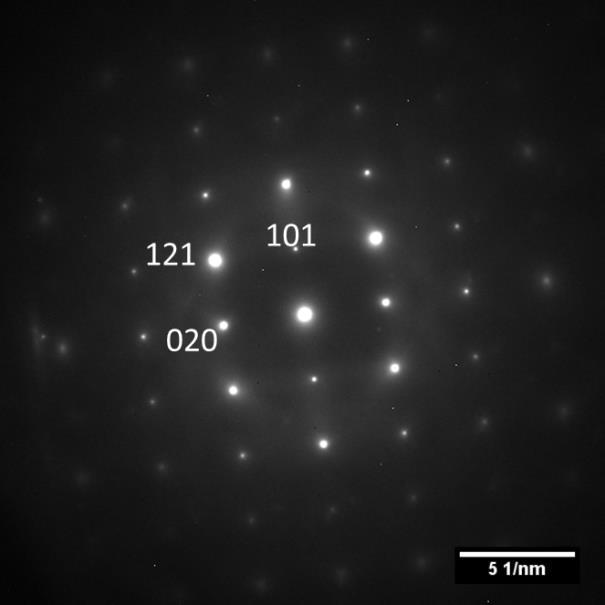


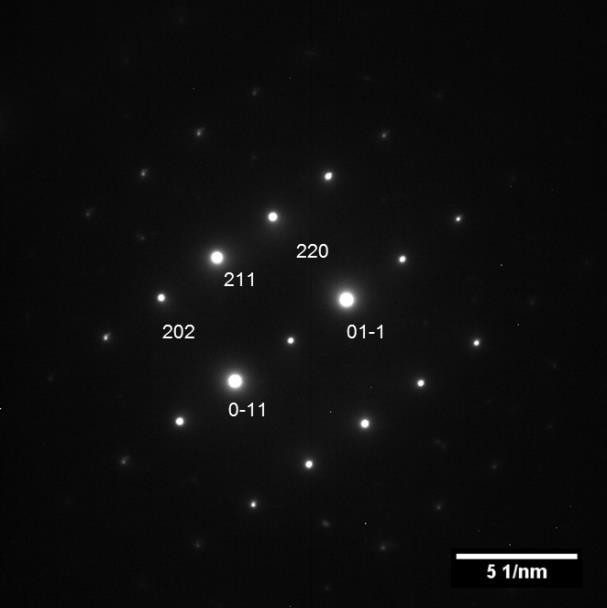
126 Chapter 4: Microstructure Characterization of AA2024-T351 and 2A97 Aluminium Alloys (a) (b) (c) (d) (e) (f) Figure 4.15: To be continued. 126
 Intermetallic particle cluster of S-phase and")
 Framed area in (d) at increased magnification, (f) Corresponding diffraction pattern, (g)-(h) Other typical linear")
127 Chapter 4: Microstructure Characterization of AA2024-T351 and 2A97 Aluminium Alloys (g) (h) Figure 4.15: Transmission electron micrographs of the twin-jet electropolished AA2024 aluminium alloy (a) Intermetallic particle cluster of S-phase and θ-phase, (b) Framed area in (a) with increased magnification, (c) Corresponding diffraction pattern, (d) Individual θ-phase intermetallic particle, (e) Framed area in (d) at increased magnification, (f) Corresponding diffraction pattern, (g)-(h) Other typical linear crystallographic defects in θ-phase intermetallic particles. 127
 (b) Figure 4.")
 Increased magnification")
128 Chapter 4: Microstructure Characterization of AA2024-T351 and 2A97 Aluminium Alloys (a) (b) Figure 4.16: (a) Transmission electron micrograph of a typical α-phase intermetallic particle, (b) Increased magnification of framed area in (a). 128
 (b) (c) (d) Figure 4.")
 EDX spectrum of rod-like dispersoid, (d) EDX spectrum of")
129 Chapter 4: Microstructure Characterization of AA2024-T351 and 2A97 Aluminium Alloys (a) (b) (c) (d) Figure 4.17: (a)-(b) Bright field TEM micrographs of AA2024-T351 aluminium alloy, (c) EDX spectrum of rod-like dispersoid, (d) EDX spectrum of round-shaped dispersoid. 129


130 Chapter 4: Microstructure Characterization of AA2024-T351 and 2A97 Aluminium Alloys (a) (b) (c) (d) Figure 4.18: Typical scanning electron micrographs of dispersoid free zone around (a)- (b) Individual S-phase / θ-phase intermetallic particles, (c)-(d) Multi-phase particle and intermetallic particle cluster of S-phase and θ-phase. 130


 (c) (d) (e) (f)")
131 Chapter 4: Microstructure Characterization of AA2024-T351 and 2A97 Aluminium Alloys (a) (b) (c) (d) (e) (f) Figure 4.19: To be continued. 131
-(b) Bright field and dark field STEM micrographs of a triple grain boundary joint, (c)-(d) Typical EDX line-scan results along line 1 and line 2 in (a),")
-(j) HAADF micrograph of grain boundary and the corresponding EDX line-scan")
132 Chapter 4: Microstructure Characterization of AA2024-T351 and 2A97 Aluminium Alloys (g) (h) (i) (j) Figure 4.19: (a)-(b) Bright field and dark field STEM micrographs of a triple grain boundary joint, (c)-(d) Typical EDX line-scan results along line 1 and line 2 in (a), (e)- (f) Bright field TEM micrograph of a relatively clean grain boundary and the corresponding EDX line-scan result, (g)-(h) HAADF micrograph of grain boundary and the corresponding EDX line-scan result, revealing the presence of Mg segregation, (i)-(j) HAADF micrograph of grain boundary and the corresponding EDX line-scan result, revealing the presence of Cu and Mg segregations. 132

 (e) (f) Figure 4.")

 Grain boundary misorientation")


 The")
133 Chapter 4: Microstructure Characterization of AA2024-T351 and 2A97 Aluminium Alloys (a) (b) (c) (d) (e) (f) Figure 4.20: (a) Crystallographic orientation distribution map in Euler s colours, (b) Misorientation distribution map, (c) Grain boundary misorientation distribution map, (d) Histogram of grain boundary misorientation distribution, (e) Grain-stored energy distribution map in grey scale, with yellow lines applied to represent HAGBs, (f) The distribution of Schmidt factors in AA2024-T351 aluminium alloy. 133

 (c) (d) Figure 4.")
 2A97-T3, (b)")

134 Chapter 4: Microstructure Characterization of AA2024-T351 and 2A97 Aluminium Alloys (a) (b) (c) (d) Figure 4.21: Scanning electron micrographs of (a) 2A97-T3, (b) 2A97-T4, (c) 2A97-T6 and (d) 2A97-T8 aluminium alloys after mechanical polishing to 1 µm. 134
 (b)")


-(f) Typical EDX spectra of intermetallic")
135 Chapter 4: Microstructure Characterization of AA2024-T351 and 2A97 Aluminium Alloys (a) (b) (c) (d) (e) (f) Figure 4.22: Scanning electron micrographs and EDX spectra in 2A97-T3 aluminium alloy (a)-(d) Typical intermetallic particles in 2A97-T3 aluminium alloy in different existing forms, (e)-(f) Typical EDX spectra of intermetallic particles in 2A97-T3 aluminium alloy. 135
 (b) Figure 4.23: To be continued.")
136 Chapter 4: Microstructure Characterization of AA2024-T351 and 2A97 Aluminium Alloys (a) (b) Figure 4.23: To be continued. 136


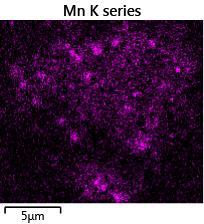
137 Chapter 4: Microstructure Characterization of AA2024-T351 and 2A97 Aluminium Alloys (c) (d) Figure 4.23: Scanning electron micrographs of intermetallic particles in 2A97-T3 aluminium alloy and corresponding EDX maps (a)-(b) Typical intermetallic particles in 2A97-T3 alloy along with the corresponding EDX maps, in the sequence of Al, Cu, Fe, Mn, Ag, Mg and Zn, (c)-(d) Another typical intermetallic particles in 2A97-T3 alloy along with the corresponding EDX maps, in the sequence of Al, Cu, Fe, Mn, Ag, Zn and Mg. 137
 (b)")


-(f) Typical EDX spectra of intermetallic")
138 Chapter 4: Microstructure Characterization of AA2024-T351 and 2A97 Aluminium Alloys (a) (b) (c) (d) (e) (f) Figure 4.24: Scanning electron micrographs and EDX spectra in 2A97-T4 aluminium alloy (a)-(d) Typical intermetallic particles in 2A97-T4 aluminium alloy in different existing forms, (e)-(f) Typical EDX spectra of intermetallic particles in 2A97-T4 aluminium alloy. 138


 EDX")

, in the")

 EDX 24 (d),")

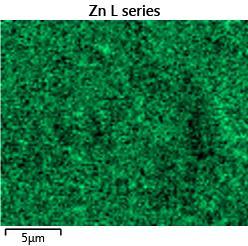
139 Chapter 4: Microstructure Characterization of AA2024-T351 and 2A97 Aluminium Alloys (a) (b) Figure 4.25: EDX maps of intermetallic particles in 2A97-T4 aluminium alloy (a) EDX maps of intermetallic particles shown in Figure 4.24 (c), in the sequence of Al, Cu, Fe, Mn, Ag, Mg, Ba and Zn, (b) EDX maps of intermetallic particles shown in Figure 4.24 (d), in the sequence of Al, Cu, Fe, Mn, Ag, Mg, Ba and Zn. 139
 (d) Figure 4.")

140 Chapter 4: Microstructure Characterization of AA2024-T351 and 2A97 Aluminium Alloys (a) (b) (c) (d) Figure 4.26: Scanning electron micrographs and EDX spectra in 2A97-T6 aluminium alloy (a)-(b) Typical intermetallic particles in 2A97-T6 aluminium alloy in different existing forms, (c)-(d) Typical EDX spectra of intermetallic particles in 2A97-T6 aluminium alloy. 140


 (b) (c)")


 EDX maps for")


 Typical")
, in the")

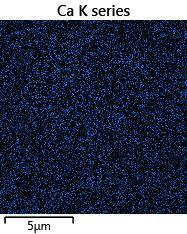
141 Chapter 4: Microstructure Characterization of AA2024-T351 and 2A97 Aluminium Alloys (a) (b) (c) Figure 4.27: Scanning electron micrograph of intermetallic particles in 2A97-T6 aluminium alloy and EDX maps (a) EDX maps for intermetallic particles shown in Figure 4.26 (b), in the sequence of Al, Cu, Fe, Mn, Zn, Ag, Ca and Mg, (b) Typical intermetallic particles in 2A97-T6 aluminium alloy, (c) EDX maps for intermetallic particles shown in (b), in the sequence of Al, Cu, Fe, Mn, Mg, Ag, Ca and Zn. 141
 (d) Figure 4.")

142 Chapter 4: Microstructure Characterization of AA2024-T351 and 2A97 Aluminium Alloys (a) (b) (c) (d) Figure 4.28: Scanning electron micrographs and EDX spectra in 2A97-T8 aluminium alloy (a)-(b) Typical intermetallic particles in 2A97-T8 aluminium alloy in different existing forms, (c)-(d) Typical EDX spectra of intermetallic particles in 2A97-T8 aluminium alloy. 142


 Figure 4.")

")

, in the")


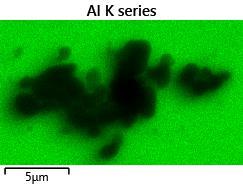
143 Chapter 4: Microstructure Characterization of AA2024-T351 and 2A97 Aluminium Alloys (a) (b) Figure 4.29: EDX maps of intermetallic particles in 2A97-T8 aluminium alloy (a) EDX maps for the intermetallic particles shown in Figure 4.28 (a), in the sequence of Al, Ag, Cu, Mg, Mn, Fe and Zn, (b) EDX maps for the intermetallic particles shown in Figure 4.28 (b), in the sequence of Al, Ag, Cu, Mg, Mn, Fe and Zn. 143

 (d) Figure 4.")

 2A97-T4, (c) 2A97-T6")
144 Chapter 4: Microstructure Characterization of AA2024-T351 and 2A97 Aluminium Alloys (a) (b) (c) (d) Figure 4.30: Backscattered electron micrographs, revealing the grain orientation distribution in (a) 2A97-T3, (b) 2A97-T4, (c) 2A97-T6 and (d) 2A97-T8 aluminium alloys. 144
 (b) (c) (d) Figure 4.")

")
145 Chapter 4: Microstructure Characterization of AA2024-T351 and 2A97 Aluminium Alloys (a) (b) (c) (d) Figure 4.31: EBSD analysis of 2A97-T3 aluminium alloy (a) IPFZ map, (b) Grain boundary misorientation distribution map with black lines and grey lines representing HAGBs and LAGBs, (c) Histogram of grain boundary misorientation distribution in 2A97-T3 aluminium alloy, (d) Grain-stored energy distribution in grey scale. 145
 (b) (c)")
")


146 Chapter 4: Microstructure Characterization of AA2024-T351 and 2A97 Aluminium Alloys (a) (b) (c) (d) Figure 4.32: EBSD analysis of 2A97-T8 aluminium alloy (a) IPFZ map, (b) Grain boundary misorientation distribution map with black lines and grey lines representing HAGBs and LAGBs, (c) Histogram of grain boundary misorientation distribution in 2A97-T8 aluminium alloy, (d) Grain-stored energy distribution in grey scale. 146
 (b) (c) (d) Figure 4.")

")
147 Chapter 4: Microstructure Characterization of AA2024-T351 and 2A97 Aluminium Alloys (a) (b) (c) (d) Figure 4.33: EBSD analysis of 2A97-T4 aluminium alloy (a) IPFZ map, (b) Grain boundary misorientation distribution map with black lines and grey lines representing HAGBs and LAGBs, (c) Histogram of grain boundary misorientation distribution in 2A97-T4 aluminium alloy, (d) Grain-stored energy distribution in grey scale. 147

 Histogram of grain boundary")
148 Chapter 4: Microstructure Characterization of AA2024-T351 and 2A97 Aluminium Alloys (a) (b) (c) (d) Figure 4.34: EBSD analysis of 2A97-T6 aluminium alloy (a) IPFZ map, (b) Grain boundary misorientation distribution map with black lines and grey lines representing HAGBs and LAGBs, (c) Histogram of grain boundary misorientation distribution in 2A97-T6 aluminium alloy, (d) Grain-stored energy distribution in grey scale. 148
 (b) (c) (d) (e) (f) Figure 4.")
 T3 alloy, (b) T4 alloy,")
 Al-Cu-Mn dispersoid and (f) Al-Zr")
149 Chapter 4: Microstructure Characterization of AA2024-T351 and 2A97 Aluminium Alloys (a) (b) (c) (d) (e) (f) Figure 4.35: HAADF micrographs of 2A97 Al-Cu-Li alloys, revealing the distribution of dispersoids in (a) T3 alloy, (b) T4 alloy, (c) T6 alloy, (d) T8 alloy and typical EDX spectra of the dispersoids: (e) Al-Cu-Mn dispersoid and (f) Al-Zr dispersoid. 149


-(d) HAADF micrographs")
150 Chapter 4: Microstructure Characterization of AA2024-T351 and 2A97 Aluminium Alloys (a) (b) (c) (d) Figure 4.36: (a) Ultra-high resolution SEM micrograph, (b)-(d) HAADF micrographs at different magnifications of 2A97-T3 alloy. 150
 (b) (c) (d)")
 Ultra-high resolution SEM micrograph of a grain")
 at higher magnification, (c)-(d) Bright field")
151 Chapter 4: Microstructure Characterization of AA2024-T351 and 2A97 Aluminium Alloys (a) (b) (c) (d) Figure 4.37: (a) Ultra-high resolution SEM micrograph of a grain boundary junction in 2A97-T4 alloy, (b) Grain boundary A-A in (a) at higher magnification, (c)-(d) Bright field TEM micrographs of typical grain boundaries in 2A97-T4 alloy. 151

 (b) (c)")


152 Chapter 4: Microstructure Characterization of AA2024-T351 and 2A97 Aluminium Alloys (a) (b) (c) (d) Figure 4.38: HAADF micrographs of 2A97-T4 alloy, revealing the heterogeneous distribution of precipitates in the alloy matrix. 152
 (b) (c)")
 Bright field TEM micrograph of 2A97-T6")


153 Chapter 4: Microstructure Characterization of AA2024-T351 and 2A97 Aluminium Alloys (a) (b) (c) (d) Figure 4.39: (a) Bright field TEM micrograph of 2A97-T6 alloy, (b) HAADF micrograph of 2A97-T6 alloy, (c) High resolution TEM micrograph of the needleshaped precipitate, with FFT result inset, (d) HAADF micrograph, revealing the heterogeneous distribution of precipitates in the 2A97-T6 alloy matrix. 153


 Bright field TEM")
-(d)")
154 Chapter 4: Microstructure Characterization of AA2024-T351 and 2A97 Aluminium Alloys (a) (b) (c) (d) Figure 4.40: (a) HAADF micrograph of 2A97-T6 alloy, (b) Bright field TEM micrograph of a typical grain boundary in 2A97-T6 alloy, (c)-(d) Ultra-high resolution SEM micrographs of 2A97-T6 alloy. 154

 (f) Figure 4.")
 High resolution TEM")
")
-(e) Bright field TEM micrographs of")
 HAADF micrograph of")
155 Chapter 4: Microstructure Characterization of AA2024-T351 and 2A97 Aluminium Alloys (a) (b) (c) (d) (e) (f) Figure 4.41: (a) Bright field TEM micrograph of 2A97-T8 alloy, (b) High resolution TEM micrograph of the needle-shaped precipitate, with FFT result inset, (c) Ultra-high resolution SEM micrograph, (d)-(e) Bright field TEM micrographs of a typical grain boundary at different tilting angles, (f) HAADF micrograph of a triple joint of grain boundaries in 2A97-T8 alloy. 155
156 Chapter 5: Corrosion Behaviour of AA2024-T351 Aluminium Alloy CHAPTER 5 Corrosion Behaviour of AA2024-T351 Aluminium Alloy 156
157 Chapter 5: Corrosion Behaviour of AA2024-T351 Aluminium Alloy 5 Corrosion Behaviour of AA2024-T351 Aluminium Alloy The heterogeneous microstructure of AA2024-T351 aluminium alloy is intentionally developed to obtain desirable mechanical property, which may have significant detrimental effect on its corrosion resistance. In this chapter, the corrosion behaviour of AA2024-T351 aluminium alloy was investigated with a range of electron microscopy techniques, including scanning electron microscopy (SEM), transmission electron microscopy (TEM), energy dispersive X-ray analysis (EDX) and electron backscatter diffraction (EBSD). The first part of the Chapter is focussed on the corrosion behaviour related to constituent intermetallic particles in AA2024-T351 aluminium alloy. The microcoupling between the constituent intermetallic particle and the alloy matrix in the periphery results in localized corrosion. Additionally, selective dissolution behaviour of constituent intermetallic particles in AA2024-T351 aluminium alloy was also explored. The second part of the Chapter is to understand the stable localized corrosion behaviour in AA2024-T351 aluminium alloy. Typical corrosion morphologies, including attacked grain boundaries and crystallographic pits of grain interior, were developed at the stable localized corrosion site during the immersion testing. Both local microstructure and chemical criteria for the development of stable localized corrosion were explored. Further, the influence of grain-stored energy on the propagation of intergranular corrosion was also investigated. 5.1 Corrosion behaviour of constituent intermetallic particles Localized corrosion behaviour of AA2024-T351 aluminium alloy is significantly affected by the distribution and composition of intermetallic particles on the alloy surface [18, 23, 70]. Since flaws of the oxide film around the intermetallic particles along with the micro-coupling between the intermetallic particle and the alloy matrix in its periphery promotes the development of localized corrosion, the localized corrosion of the alloy is significantly affected by the corrosion behaviour of intermetallic particles [21, 72, 81]. Therefore, it is necessary to understand the corrosion behaviour of constituent intermetallic particles when the alloy is exposed to aggressive environment. 157
158 Chapter 5: Corrosion Behaviour of AA2024-T351 Aluminium Alloy General observation Figures 5.1 (a)-(b) display the surface appearance of a mechanically polished AA2024 alloy before and after the immersion in a 3.5 wt. % NaCl (H 2 O 2 ) testing solution for 30 min. As shown in Figure 5.1 (a), cavities of micrometre scale dimensions, as marked with white arrows, are evident on the alloy surface before the immersion testing, which are possibly due to the removal of intermetallic particles during the mechanical polishing, since the distribution of the cavities is consistent with that of constituent intermetallic particles in the as-received alloy. Comparing the surface morphology before and after the immersion testing, increased population density of cavities with micrometre scale dimensions was detected after the immersion testing. The dimensions of cavities on the alloy surface are comparable with those of intermetallic particles, suggesting that the cavities correspond to the corrosion pits associated with intermetallic particles. Corrosion product is also discernible, covering the surface of selective intermetallic particles, as indicated by the white arrows in Figure 5.1 (b). Besides a range of corrosion features associated with intermetallic particles on the alloy surface, a typical stable localized corrosion site was also developed, as indicated with the red arrow in Figure 5.1 (b). Figures 5.1 (c)-(d) displays the stable localized corrosion site in Figure 5.1 (b) at increased magnification. It is revealed that a corrosion product ring with the dimension around 30 µm is located at the stable localized corrosion site with attacked grain boundaries and corrosion pits in its centre. Additionally, as shown in Figure 5.1 (d), a bright feature, as marked with the red arrow, is revealed in backscattered electron micrograph, indicating the presence of a second phase particle at the localized corrosion site. Since the morphology of the particle does not appear in the corresponding secondary electron micrograph (Figure 5.1 (c)), the particle is supposed to be buried beneath the alloy surface. In order to distinguish the corrosion behaviour associated with different types of constituent intermetallic particles in the AA2024 alloy, pre-testing EDX analysis was conducted on intermetallic particles in a typical area on the alloy surface with the corresponding backscattered electron micrograph shown in Figure 5.2 (a). Figure 5.2 (b) displays the surface morphology after the immersion in a 3.5 wt. % NaCl (H 2 O 2 ) testing solution for 30 min. Narrow gaps, namely trenching, were developed around the 158
159 Chapter 5: Corrosion Behaviour of AA2024-T351 Aluminium Alloy intermetallic particles (marked with white arrows in Figure 5.2 (b)), indicating the preferential dissolution of the alloy matrix in the periphery of intermetallic particles. Two intermetallic particles on the alloy surface labelled with A and B are selected for further investigation. The composition of particle A was analysed using EDX before and after the immersion testing with the corresponding EDX spectra shown in Figures 5.2 (c) and (g), respectively. Particle A is identified as the S-phase (Al 2 CuMg) intermetallic particle since the EDX spectrum prior to the immersion testing displays the obvious peaks of Al, Mg and Cu, which is in good agreement with typical EDX spectrum of S-phase shown in Figure 4.2 (a). After the immersion in a 3.5 wt. % NaCl (H 2 O 2 ) solution for 30 min, the S-phase particle maintained its shape with reduced size, and the development of trenching at its adjacent was also evident as shown in Figure 5.2 (b). Figure 5.2 (e) shows the backscattered electron micrograph of particle A at increased magnification, exhibiting the spongy morphology on its surface after the immersion testing. The development of porous appearance on S-phase remnants has been extensively reported as a consequence of selective dissolution of magnesium and possibly aluminium from S-phase particles during the immersion testing [17, 67, 78]. The selective dissolution behaviour of S-phase particle is confirmed by the EDX analysis of particle A after the immersion testing with the corresponding EDX spectrum shown in Figure 5.2 (g). The EDX spectrum displays the absence of magnesium peak, suggesting the significant decrease in magnesium content as a consequence of selective dissolution of Mg in the S-phase particle. Comparing with the EDX spectrum before the immersion (Figure 5.2 (c)), the appearance of oxygen peak in the EDX spectrum after the immersion reveals the presence of corrosion product on the surface of S-phase remnant, which is in good agreement with the surface morphology as shown in Figure 5.2 (e). To particle B, the pre-testing EDX spectrum is shown in Figure 5.2 (d), exhibiting a relatively high level of copper, which is consistent with the typical EDX spectrum of θ- phase shown in Figure 4.2 (b). Therefore, particle B is considered as the θ-phase particle. The anodic dissolution preferentially occurred to the alloy matrix in the vicinity of the particle due to the micro-coupling between the θ-phase particle and the alloy matrix, resulting in the formation of trenching around the particle. Unlike the significant 159
160 Chapter 5: Corrosion Behaviour of AA2024-T351 Aluminium Alloy surface morphological change of S-phase particle after the immersion testing, the surface appearance of θ-phase particle after the immersion is similar with that prior to the immersion testing, displaying little sign of selective dissolution. EDX analysis was also carried out on particle B after the immersion testing with EDX spectrum displayed in Figure 5.2 (h). The evident oxygen peak in the EDX spectrum indicates the presence of corrosion product on particle B after the immersion testing. The compositions of particles A and B and the alloy matrix before and after the immersion testing are compared in Table 5.1. The oxygen content increases on both particles and the alloy matrix after the immersion testing, revealing the presence of corrosion product, which is consistent with surface morphology shown in the SEM micrographs. Since the presence of oxygen affects the relative content of aluminium, copper and magnesium in the EDX analysis, the ratios between the contents of alloying elements and that of aluminium instead of their relative contents were employed to determine the compositional modification before and after the immersion testing. To particle A, the ratio of Cu/Al was close before and after the immersion, while, the ratio of Mg/Al before the immersion was significantly larger than that after the immersion, suggesting the preferential dissolution of Mg in the S-phase particle. To particle B, the ratio of Cu/Al displayed significant increase after the immersion testing, indicating the enrichment of copper in the θ-phase particle remnant Corrosion behaviour of individual intermetallic particle S-phase particle (Al 2 CuMg particle) Typical corrosion morphology of S-phase particle after 30 min immersion in a 3.5 wt. % NaCl (H 2 O 2 ) solution is shown in Figure 5.3 at various length scales, displaying the similar morphology with that shown in Figure 5.2. The narrow gap, namely trenching, at the adjacent of S-phase remnant is evident as shown in Figure 5.3 (a). The bright features of nanometre scale dimensions are evident in the periphery of the S-phase remnant, as indicated with the red arrows in Figure 5.3 (b). Due to the absence of corresponding morphology in the secondary electron micrograph (Figure 5.3 (a)), it is believed that the nano-particles were buried within the corrosion product layer. Further, the development of spongy morphology after the selective dissolution in the S-phase particle is shown in Figure 5.3 (c) at increased magnification. 160
161 Chapter 5: Corrosion Behaviour of AA2024-T351 Aluminium Alloy Additionally, nano-particles with brighter appearance around the S-phase remnant, present individually or in clusters, are evident, as indicated with the red arrows in Figure 5.3 (d). Such nano-particles are probably deposited copper due to the dissolution of the alloy matrix, which is consistent with the previous literature, indicating the incorporation of Cu nanoparticles into corrosion product as a possible method for copper re-distribution during the immersion testing [17]. Thin foils of as-received AA2024-T351 aluminium alloy generated with ultramicrotomy were immersed in a 3.5 wt. % NaCl solution for 1 minute prior to TEM examination. Figure 5.4 (a) displays a bright field transmission electron micrograph of a partlydissolved intermetallic particle, which was confirmed to be S-phase since the increased contents of Mg and Cu from the intact part of the intermetallic particle were detected with EDX analysis. Figure 5.4 (b) displays the de-alloyed S-phase particle at increased magnification. The darker appearance in the bright field TEM micrograph (Figure 5.4 (b)) indicates the higher atomic numbers of the particles due to the relatively uniform thickness of the foil, suggesting enrichment of heavy elements, i.e. copper in this situation. It is also revealed that the de-alloyed S-phase particle is characterized by nano-particles with the dimensions ranging from 10 nm to 40 nm. The morphology of the nano-particles is shown in Figure 5.4 (c) at higher magnification, exhibiting parallel rows of crystallographic defects, which are likely to be staking faults. As suggested in related literature, the staking fault is popular in metallic copper particles, indicating the development of metallic copper during the selective dissolution of S-phase particles [87]. The diffraction pattern of the de-alloyed region in the S-phase particle is comprised of concentric rings and several discrete spots, as shown in Figure 5.4 (d), indicating a polycrystalline structure of the spongy structure in the de-alloyed S-phase particle. Careful indexing of the diffraction pattern reveals the pattern corresponding to metallic copper and copper oxides. The result suggests that the formation of metallic copper nanoparticles occurred during the selective dissolution of the S-phase particle with the possibility of subsequent oxidation of copper metallic particles, which is consistent with previous literature about the S-phase dealloying [67, 81, 87]. 161
162 Chapter 5: Corrosion Behaviour of AA2024-T351 Aluminium Alloy θ-phase particle (Al 2 Cu particle) The morphology of a θ-phase particle after 30 min immersion in a 3.5 wt. % NaCl (H 2 O 2 ) solution is shown in Figures 5.5 (a)-(b) at different magnifications. Gentle plasma cleaning was employed to remove the corrosion product layer covering the alloy surface for a better observation. Similar with the morphology shown in Figure 5.2, the trenching developed at its adjacent is obvious (as indicated with white arrows) along with the absence of porous features on its surface as shown in Figure 5.5 (a). Part of the θ-phase particle was removed due to the combined effect of the preferential dissolution of the alloy matrix in its periphery during the immersion testing and the subsequent plasma cleaning, which allows the observation of the corrosion morphology beneath the surface of the θ-phase particle. As shown in Figure 5.5 (b), typical porous structure of the θ-phase particle is evident beneath the surface in contrast to the absence of such features on the surface, which is consistent with the results in Figure 5.2. The observation clearly suggests that the selective dissolution preferentially occurred beneath the surface of the θ-phase particle. After two hours immersion in a 3.5 wt. % NaCl (H 2 O 2 ) solution, typical corrosion morphology of θ-phase particles was examined with the typical results shown in Figures 5.5 (c)-(d), displaying the porous structure on the surface. The porous structure, which is similar with that developed on the dealloying S-phase particles, indicates that selective dissolution of θ-phase particles developed to the surface with prolonged immersion time. Further, heterogeneous corrosion behaviour of the θ-phase particle is evident, with some small cavities on the surface, as indicated with the red arrows in Figures 5.5 (c)-(d). The development of cavities is considered to arise from the compositional heterogeneity in the θ-phase particle, namely S-phase particles with relatively small dimensions embedded in the θ-phase particle (as shown in Figure 4.7), since the dimension of the cavity is comparable with that of the second phase particle in the θ-phase particle. In addition to the corrosion pits in θ-phase particle, the banding structure along certain orientation was also detected in selective θ-phase particles as shown in Figure 5.6, indicating the heterogeneous dissolution of θ-phase particle. As shown in Figure 5.6 (a), trenching developed in the periphery is evident. Furthermore, the banding structure along certain orientation along with two localized corrosion pits is discernible on the 162
163 Chapter 5: Corrosion Behaviour of AA2024-T351 Aluminium Alloy surface of the θ-phase particle, as indicated in Figure 5.6 (a). Typical spongy morphology was also observed on the surface of the θ-phase particle as shown in Figure 5.6 (b) at increased magnification, indicating the selective dissolution of θ-phase particle. Two individual θ-phase particles on the alloy surface are displayed in Figures 5.6 (c)-(d). Besides the trenching in the periphery, banding structure along certain orientation with typical porous structure is evident on both θ-phase particles. Further, banding structure exhibits high brightness in the backscattered electron micrographs, indicating the enrichment of heavy alloying elements, supposedly copper in this situation. The heterogeneous selective dissolution behaviour of intermetallic particles in AA2024 aluminium alloy has been observed and discussed in related literatures, especially about S-phase particles [76, 77, 85, 87]. It was found that both the compositional [85] and structural [87] inhomogeneity contribute to the heterogeneous dissolution of S-phase particles. As an analogy, it is likely that the inhomogeneity of structure /composition results in the localized dissolution behaviour of θ-phase particle, leading to the development of corrosion pits and banding structure during the selective dissolution. The compositional and structural inhomogeneity is evident in selective θ-phase particles on the surface of as-received AA2024 alloy as shown in Figures 4.7 and 4.15, respectively. In order to better understand the development of the banding structure in θ-phase particles, focussed ion beam (FIB) was applied to generate the cross sections of dealloyed θ-phase particles after the immersion in a 3.5 wt. % NaCl (H 2 O 2 ) solution for 2 hours. Cross sections of the de-alloyed θ-phase particle are shown in Figures 5.6 (e)-(f), displaying the similar corrosion features with that in Figures 5.6 (a)-(d), i.e. banding structure along certain orientation and trenching at its adjacency. As shown in Figure 5.6 (e), the parallel banding structure with typical spongy morphology is present next to the trenching around the θ-phase particle, indicating the propagation of de-alloying along certain orientation. Figure 5.6 (f) displays the opposite side of the de-alloyed θ- phase particle in Figure 5.6 (e), exhibiting the parallel banding structure. A thin foil of the de-alloyed θ-phase particle was prepared with FIB for detailed TEM/STEM analysis. A bright field transmission electron micrograph of the de-alloyed θ-phase particle along with the corresponding selected area diffraction pattern is shown 163
164 Chapter 5: Corrosion Behaviour of AA2024-T351 Aluminium Alloy in Figures 5.7 (a)-(b), respectively. Selected area diffraction pattern of the de-alloyed θ- phase particle is shown in Figure 5.7 (b). The indexing of the diffraction pattern indicates the orientation of banding structure is roughly parallel with {121} plane in the θ-phase particle. Bright field TEM micrograph of banding structure is shown in Figure 5.7 (c) at increased magnification. It is revealed that the corroded volume within the banding structure is characterized by the high population density of ligaments with the width around 10nm, as indicated in Figure 5.7 (c) with red arrows. Additionally, a high resolution transmission electron micrograph of a typical linear crystallographic defect within the θ-phase particle is shown in Figure 5.7 (d) with the FFT result from the framed area inset, revealing the linear crystallographic defects develop in the direction parallel with {112} oriented planes. In order to correlate the compositional information with the characteristic morphology in the de-alloyed θ-phase particle, high resolution scanning transmission electron microscopy was employed to further analyse the banding structure within the θ-phase particle. As shown in Figure 5.8 (a), a high angle annular dark field (HAADF) micrograph exhibits the banding structure containing high population density of de-alloying ligaments and the linear crystallographic defects on the intact part next to the banding structure, as marked with the red arrow. It is evident that the direction of the de-alloyed banding structure is parallel with that of the linear crystallographic defects, correlating the development of banding structure to the crystallographic defect in the θ-phase particle. Figure 5.8 (b) displays the HAADF micrograph of the banding structure, exhibiting the network of corrosion paths within the banding structure. The banding structure consists of the network of corrosion paths and intact part. The network of corrosion paths are comprised of high population density of ligaments with the widths around 10 nm, which developed along two different orientations, with the vertical propagation direction aligned with that of the banding structure. Since the contrast in the HAADF micrograph originates from the atomic number difference, the high brightness of the interface between the corroded volume (i.e. ligament) and the matrix, with the dimension around a few nanometres, indicates the enrichment of heavy alloying elements within the banding structure, possibly copper in this situation. Further, EDX mapping was 164
165 Chapter 5: Corrosion Behaviour of AA2024-T351 Aluminium Alloy employed to analysis the distribution of alloying elements in the region. The copper map of the region (inset Figure 5.8 (b)) displays slightly higher brightness of the wall along the corrosion path, confirming its copper-rich nature. The copper enrichment is consistent with the heavy element enrichment as revealed in the corresponding HAADF micrograph. Due to the volume effect of EDX analysis, the copper enrichment in the copper map is less evident than that in the HAADF micrograph. A high resolution HAADF micrograph of the linear crystallographic defect (as marked in Figure 5.8 (a)) is shown in Figure 5.8 (c). The atomic misalignment of the linear crystallographic defects suggests the defects are stacking faults. The fast Fourier transformation of the HAADF micrograph (inset in Figure 5.8 (c)) illustrates the crystallographic orientation of the θ-phase particle and, consequently, reveals the orientation of the linear crystallographic defects. It is evident that the linear crystallographic defect in θ-phase particle follows the {112} oriented planes in the θ- phase particle, which is consistent with the previous result (Figure 5.7 (d)). What s more, the orientation relationship of the θ-phase particle reveals the crystallographic orientation of ligaments within the banding structure, indicating that the ligaments of de-alloyed θ-phase particle could develop in the directions parallel with {112} and {110} oriented planes in the θ-phase particle as shown in Figure 5.8 (d). In the present work, it is noticed that the de-alloying banding structure developed along the orientations parallel with that of the crystallographic defect as shown in Figure 5.8, correlating the development of de-alloying banding structure with the linear crystallographic defects. Additionally, the bright field transmission electron micrograph along with the selected area diffraction pattern from the intact θ-phase particle in twinjet electropolished foils of AA2024-T351 aluminium alloy are displayed in Figure 4.15, exhibiting linear crystallographic defect with the similar morphology as shown in Figure 5.8 (a). The distance between the linear crystallographic defects in as-received θ- phase particle is the same order of magnitude as the distance between banding structures, further confirming the correlation between the development of corrosion banding structure and the crystallographic defects in the θ-phase particle. Therefore, it is believed that the de-alloyed banding structure preferentially developed along the crystallographic defects in the θ-phase particle. 165
166 Chapter 5: Corrosion Behaviour of AA2024-T351 Aluminium Alloy Due to the heterogeneous distribution of crystallographic defects, it is believed that the de-alloying preferentially occurs to the θ-phase particle with high population density of crystallographic defects, correlating the corrosion susceptibility to the crystallographic defects, which is comparable with the conclusions from related studied [87, 103, 178]. As a result, the uneven distribution of crystallographic defects in θ-phase particles results in different corrosion susceptibility during the immersion testing. Therefore, θ- phase particles with the existence of de-alloying banding structure after the immersion testing are supposedly decorated by high population density of crystallographic defects α-phase particle (Al-Cu-Fe-Mn particle) In contrast to the significant morphological modification of S-phase and θ-phase particles, little change was observed on Al-Cu-Fe-Mn particles after 2 hours immersion in a 3.5 wt. % NaCl solution. As shown in Figure 5.9 (a), the morphology of Al-Cu-Fe- Mn intermetallic particles remained similar with that prior to the immersion testing (Figure 4.9). Small cavities were noticed in the periphery, as marked with red arrows in Figure 5.9 (a), indicating the heterogeneous development of trenching around the Al- Cu-Fe-Mn intermetallic particles. Further corrosion activities associated with Al-Cu-Fe- Mn intermetallic particles are evident after prolonged immersion time to 24 hours as shown in Figure 5.9 (b). After 24 hours immersion, some Al-Cu-Fe-Mn particles still remained intact while trenching preferentially developed around other Al-Cu-Fe-Mn intermetallic particles, indicating the different corrosion susceptibility of Al-Cu-Fe-Mn intermetallic particles. Typical Al-Cu-Fe-Mn intermetallic particles after 24 hours immersion in a 3.5 wt. % NaCl solution are shown in Figures 5.10 (a)-(d). The gap between the intermetallic particle and the alloy matrix is evident, revealing the development of trenching in the periphery of Al-Cu-Fe-Mn intermetallic particles. Corrosion product with relatively dark appearance in the backscattered electron micrograph is discernible. Moreover, bright features of nanometre scale dimensions are also displayed in backscattered electron micrographs, indicating the increased content of heavy elements. Such nanoparticles, present individually or in cluster, are probably deposited copper, which were deposited on the Al-Cu-Fe-Mn particle during the dissolution of the alloy matrix as suggested in related literature [94]. 166
167 Chapter 5: Corrosion Behaviour of AA2024-T351 Aluminium Alloy EDX mapping was carried out on the Al-Cu-Fe-Mn intermetallic particle in Figure 5.10 (c)-(d), with alloying element maps shown in Figure 5.10 (e) in the sequence of Al, Cu, Fe, Mn, Mg and O. According to Fe and Mn maps, the dimensions of Mn and Fe rich areas display slight difference with respect to that of the intermetallic particle, which is represented by aluminium depleted area, indicates the possibility of selective dissolution of Mn and Fe from Al-Cu-Fe-Mn intermetallic particle and the subsequent re-deposition during the immersion testing [97, 179]. The increased intensity of oxygen in the intermetallic particle area indicates the presence of corrosion product covering the attacked intermetallic particle. Copper map displays increased intensity at two individual areas as marked with red arrows, corresponding to the brighter appearance in the BSE micrograph shown in Figure 5.10 (d), confirming the copper rich nature of the bright nano-particles. It has been claimed that the development of copper rich nano-particles during the immersion testing is attributed to copper re-distribution during the immersion testing. It was suggested that following the selective dissolution of Mg / Al from S / θ-phase particles, Cu nanoparticles incorporate into corrosion product and finally dissolve to form copper ions. As an analogy, the mechanism is likely to contribute to the copper redeposition on Al-Cu-Fe-Mn intermetallic particles and probably other surface area during the immersion testing [67, 94]. To remove the thick layer of corrosion product on the surface, gentle polishing with 1 µm diamond paste was applied after the immersion for 24 hours, which allows the direct observation of the morphological change of Al-Cu-Fe-Mn intermetallic particles. Interestingly, the banding structure along certain orientation is widely existed in Al-Cu- Fe-Mn intermetallic particles with the typical examples shown in Figures 5.11 (a)-(c). The micrographs indicate the occurrence of selective dissolution in Al-Cu-Fe-Mn intermetallic particles with prolonged immersion time. Figure 5.11 (d) displays the banding structure in the framed area of Figure 5.11 (c) at increased magnification, exhibiting the banding structure characterized with the spongy morphology, which has a bright appearance in the backscattered electron micrograph. The brighter appearance in the BSE micrograph suggests the enrichment of heavy alloying element, supposedly copper in this case. It was also reported that spongy morphology is the results of atomic re-arrangement during the selective dissolution [17, 67, 81, 82, 87], suggesting the selective dissolution occurred in the Al-Cu-Fe-Mn particle after 24 hours immersion. 167
168 Chapter 5: Corrosion Behaviour of AA2024-T351 Aluminium Alloy The linear crystallographic defects in Al-Cu-Fe-Mn particles were detected as shown in Figure The distance between the linear crystallographic defects is consistent with that between the corroded bands, correlating the development of the banding structure with the linear crystallographic defects in Al-Cu-Fe-Mn intermetallic particles of AA2024 alloy Corrosion behaviour of clustered intermetallic particles The morphology of the cluster of S-phase and θ-phase particles was investigated using SEM before and after the immersion testing. Prior to the immersion testing, the alloy surface was plasma cleaned with GDOS, facilitating the application of Kikuchi pattern to identify the cluster of S-phase and θ-phase particles. A typical cluster of S-phase and θ-phase particles is shown in Figure 5.12 (a). Both EDX and EBSD analysis results are displayed in Figure 5.12, indicating that the intermetallic particle cluster is comprised of S-phase and θ-phase particles. EDX analysis was carried out at the positions marked with numbers 1-4 with the corresponding EDX spectra shown in Figures 5.12 (b)-(e), respectively. Evidently, the peaks of magnesium are weak in the EDX spectra shown in Figures 5.12 (b)-(c), indicating the corresponding particles to be θ-phase particles. Due to the large reaction volume relative to the relatively small dimensions of the intermetallic particle, the signal of magnesium from the adjacent matrix was collected, contributing to the weak Mg peaks in the EDX spectra of θ-phase particles. While the peaks of magnesium are relatively strong in the EDX spectra in Figures 5.12 (d)-(e), suggesting the corresponding particles to be S-phase particles. As mentioned in Chapter 4, the application of Kikuchi pattern, reflecting the crystallographic structure of the intermetallic particle, is an effective method to distinguish particles with similar shapes and compositions. Kikuchi patterns were obtained from the position 1 and position 3 using EBSD and indexed with the software automatically with the results shown in Figures 5.12 (f)-(i). The result from Kikuchi patterns is consistent with the conclusions from EDX analysis as mentioned above. With the direct information of its intrinsic crystallographic structure from the Kikuchi pattern, it provides solid evidence about the existence of S-phase and θ-phase the intermetallic particles cluster. 168
169 Chapter 5: Corrosion Behaviour of AA2024-T351 Aluminium Alloy Figure 5.12 (j) displays the scanning electron micrograph after the immersion in a 3.5 wt. % NaCl solution for 30 min. A large cavity is evident on the alloy surface, with narrow and dark bands in the vicinity of the cavity, indicating the corrosion of alloy matrix developed in the form of intergranular corrosion. The dimension of the cavity is comparable with that of the intermetallic particle cluster, suggesting the removal of the intermetallic particle cluster during the immersion testing, which was possibly due to the preferential dissolution of alloy matrix at its adjacency. The extensive attacked grain boundaries at the adjacent of the intermetallic particle cluster indicate the development of stable localized corrosion at the site, which is in good agreement with the previous work [72, 80]. The same analysis was repeated on another intermetallic particle cluster as shown in Figure 5.13 (a). Both EDX and EBSD analysis indicate that the cluster is comprised of S-phase and θ-phase particles with the corresponding results displayed in Figures 5.13 (b)-(d) and Figures 5.13 (e)-(g), respectively. Figure 5.13 (h) displays the surface appearance of intermetallic particle cluster after the immersion in a 3.5 wt. % NaCl solution for 30 minutes, exhibiting the similar corrosion features with that shown in Figure 5.12 (j). Trenching around the intermetallic particle cluster along with a cavity with the similar dimension to that of typical intermetallic particles is displayed. Additionally, attacked grain boundaries in the periphery of the intermetallic particle cluster are present, indicating the initiation of stable localized corrosion from the intermetallic particle cluster. The EDX analysis after the immersion testing was carried out at the locations pointed out by arrows shown in Figure 5.13 (h). It is revealed that the de-alloyed S-phase particle has a decreased content of Mg, with the absence of Mg peak in the EDX spectrum shown in Figure 5.13 (j) with respect to the pre-testing EDX spectrum at the corresponding site (Figure 5.13 (d)). The evident oxygen peaks in the EDX spectra for both θ-phase and S-phase particles (Figures 5.13 (i)-(j)) indicate the presence of corrosion product across the intermetallic particle cluster after the immersion testing. Furthermore, a mechanically-polished AA2024 alloy was employed to investigate the corrosion behaviour related to the intermetallic particle cluster. SEM observation was conducted on the alloy surface after the immersion in a 3.5 wt. % NaCl solution for 2 hours, with a typical region containing various intermetallic particle clusters shown in 169
170 Chapter 5: Corrosion Behaviour of AA2024-T351 Aluminium Alloy Figure 5.14 (a). Narrow gaps, namely trenching, are evident in the periphery of all intermetallic particles clusters, possibly due to the micro-coupling between the alloy matrix and the intermetallic particle cluster. Besides, the typical porous morphology was also developed on selective intermetallic particles, suggesting the selective dissolution within the intermetallic particle cluster. Figures 5.14 (b)-(d) show the typical intermetallic particle clusters on the alloy surface at increased magnifications, displaying similar corrosion features with those shown in Figure 5.14 (a). As shown in Figure 5.14 (b), a narrow band was observed at the adjacency of the intermetallic particle cluster (marked with the red arrow), indicating the development of grain boundary attack, which suggests the initiation of stable localized corrosion at the site. However, no obvious grain boundary attack was observed on other sites as shown in Figures 5.14 (c)-(d), suggesting that not all clusters of S-phase and θ-phase particles resulted in the initiation of stable localized corrosion. EDX mapping was carried out on a typical intermetallic particles cluster as shown in Figure 5.15 (a). As shown in Mn and Fe maps, the similar intensity of Mn/Fe between the intermetallic particle cluster and the alloy matrix indicates the cluster is comprised of S-phase and θ-phase particles. Several iron-rich regions were found around the intermetallic particle cluster, suggesting the existence of iron-rich particles on the alloy surface. The selective dissolution of Mg in S-phase particles results in the depletion of Mg in the intermetallic particle cluster, which also contributes to the copper enrichment of the S-phase remnant. Slight heterogeneous distribution of copper is displayed in the Cu map, which is likely to be the consequence of different levels of selective dissolution. The oxygen map suggests the accumulation of corrosion product on the surface of the cluster after the immersion testing Discussion Trenching Trenching around the intermetallic particle after the immersion testing has been widely studied, which is considered to be the initiation of pitting corrosion in aluminium alloys [18, 68, 84]. Previous work indicated that the development of trenching is attributed to the chemical dissolution of the adjacent alloy matrix. In Warner s work, it was revealed that the 170
171 Chapter 5: Corrosion Behaviour of AA2024-T351 Aluminium Alloy alkaline attack at the surrounding matrix results in the formation of trenching around the cathodic intermetallic particle [173]. Further, scanning ion-selective electrode technique was employed to measure the ph modification around the S-phase particle during the immersion testing, revealing the localized alkaline chemical condition with the ph ranging from 8 to The alkaline chemical condition, originated from the oxygen reduction, promotes the dissolution of the protective alumina film in the periphery of intermetallic particle and, consequently, lead to the initiation of trenching development around the S-phase particle as suggested in the literature [82]. In recent work, it has been generally accepted that micro-coupling between the cathodic intermetallic particle and the alloy matrix at its adjacent leads to preferential dissolution of the alloy matrix, which results in the development of trenching in the periphery of the particle [19, 21, 23, 70, 101]. Additionally, it was claimed that the dispersoid free zone around certain intermetallic particle also contributes to the development of trenching around the intermetallic particles. The dispersoid free zone with the size ranging from hundreds of nanometre to several micrometres leads to the increased electrochemical heterogeneity around the intermetallic particles, which facilitates the trenching development [18]. Therefore, it is believed that both the chemical and electrochemical activities contribute to the formation of trenching. The cathodic reaction on the intermetallic particle generates a local alkaline environment, leading to the breakdown of the protective alumina film in its periphery and, consequently, the initiation of the trenching development. Meanwhile, the local electrochemical heterogeneity results in the anodic dissolution of the alloy matrix at the adjacent of the intermetallic particle, which promotes the further development of trenching. It was revealed in previous work that both θ-phase particles and Al-Cu-Fe-Mn intermetallic particles are cathodic due to the more positive electrode potential with respect to that of the alloy matrix [80, 172]. As mentioned above, the combined effect of the local electrochemical heterogeneity (i.e. micro-coupling between the alloy matrix and the cathodic intermetallic particle) and the chemical dissolution (i.e. the local alkaline environment due to the reduction of oxygen) results in the preferential dissolution of the peripheral alloy matrix, contributing to the development of trenching around the intermetallic particles as shown in Figures
172 Chapter 5: Corrosion Behaviour of AA2024-T351 Aluminium Alloy On the contrary, the Mg containing S-phase has a more negative corrosion potential with respect to the alloy matrix, contributing to its anodic electrochemical activity during the immersion testing [74, 79, 80]. As a result, the S-phase particle undergoes selective dissolution with the porous structure developed, resulting in the profound decrease in the magnesium content, which will be discussed in the following session. However, the trenching in the periphery of S-phase particles is also displayed in Figures Such phenomenon has also been extensively studied [17, 67, 76, 77]. It is believed that the switching electrochemical nature of S-phase particle from anode to cathode results in the development of trenching. The selective dissolution of magnesium and possibly aluminium in the S-phase particle leads to the copper-rich nature of the S- phase remnant (Figure 5.2). Due to the cathodic nature of copper, the copper build-up in the S-phase remnant results in a positive shift of its electrochemical potential, contributing to the conversion of S-phase from anode to cathode with respect to the alloy matrix. After the electrochemical conversion, the trenching development in the periphery of S-phase particles is similar with that of θ-phase / Al-Cu-Fe-Mn intermetallic particles. Therefore, the localized alkalization along with the microcoupling between the S-phase remnant and the adjacent alloy matrix contributes to the formation of trenching in its periphery [17, 18, 78, 88], which is consistent with the results in the present study (Figures ). As mentioned in Chapter 4, Al-Cu-Fe-Mn intermetallic particles have evident variations in contents of alloying elements, such as Cu, Fe, Mn and possibly Si. The difference in compositions also results in the different crystallographic structures of Al-Cu-Fe-Mn intermetallic particles [21, 24]. The combined effect of compositional and structural difference contributes to the great dispersion in the kinetics of corrosion initiation or/ and propagation in Al-Cu-Fe-Mn intermetallic particles. As a result, the corrosion resistance of Al-Cu-Fe-Mn particles displays significant difference. After the immersion in NaCl solution for 24 hours, the development of trenching around the Al-Cu-Fe-Mn intermetallic particle displays significant heterogeneity (Figure 5.9). It is worth mentioning that the relatively inert nature of Al-Cu-Fe-Mn intermetallic particle and the local heterogeneity in both compositional and structural aspects facilitates the observation of the heterogeneous trenching in its periphery. 172
173 Chapter 5: Corrosion Behaviour of AA2024-T351 Aluminium Alloy Selective dissolution in intermetallic particles In addition to the micro-coupling between the intermetallic particles and the alloy matrix in the periphery, the selective dissolution behaviour, which is also termed as dealloying, has also been widely reported [17, 21, 67, 78, 88, 93, 96]. Generally, the dealloying process involves the preferential dissolution of active alloying elements from the intermetallic particle during the immersion testing, leaving a remnant rich in noble alloying elements, which is characterized by spongy morphology as a consequence of atomic re-arrangement [88]. Furthermore, the selective dissolution of the active alloying elements, as an anodic reaction, needs to be supported by equivalent cathodic current [82, 84]. Therefore, the existence of electrochemistry heterogeneity within the particle facilitates the occurrence of selective dissolution, which also leads to the development of local corrosion features. The local electrochemistry heterogeneity within the intermetallic particle is attributed to its compositional or/and structural inhomogeneity, which provides the driving force for the selective dissolution. The selective dissolution behaviour of S-phase particle has been widely explored [17, 67, 75-78]. It was revealed that the selective dissolution of Mg (and possibly Al) in an S-phase particle leads to a copper-rich S-phase remnant with spongy morphology on its surface, which is in good agreement with the present result (Figures ). Wang reported the compositional inhomogeneity in the S-phase intermetallic particle due to the heterogeneous distribution of Al 20 Cu 2 Mn 3 approximants. It was also suggested that the electrochemical heterogeneity within the S-phase particle facilitates the initiation of its selective dissolution due to the localized chemical condition modification [85]. Further, it was reported by King et al. that plastic deformation introduces the structural inhomogeneity in S-phase particles, leading to the formation of striation along certain orientation during the de-alloying of S-phase particles [87], with the similar phenomenon present in Figure 5.18 (d). In the present study, the selective dissolution behaviour is also evident in θ-phase particle with prolonged immersion time in NaCl solution. Spongy morphology of θ- phase particle was developed after the de-alloying as shown in Figure 5.5. Interestingly, the presence of porous features in the θ-phase particle first occurred to the region further away from the surface (Figures 5.5 (a)-(b)) and, subsequently, developed to the area near the surface with prolonged time (Figures 5.5 (c)-(d)). As displayed in related literature, ph around 4 as well as in the range from 8 to 11.2 facilitates the dealloying of 173
174 Chapter 5: Corrosion Behaviour of AA2024-T351 Aluminium Alloy S-phase particle [17, 96], suggesting the crucial role of chemical condition for the occurrence of selective dissolution in the intermetallic particle. Therefore, the phenomenon could be attributed to the necessary chemical condition to promote the development of dealloying. After the development of trenching in the periphery of the θ-phase particle, the bulk solution transports to the sub-surface area, resulting in the local electrolyte with different chemical condition. On one hand, the combined effect of the limited area of connection on the surface and the long diffusion path contributes to the establishment of the concentration gradient between the bulk solution and the localized electrolyte. Thus, the restricted exchange between the bulk solution and localized electrolyte is easily established beneath the alloy surface, resulting in the stabilisation of the localized electrolyte. On the other hand, the anodic dissolution of aluminium results in high concentration of aluminium ions in the localized electrolyte. With the rapid hydrolysis of aluminium ions, the ph of the local electrolyte decreases, generating a more favourable chemical condition for the selective dissolution of the θ-phase particle. Therefore, selective dissolution of θ-phase particle first occurs beneath the surface, and develops to the surface with prolonged immersion time. What s more, local heterogeneous electrochemistry from compositional and structural aspects also has a significant impact on the dealloying behaviour in θ-phase particles. Compositional heterogeneity of θ-phase particles was observed with second phase inclusions, namely S-phase, embedded in θ-phase particles (Figure 4.7). During the immersion testing, the θ-phase particle, S-phase inclusions within the θ-phase particle and the alloy matrix consist of a multi-coupling system, with the θ-phase particle as cathode and the alloy matrix and S-phase inclusions as anodes. The S-phase is more active and dissolves first, resulting in the local alkaline chemical condition due to the reduction of oxygen. It was suggested in related literature that the S-phase particle is supposed to be less stable in alkalinized chemical condition than in the NaCl solution with ph around 6 [88, 96]. As an analogy, the localized alkaline chemical condition could also trigger the initiation of the θ-phase particle dealloying. The mechanism is supported by the SEM micrographs shown in Figures 5.5 (c)-(d), with evident porous structure around the corrosion pits, which resulted from the removal of S-phase inclusions in the θ-phase particle. 174
175 Chapter 5: Corrosion Behaviour of AA2024-T351 Aluminium Alloy What s more, the heterogeneity of structure in the θ-phase particle is evident, with the non-uniform distribution of linear crystallographic defects shown in Figure As shown in Figures , the development of the porous banding structure (i.e. typical features of dealloying ) is evident in a θ-phase particle containing crystallographic defects, correlating the dealloying behaviour with the structure heterogeneity. Detailed examination of banding structure in de-alloyed θ-phase particles reveals that the orientation of the banding structure is consistent with the orientation of linear crystallographic defects in the region (Figure 5.8), correlating the propagation of banding structure with that of crystallographic defects. Additionally, the similar distance between the crystallographic defects (Figure 4.15) and that of banding structures also confirm the close relationship between banding structure and the crystallographic defects (Figure 5.7). Scrutiny of the morphology of the banding structure reveals the corroded volume within the banding structure is comprised of the intact islands and corrosion path network consisting of the small ligaments along certain orientations. In the present study, it was revealed that the ligaments within the banding structure are aligned with {112} and {110} oriented planes, suggesting the crystallographic features during the θ-phase dealloying (Figure 4.15 and Figures ). The orientation of the ligaments in the banding structure is consistent with that of the crystallographic defects in the corresponding θ-phase, further suggesting the close relationship between the crystallographic defects and the dealloying development in θ- phase. The influence of crystallographic defects on the selective dissolution behaviour has been studied by various researchers [81, 87]. In the work of Maier, it was found pitting corrosion preferentially initiates on slip steps in pure aluminium with severe plastic deformation [180]. It was revealed that the stable localized corrosion development is closely associated with the distribution of grain-stored energy in 2000 series aluminium alloys, indicating the dissolution of aluminium preferential occurs at the site decorated with high population density of crystallographic defects [102, 103, 135]. In Cu-Au alloy systems, it was claimed that the dealloying process is faster at slip steps relative to other regions, correlating the selective dissolution with the crystallographic defects [178]. More recent work conducted in AA2024-T3 aluminium alloy suggested that the striation along certain orientation developed in de-alloyed S-phase particle is attributed to the crystallographic defects caused by plastic deformation [87]. In summary, it is 175
176 Chapter 5: Corrosion Behaviour of AA2024-T351 Aluminium Alloy generally accepted that the selective dissolution is promoted with the existence of the crystallographic defects. Therefore, it is believed that the de-alloying banding structure preferentially develops following the orientation of crystallographic defects in θ-phase as shown in the present study (Figures ). Even though Al-Cu-Fe-Mn intermetallic particles display high corrosion resistance with relatively inert nature, the selective dissolution behaviour is evident after 24 hours immersion in a 3.5 wt. % NaCl solution, characterized by sharp corroded bands along certain orientation (Figure 5.11). The higher brightness of the banding structure in the backscattered electron micrograph indicates the enrichment of heavy alloying elements, possibly copper in this situation. Besides, the banding structure displays typical spongy morphology, corresponding to the selective dissolution behaviour in Al-Cu-Fe-Mn intermetallic particles. In addition to the heterogeneous distribution of alloying elements in an individual Al-Cu-Fe-Mn intermetallic particle (Figures ), the crystallographic defects along preferred orientation are also exhibited as shown in Figure The distance between the neighbouring linear crystallographic defects is comparable with that between the de-alloying bands, indicating the close relationship between the selective dissolution behaviour in Al-Cu-Fe-Mn particles with the crystallographic defects. Interestingly, the banding structure in the Al-Cu-Fe-Mn intermetallic particles is welldefined, exhibiting a sharper shape than that in the θ-phase particle while very few banding structures were observed in the S-phase particle in the present work. The explanation for the phenomena is as following. S-phase, with the high content of magnesium, is thermodynamically more prone to the selective dissolution of active alloying elements, i.e. Mg and Al, in this situation. Compared to the driving force provided by its composition, the influence of structural factor on the selective dissolution is relatively negligible. Therefore, very few banding structures along preferred orientation were generated during the de-alloying of S-phase particle (Figure 5.3). Relative to S-phase with high intrinsic tendency to de-alloying, θ-phase is relatively stable with more difficulty for selective dissolution, due to the absence of active alloying elements. Therefore, the driving force can only be obtained from its crystallographic structural heterogeneity, resulting in the dependence of selective 176
177 Chapter 5: Corrosion Behaviour of AA2024-T351 Aluminium Alloy dissolution in θ-phase on crystallographic defects. Therefore, the selective dissolution preferentially developed along the orientation of crystallographic defects. In other words, the crystallographic defect provides significant driving force for the selective dissolution of θ-phase and, consequently, affects the propagation of de-alloying in θ- phase, resulting in the development of banding structure in the direction parallel with that of the stacking fault (Figures ). To Al-Cu-Fe-Mn intermetallic particles with even more inert nature when exposed to a 3.5 wt. % NaCl solution, the driving force for selective dissolution is mainly from the structural factors, namely crystallographic defects. As mentioned in Chapter 4 (Figure 4.16), the sharp linear crystallographic defects were observed in Al-Cu-Fe-Mn intermetallic particles. Therefore, the de-alloying of Al-Cu-Fe-Mn intermetallic particle is characterized with sharp de-alloying banding structure due to the sharp linear crystallographic defects (Figure 5.11) Initiation of stable localized corrosion The relationship between the initiation of stable localized corrosion and the intermetallic particle cluster on the surface of AA2024 alloy has been extensively studied [71-73, 80, 100, 102]. The statistics analysis about the distribution of intermetallic particles on the alloy surface indicated its close relationship with the development of stable localized corrosion, suggesting that the stable localized corrosion preferentially initiates at the cluster of S-phase and θ-phase particles in AA2024 aluminium alloy [72, 100]. Further, the investigation of the large numbers of cross sections at the stable localized corrosion sites in AA2024-T351 aluminium alloy revealed that the localized corrosion initiation sites are always decorated with intermetallic particle clusters buried beneath the surface. EDX analysis of the intermetallic particle cluster suggests the existence of θ-phase or S-phase remnant with increased yield of copper, implying the correlation between the cluster of S-phase and θ-phase particles and the stable localized corrosion [71, 102]. In recent work, the employment of 3D characterization provides more comprehensive information of the stable localized corrosion site in AA2024-T351 aluminium alloy, revealing the presence of the intermetallic particle cluster at the initiation site of stable localized corrosion [71, 104, 181]. Therefore, the electron microscopy characterization of the stable localized corrosion site provides solid evidence to establish the correlation between the presence 177
178 Chapter 5: Corrosion Behaviour of AA2024-T351 Aluminium Alloy of S-phase and θ-phase particles cluster and the initiation of stable localized corrosion in AA2024 alloy. According to related literature, S-phase particle has a more negative corrosion potential with respect to that of the alloy matrix. And it was revealed that the θ-phase particle is cathodic relative to the alloy matrix, with a less negative corrosion potential [21, 79, 80]. Therefore, the micro-coupling within the intermetallic particle cluster comprising of S- phase and θ-phase provides increased driving force for the initiation of localized corrosion, which results in the preferential nucleation of the stable localized corrosion on the surface of AA2024 alloy. Additionally, it was revealed that cracks, voids and other defects are more popular within the intermetallic particle cluster, facilitating the breakdown of the protective alumina film with existing flaws, which further promotes the corrosion initiation[21, 81]. Therefore, the combination of local electrochemical heterogeneity and high population density of defects facilitates the initiation of stable localized corrosion at the intermetallic particle cluster in AA2024 alloy. However, the stable localized corrosion requires further development of corrosion after propagating away from the influence zone of the initiation site. As a result, the necessary chemical condition should be maintained, implying the crucial role of the special geometry structure on the stable localized corrosion development [71-73, 80, 100]. According to Galvele s work, to reach the ph for the propagation of stable localized corrosion (ph 3 to 4), the depth of the localized corrosion site is required to exceed 10nm, indicating the crucial role of geometry structure for the development of stable localized corrosion[105]. Further work indicated the development of stable localized corrosion in aluminium alloys is associated with the product of the current density and the pit depth, which is termed as pit stability product. When pit stability product of a certain pit is higher than 10-2 A/cm, the pitting propagation can be continuous, otherwise, it may be passivated after limited lifetime [107, 154, 182]. In more recent work, it was revealed that to maintain the stabilisation of necessary chemical condition at the corrosion front for the development of stable localized corrosion, a restricted diffusion between the bulk solution and the corrosion front is necessary, which is provided by the geometry structure of the localized corrosion site [71]. Therefore, a fraction of intermetallic particle clusters fail to be the initiation sites of the stable localized corrosion due to the absence of the necessary geometry (Figure 178
179 Chapter 5: Corrosion Behaviour of AA2024-T351 Aluminium Alloy 5.14). The geometry of the stable localized corrosion site will be further discussed in the section Stable localized corrosion Localized corrosion at the intermetallic particle cluster may lead to the development of stable localized corrosion, involving selective attack along the grain boundary network and the following crystallographic dissolution of grain interior in AA2024-T351 aluminium alloy. The stable localized corrosion site could be the potential site for cracking nucleation and the subsequent mechanical failure, leading to catastrophic consequence. Therefore, it is of significant importance to fully understand the development of stable localized corrosion in aluminium alloys Electrochemical behaviour The corrosion susceptibility of the AA2024-T351 aluminium alloy was assessed using electrochemical measurement in a 3.5 wt. % NaCl solution at ambient temperature with high purity nitrogen applied to obtain de-aerated testing solution. After 10 min immersion in a 3.5 wt. % NaCl solution, potentiodynamic scanning was employed to investigate the anodic polarization behaviour of AA2024-T351 aluminium alloy at the ambient temperature. Figure 5.16 (a) shows the voltage-current density curve of the AA2024-T351 alloy during the potentiodynamic polarization from -100 mv (vs OCP) to +700 mv (vs OCP). At the potential around -600 mv (vs SCE), a current surge, namely a significant increase in anodic current density, is present, indicating the breakdown of the alumina film on the alloy surface. The breakdown potential is also termed as pitting potential since the development of stable localized corrosion is closely associated with the breakdown of the protective alumina film. After polarized to +700 mv (vs OCP) in the NaCl solution, SEM was employed to examine the alloy surface and the cross section of the stable localized corrosion site. Figure 5.16 (b) displays scanning electron micrograph of the alloy surface, revealing attack along the grain boundary network and within the matrix of grains. Corrosion features associated with intermetallic particles, such as trenching in the periphery of the intermetallic particle and corrosion pits from the removal of the intermetallic particle, are also shown. Attack of the alloy matrix is evident in selected grain interior in contrast 179
180 Chapter 5: Corrosion Behaviour of AA2024-T351 Aluminium Alloy to the intact grain interior in the adjacent periphery, suggesting the heterogeneous corrosion susceptibility of individual grains on the alloy surface. Backscattered electron micrograph of the cross section at a stable localized corrosion site, generated by ultramicrotomy, is displayed in Figure 5.16 (c). Obviously, typical corrosion morphologies, namely attacked grain boundaries and corrosion pits of the alloy matrix, are present on the cross section along with a large open pit, which are similar with those on the alloy surface. It is also revealed that the grain boundary attack as well as the development of corrosion pits in the grain interior penetrates deep beneath the alloy surface. Figure 5.16 (d) displays the framed area in Figure 5.16 (c) at increased magnification, revealing a network of corrosion paths and enclosed islands of un-attacked alloy matrix within the attacked grain interior. It is noticed that the interface between the corrosion paths and the un-attacked islands displays small facets along certain orientation, suggesting crystallographic dissolution of the grain interior. As a result, the pits within the attacked grain interior are also termed as crystallographic pits. It is also noticed that corrosion pits within the grains preferentially developed in the periphery of the attacked grain boundaries, indicating that the selective attack of grain interior is closely associated with the grain boundary attack. Additionally, since the testing solution accesses to sub-surface area via attacked grain boundaries, the region further away from the alloy surface has relatively less exposure time to aggressive environment compared to the regions near the alloy surface. However, as shown in Figure 5.16 (d), the interior of grain A, which is close to the surface area, is nearly intact. While the inner region of grain B, which is further away from the alloy surface, is characterized with high population density of pits, revealing the heterogeneous corrosion susceptibility of individual grains. The corrosion features of the open pit are shown in Figure 5.16 (e), displaying attacked grain boundaries and corrosion pits within the attacked grain interior. The contour of the exposed interface, as shown in Figure 5.16 (e), indicates the exposure of grain boundary planes, since the contour of the interface generally fits that of typical grains under T351 temper (Figure 4.20), suggesting the high intergranular corrosion susceptibility in AA2024-T351 aluminium alloy. The crystallographic features of the corrosion pits 180
181 Chapter 5: Corrosion Behaviour of AA2024-T351 Aluminium Alloy within the attacked grain are also evident, displaying the polyhedral shapes bounded by relatively well-defined pit walls, as marked with red arrows in Figure 5.16 (e). In summary, two dominant corrosion morphologies, namely intergranular corrosion and crystallographic corrosion of the alloy matrix, are present in AA2024-T351 aluminium alloy, which are discussed in the following sections Intergranular corrosion In-situ monitoring of localized corrosion development Corrosion immersion testing consisted of immersion first in a 3.5 wt. % NaCl (H 2 O 2 ) solution and subsequently in deionized water was carried out to explore the corrosion behaviour of AA2024-T351 aluminium alloy at ambient temperature. Using in-situ video system during the immersion testing, morphological modification on the specimen surface was monitored with the results shown in Figure Figures 5.17 (a)-(b) display optical micrographs of AA2024-T351 aluminium alloy surface at the beginning and after 30 min immersion in a 3.5 wt. % NaCl (H 2 O 2 ) solution. It is evident that after 30 min immersion, bright features, namely corrosion product rings, are present on the specimen surface, indicating the development of stable localized corrosion in the area [72, 80, 102]. Figure 5.17 (c) displays the surface appearance of the alloy after the specimen was removed from NaCl testing solution and transferred into the testing solution containing only deionized water. Comparing the surface morphology in Figures 5.17 (b) and (c), less corrosion product was observed at the same location at the beginning of the immersion in deionized water, since part of corrosion product was removed during the transfer. During the immersion in deionized water, the rate of external corrosion reaction is considered to be negligible due to the absence of necessary chemical condition. Figure 5.17 (d) shows the surface morphology after 30 min immersing in deionized water. Comparing the surface appearance in Figure 5.17 (c) with that shown in Figure 5.17 (d), it is evident that increased amount of corrosion product is present at most localized corrosion sites, indicating the corrosion reaction continued during the immersion in deionized water. Additionally, some new corrosion product rings were developed on the alloy surface after the immersion in deionized water, as indicated with arrows in Figure 5.17 (d). After the specimen was removed from the NaCl solution, no new localized corrosion could initiate on the alloy surface 181
182 Chapter 5: Corrosion Behaviour of AA2024-T351 Aluminium Alloy due to the absence of external aggressive chemical condition. Therefore, the explanation for the appearance of newly-built corrosion product rings could be that either several localized corrosion sites developed during the immersion in NaCl (H 2 O 2 ) solution were not visible in the optical micrograph or the newly-built localized corrosion sites were the result from re-emerging of other localized corrosion sites during the immersion in deionized water. After the immersion in NaCl (H 2 O 2 ) testing solution for 30 min followed by another 30 min immersion in deionized water, a total 30 localized corrosion sites were observed in the area of mm 2 as shown in Figure 5.17 (d), giving a population density of sites per square millimetre. Similar analyses were repeated on the alloy surfaces after 30 min and 60 min immersion in the NaCl (H 2 O 2 ) testing solution. After the immersion in the identical testing solution for 30 min, 15 localized corrosion sites were detected in the area of mm 2, which gives the population density of sites per square millimetre. Similarly, after 60 min immersion, a total of 34 localized corrosion sites in the area of 1.6 mm 2 were observed, giving a population density of sites per square millimetre. These results are listed in Table General observation In order to gain insight into the mechanism of stable localized corrosion development in AA2024-T351 aluminium alloy, ex-situ SEM examination was employed to examine the corrosion morphology of the surface regions containing corrosion product rings after the immersion in NaCl (H 2 O 2 ) testing solution for 30 min followed with another 30 min immersion in deionized water. Figure 5.18 (a) displays the plan-view of a typical stable localized corrosion site after the immersion testing. Corrosion product ring with the dimension around 25 µm is evident at the stable localized corrosion site. Cracks around the corrosion product are also found due to dehydration after the removal from testing solution. Next to the localized corrosion site, another corrosion pit was observed with no sign of stable localized corrosion during the immersion in deionized water. However, due to the limited information from the surface plan view of the stable localized corrosion site, it is difficult to determine the stable localized corrosion mechanism. Therefore, the cross section of the stable localized corrosion site was obtained with ultramicrotomy to further explore the corrosion mechanism at the stable localized corrosion site. Figures 5.18 (b)-(d) display the cross section at the location 182
183 Chapter 5: Corrosion Behaviour of AA2024-T351 Aluminium Alloy indicated by line A-A in Figure 5.18 (a) at various magnifications. Figure 5.18 (b) was acquired by tilting the specimen 30, enabling the observation of both plan-view and cross section of the localized corrosion site, thereby correlating the corrosion morphology on the alloy surface with the corrosion features beneath the alloy surface. Cross-sectional examination, as shown in Figure 5.18 (c), clearly displays that the attacked second phase particle beneath the surface of the stable localized site in contrast to the absence of intermetallic particle beneath the neighbouring corrosion pit, which exhibited no sign of continuous corrosion during the immersion testing. Narrow and dark bands are evident in the matrix surrounding attacked second phase particle, revealing the corrosion of alloy propagates in the form of intergranular corrosion. Intergranular attack developed in all directions, laterally as well as in depth, with penetrating depth around 12 µm beneath the alloy surface. Figure 5.18 (d) displays the framed area in Figure 5.18 (c) at increased magnification, exhibiting an attacked intermetallic particle with typical spongy structure buried beneath the alloy surface. The banding structure along certain orientation is also evident in the attacked intermetallic particle, as indicated in Figure 5.18 (d). EDX analysis of the attacked intermetallic particle reveals an increased copper yield of the attacked intermetallic particle. The copper-rich nature and banding structure along preferred orientation at the attacked intermetallic particle suggest the particle is likely to be a S-phase remnant after dealloying of magnesium and aluminium, which is in good agreement with the previous work [87]. The same examination was repeated at two other typical stable localized corrosion sites with the corresponding cross sections shown in Figures 5.18 (e)-(f). Figure 5.18 (e) displays a backscattered electron micrograph of the cross section at the stable localized corrosion site with a second phase particle at the depth around 3 µm beneath the alloy surface. The attacked particle with partially porous appearance due to selective dissolution is present along intergranular corrosion propagation path. The propagation path of intergranular corrosion (IGC) was not affected by the particle since IGC developed further deep. Figure 5.18 (f) shows the cross section of another stable localized corrosion site. Beneath the alloy surface, attacked grain boundary, as the dominant corrosion morphology, penetrated around 20 µm beneath the alloy surface. However, no attacked intermetallic particle along the propagation path of IGC was detected. 183
184 Chapter 5: Corrosion Behaviour of AA2024-T351 Aluminium Alloy To compare with previous results, the immersion testing in the 3.5 wt. % NaCl (H 2 O 2 ) testing solution for different periods (30 min and 60 min in the present work) was carried out using AA2024-T351 alloy specimens of identical conditions. Cross section obtained with ultramicrotomy after the immersion testing was examined with SEM. The typical SEM micrographs after 30 min and 60 min immersion are shown in Figures , respectively. The corrosion morphological feature of these cross sections is similar with that after 30min immersion in NaCl (H 2 O 2 ) testing solution followed by 30min immersion in deionized water, with the attacked grain boundary as the dominant corrosion feature. It is revealed that intergranular attack penetrates deep beneath the surface, with little evidence of intragranular attack. However, the corrosion depth of each situation shows significant difference different cross sections of each situation were obtained to calculate the average corrosion depth and the maximum corrosion depth under the testing condition, with the results listed in Table 5.3. However, it is difficult to fully understand the corrosion mechanism from cross sectional results due to limited information from 2D characterization technique. Thus, 3D nano-tomography was employed to further examine the typical stable localized corrosion site. Backscattered electron micrographs of serial cross sections obtained with ultramicrotomy in a 10 nm step were acquired to perform 3D volumetric reconstruction. Figure 5.21 displays the 3D volumetric reconstruction result of a typical stable localized corrosion site, with selective transparency applied to the alloy matrix, yellow and red colours applied to represent corrosion product (i.e. aluminium hydroxide) and intermetallic particles, respectively, revealing the corrosion propagation paths at the stable localized corrosion site. Following the initiation on the alloy surface, the yellow colours, representing corrosion product, clearly outlined the interfaces between individual grains, indicating that corrosion preferentially developed along selected grain boundaries. Further, it is evident that the intergranular corrosion at the stable localized corrosion site developed in all directions, laterally as well as in depth and could emerge back to another position on the surface away from initiation site Active cathode It was pointed out in previous literatures that stable localized corrosion of aluminium alloys is limited by the cathodic current due to much higher current density from the alloy matrix than that of cathodic intermetallic particles [80, 84, 172]. The continuous development of the localized corrosion suggests the cathodic current is provided by 184
185 Chapter 5: Corrosion Behaviour of AA2024-T351 Aluminium Alloy active cathodes to support the further dissolution of alloy matrix when the stable localized corrosion develops away from the influence zone of the initiation site. In order to locate the cathodes in AA2024 alloy during the immersion testing, 10-4 M CuCl 2 was added to a 3.5 wt. % NaCl testing solution. Cu 2+ with relatively positive corrosion potential is considered as a strong oxidizer, resulting in the reduction of Cu 2+ preferentially occurring at the active cathodes on the alloy surface and, consequently, marking the active cathode with copper deposition. SEM examination was carried out on the alloy specimen after the immersion in a 3.5 wt. % NaCl solution for 40 min followed with the immersion in the testing solution containing NaCl of identical concentration and 10-4 M CuCl 2 as addictive for another 40 min. Figures 5.22 (a)-(c) display the backscattered electron micrographs of the tested specimen surface. It is revealed that the bright particles of nanometre scale dimensions, present individually or in cluster, are evident in the vicinity of selected intermetallic particles. Such nano-particles are likely to be deposited copper since copper has a relatively higher atomic number than other alloying elements in AA2024 alloy, resulting in the brighter appearance in the backscattered electron micrograph. The preferential deposition of copper in the periphery of selected intermetallic particles suggests the cathodic intermetallic particles to be the active cathodes on the alloy surface during the immersion in NaCl solution. The phenomenon is in a good agreement with generally-accepted corrosion mechanism that the micro-coupling between the cathodic intermetallic particle and the alloy matrix results in the selective dissolution of alloy matrix in its periphery [21, 23, 70], which also confirms that adding CuCl 2 to the testing solution to be an effective method for active cathode identification, as reported in related literature [158]. In order to explore the location of active cathode when external aggressive chemical environment is absent, modified corrosion immersion testing was conducted. After the immersion in a 3.5 wt. % NaCl solution for 40 min, the specimen was transferred to the testing solution containing deionized water and 10-4 M CuCl 2 for another 40 min. The tested specimen was examined using SEM with the corresponding micrographs shown in Figures 5.22 (d)-(f). As mentioned above, in backscattered electron micrographs, copper deposition should display a brighter appearance comparing to the alloy matrix and second phase particles due to its high atomic number. However, little evidence of 185
186 Chapter 5: Corrosion Behaviour of AA2024-T351 Aluminium Alloy bright features of nanometre scale dimensions is revealed on the alloy surface as shown in Figure 5.22 (d). Further observation indicates that the bright nano-particles could not be detected neither around attacked intermetallic particles as shown in Figure 5.22 (e) nor at the stable localized corrosion sites as displayed in Figure 5.22 (f), confirming the absence of deposited copper on the alloy surface under the testing condition. To explain the absence of copper deposition on the alloy surface as shown in Figures 5.22 (d)-(f), two possibilities should be considered. It is possible that no active cathode existed on the alloy surface. Otherwise, the concentration of CuCl 2 in the testing solution was too low to identify active cathode on the alloy surface during the immersion in deionized water. To verify the possible explanations, after 40 min immersion in NaCl solution followed with the immersion in deionized water for another 40 min, the specimen was immersed in a 10-2 M CuCl 2 solution for five seconds. Scanning electron micrographs of the alloy surface were obtained after the immersion with the results shown in Figures 5.22 (g)-(j). Figures 5.22 (g)-(h) display the backscattered electron micrographs of tested specimen surface, displaying the bright features of nanometre scale dimensions, supposedly deposited copper, on the alloy surface. The widely-existed copper deposition in the periphery of intermetallic particles indicates that the concentration of copper ion is high enough to mark the cathodes on the alloy surface. However, at the stable localized corrosion sites, no copper deposition was observed as shown in Figures 5.22 (i)-(j), which displays the framed areas in Figures 5.22 (g)-(h) at increased magnifications, respectively. Therefore, at the stable localized corrosion site, the active cathode is absent on the alloy surface during the immersion in deionized water, suggesting the presence of active cathode beneath the alloy surface since the corrosion is continuous during the immersion in deionized water (Figure 5.17) Intergranular corrosion front To further investigate the stable localized corrosion development in AA2024-T351 aluminium alloy, electron transparent foils obtained from the stable localized corrosion site were examined with TEM. Figure 5.23 (a) displays a bright field transmission electron micrograph of intergranular corrosion filament with active corrosion front followed by corrosion crevice induced by selective grain boundary attack. It is evident that the width of the corrosion front is 186
187 Chapter 5: Corrosion Behaviour of AA2024-T351 Aluminium Alloy similar with that of the crevice, indicating that corrosion preferentially develops along the grain boundary rather than into interior of the neighbouring grains. Along the corrosion crevice, a dark and narrow band with the dimension around 2 nm is evident along the interface between the corrosion product layer and the alloy matrix, in contrast to the absence of such dark band at the corrosion front. A high angle annular dark field (HAADF) micrograph of the corresponding area is shown in Figure 5.23 (b). The fine band along the crevice wall displays high brightness, whereas no bright appearance is present at the active corrosion front. Since the contrast in HAADF micrographs arises from the atomic number difference, the bright appearance suggests the enrichment of heavy alloying element in the fine band. Therefore, the fine band is thought to be a copper-enriched layer, since copper is the major alloying element with higher atomic number relative in AA2024 alloy. Furthermore, the chemical information of the fine band was confirmed by EDX analysis with the spectra shown in Figures 5.23 (c)-(d). Figure 5.23 (c) displays the EDX spectra from point 1 and point 2, as marked in Figure 5.23 (b), revealing the compositional difference between the alloy matrix and the fine band along corrosion crevice wall. Increased yield of copper is evident along the fine band since the copper peak in the corresponding EDX spectrum displays much higher intensity that that of alloy matrix, suggesting the presence of a copper-enriched layer along the interface between the alloy matrix and the corrosion product layer. Figure 5.23 (d) displays the EDX spectra from point 1 and point 3, as marked in Figure 5.23 (b). The intensity of copper peaks in both EDX spectra is similar as shown in Figure 5.23 (d), indicating the similar copper contents between the corrosion front and the alloy matrix, which, consequently, suggests the absence of copper build-up at the corrosion front. Additionally, EDX linescanning was conducted along line 1, as indicated in Figure 5.23 (b), revealing the distribution of alloying elements across the region containing an intact grain boundary and its surrounding alloy matrix. No obvious peak was detected along Cu and Mg lines, suggesting the relatively uniform distribution of Cu and Mg in the region. Therefore, little evidence of precipitate free zone or grain boundary segregation is revealed along the grain boundary. Additionally, to obtain the copper distribution in the intergranular corrosion front area, copper EELS mapping was carried out in the same region (Figure 5.23 (a)). The EELS 187
188 Chapter 5: Corrosion Behaviour of AA2024-T351 Aluminium Alloy map is shown in Figure 5.23 (f). It is evident that at the active intergranular corrosion front, no copper-enriched layer was observed whereas copper-enriched layer is evident along the corrosion crevice wall, displaying higher brightness with respect to that of the alloy matrix, which is in good agreement with EDX spectra in Figures 5.23 (c)-(d). Additionally, the homogeneous brightness between the intact grain boundary part and the alloy matrix further reveals the absence of copper depleted zone or copper grain boundary segregation along the attacked grain boundary area, which is consistent with EDX lines as shown in Figure 5.23 (e). Interestingly, as shown in Figure 5.23 (f), the brightness along the fine band is not uniform, indicating the heterogeneous distribution of copper build-up along the copper-enriched layer. It is believed that the uneven dissolution rate of aluminium contributes to the heterogeneous distribution of copper along the corrosion crevice. Detailed crystallographic structure of the copper-enriched layer is revealed in the high resolution transmission electron micrograph as shown in Figure 5.23 (g). It is evident that a copper-enriched layer with thickness around 2 nm is present between the corrosion product layer with amorphous structure and the alloy matrix, as indicated with the white arrow. The lattice image of the copper-enriched layer along with its corresponding fast Fourier transformation result of the framed area (inset Figure 5.23(g)) reveals the copper-enriched layer is comprised of Al 2 Cu phase, which is in good agreement with previous literature [168, 183, 184]. Figures 5.24 (a)-(d) display the HAADF micrographs of typical attacked grain boundaries after the immersion in a 3.5 wt. % NaCl solution for 1 hour and 8 hours, respectively. As shown in Figures 5.24 (a)-(b), after 1 hour immersion, both the attacked grain boundary behind the corrosion front and the intact grain boundary ahead the corrosion front are displayed. The narrow band with the thickness around 2 nm beneath the corrosion product layer displays higher brightness. Since the contrast is given by the difference of atomic number in HAADF micrographs, the increased brightness indicates the enrichment of heavy alloy elements, supposedly copper in the situation. Even though corrosion front followed the grain boundary network during the propagation, it is noticed that corrosion was not confined within the region immediately adjacent the grain boundary, but developed into the neighbouring grain interior. More detailed morphological information of the attacked grain boundary is shown in Figure 5.24 (b), displaying the corrosion preferentially developed into the grain interior of 188
189 Chapter 5: Corrosion Behaviour of AA2024-T351 Aluminium Alloy Grain B, which suggests the corrosion susceptibility difference between the neighbouring grains. Additionally, the corroded volume within the grain B displays a triangle shape as marked in Figure 5.24 (b), suggesting crystallographic features of the selective dissolution of the grain interior, which will be elucidated in the following session. What's more, significantly wider corrosion crevice is displayed with prolonged immersion time to 8 hours as shown in Figures 5.24 (c)-(d). It is evident that the grain boundary attack in AA2024-T351 aluminium alloy was not confined within the area immediately adjacent the grain boundary, but extended into the inner areas of the neighbouring grains, resulting in the increased width of the corrosion crevice with respect to that of the grain boundary area. As a result, the width of the corrosion crevice increases with the prolonged immersion time. Additionally, the thickness of the copperenriched layer along the corrosion crevice is around 2-3 nm thickness after 8 hours immersion, which is similar with that after 1 hour immersion. The similar thickness of the copper-enriched layer indicates the thickness of copper-enriched layer has reached its maximum, which is in good agreement with previous work [171, 185, 186]. To investigate the cathodic behaviour of the copper-enriched layer along the corrosion crevice, cathodic potentiodynamic polarizations of as-received AA2024 alloy and etched AA2024 alloy were conducted. Both as-received and alkaline-etched specimens were ground and polished to 1 µm. After the mechanical polishing, alkaline etching was carried out in 10 wt. % NaOH for 5 min followed by desmutting in 30 vol. % HNO 3 for 30 s. Surface treatments, such as alkaline etching, chemical polishing and electrochemical polishing, can lead to noble element enriched layer on the surface. In copper-containing aluminium alloy, the copper-enriched layer with the thickness around 2-3 µm has been extensively observed [168, 171, ]. To AA2024 alloy with relatively high content of copper element, after alkaline etching, a copper-enriched layer of similar thickness is expected to appear on the surface. Figure 5.25 (a) shows a HAADF micrograph of ultramicrotomed cross section of the AA2024 alloy after the alkaline etching, exhibiting the bright band with the thickness around 2-3nm along the interface between the residual alumina film and the alloy matrix. Since the contrast in HAADF micrographs origins from the atomic number difference, the result suggests the 189
190 Chapter 5: Corrosion Behaviour of AA2024-T351 Aluminium Alloy development of copper-enriched layer beneath the residual alumina film, which is in good agreement with previous work [171, 190]. A traditional three-electrode electrochemical cell with a standard calomel electrode as reference electrode was used. Cathodic potentiodynamic polarization was conducted in HCl-acidified 3.5 wt. % sodium chloride (ph=3) testing solution. Prior to the cathodic polarization, testing solution was de-aerated by inputting high purity nitrogen for 2 hours. The results of cathodic polarization are shown in Figure 5.25 (b). The potentiodynamic polarization curves of as-received and etched AA2024 alloy display similar shapes. However, the cathodic current density of the etched alloy is much higher than that of as-received alloy in a wide range of potential while the corrosion potential of the etched alloy is more positive than that of the as-received alloy due to the cathodic nature of copper [189]. As shown in Figure 5.25 (a) and Figures , the similarity of composition and dimension between the copper-enriched layer after alkaline etching and that developed along the corrosion crevice indicates the electrochemical behaviour of the etched alloy is similar with that of the copper-enriched layer in the corrosion front area. Due to the limited surface area covered by grain boundaries, the electrochemical behaviour of alloy matrix is similar with that of asreceived alloy. Additionally, the HCl-acidified 3.5 wt. % sodium chloride solution is a reasonable simulation as the electrolyte in the corrosion front area, which will be elucidated in the discussion session. Therefore, the copper-enriched layer could act as a cathode, providing relatively higher cathodic current density to promote the anodic dissolution at the corrosion front during the localized corrosion development The influence of crystallographic structure on intergranular corrosion As mentioned above, the heterogeneous corrosion susceptibility of grain boundaries is evident, resulting in the selective attack of grain boundaries in AA2024 alloy. It has been widely reported that compositional difference in the grain boundary area results in the selective attack along grain boundary network in aluminium alloys [18, 20, 27, 109, 110]. It was revealed that the precipitate along the grain boundary results in the depletion of certain alloying elements, leading to the development of precipitate/solute free zone along the grain boundary, which contributes to the electrochemical heterogeneity within the grain boundary area. The preferential dissolution of more anodic part within the grain boundary area results in the grain boundary attack [18, 20, 190
191 Chapter 5: Corrosion Behaviour of AA2024-T351 Aluminium Alloy 27]. In addition, the influence of alloying element segregation along grain boundary on the selective attack of grain boundary in aluminium alloys was also reported [116, 117]. At the typical stable localized corrosion site of AA2024-T351 aluminium alloy as shown in Figure 5.23, the influence of compositional difference on intergranular corrosion was examined. The HAADF micrograph along with the EDX analysis of the intact part of the grain boundary reveals the absence of compositional heterogeneity of the grain boundary area, indicating the selective attack of grain boundary could occur without obvious compositional difference. As mentioned in Chapter 4, only a small fraction of grain boundaries in AA2024-T351 alloy is decorated with compositional heterogeneity. With large number of grain boundaries examined, the grain boundary segregation of Mg/Cu along with grain boundary precipitates was only detected along a small fraction of grain boundaries in AA2024-T351 aluminium alloy (Figure 4.19) in the present work. The observation is in agreement with the previous work on AA2024-T351 aluminium alloy. It was claimed that little precipitates are generated along the grain boundary in T3/T351 temper condition, resulting in the absence of precipitate free zone along the grain boundary [102, 191]. There is no doubt that the compositional difference within the grain boundary area contributes to the development of intergranular corrosion. However, the extensive attacked grain boundaries on the alloy surface after the immersion testing suggests localized compositional difference fails to account for all attacked grain boundaries in AA2024-T351 aluminium alloy since the percentage of grain boundaries with evident compositional heterogeneity is much smaller. Therefore, structural factors also have the crucial role on the intergranular attack development in AA2024-T351 aluminium alloy. In the present work, two structural factors, i.e. grain boundary misorientation and grainstored energy, were investigated Grain boundary misorientation Grain boundary misorientation is defined as the orientation difference between two neighbouring grains. After EBSD analysis of the stable localized corrosion site on the alloy surface, crystallographic orientation of individual grains is obtained, thereby determining the grain boundary misorientation of the attacked grain boundary. 191
192 Chapter 5: Corrosion Behaviour of AA2024-T351 Aluminium Alloy After the immersion in a 3.5 wt. % NaCl solution for 8 hours, gentle polishing with 1 µm diamond paste was applied to remove the corrosion product layer on the alloy surface. The specimen was further plasma cleaned with GDOS to create a stress-free surface for EBSD analysis. Hundreds of attacked grain boundaries at randomly selected stable localized corrosion sites on the alloy surface after the immersion testing were analysed using EBSD to determine the corresponding grain boundary misorientation. A typical example is shown in Figure 5.26 (a) with the number on the grain boundary representing its misorientation. With a significant number of attacked grain boundaries examined, the distribution frequency of attacked grain boundary misorientation in corroded AA2024-T351 aluminium alloy is displayed as a histogram in Figure 5.26 (b), which is similar with the tendency of grain boundary misorientation distribution in asreceived AA2024 alloy (Figure 4.20). The frequency increases and reaches the maximum at the grain boundary misorientation around 40-50, following with the rapid decrease of frequency to zero after reaching 65. The similarity between the grain boundary misorientation distribution at stable localized corrosion sites and that of as-received AA2024-T351 aluminium alloys indicates that no evident correlation between grain boundary misorientation and the corrosion susceptibility during the immersion testing, revealing the limited influence of grain boundary misorientation on the selective attack of grain boundary in AA2024-T351 aluminium alloy Grain-stored energy The influence of grain-stored energy on the selective attack of grain boundary in AA2024-T351 aluminium alloy was investigated to explain the propagation of grain boundary attack at the stable localized corrosion. When the orientation difference between two neighbouring pixels in the individual grain (which indicates the orientation difference within the area is smaller than 15 in the present work) is higher than the threshold value (in the present work, defined as 1 ), the pixel pair is considered to be a misorientation, representing the existence of a dislocation, which contributes to the stored energy of the grain. Therefore, the density of misorientation within a grain reflects the density of dislocations in the grain. The stored energy of a pixel is determined by the misorientation relative to the neighbouring pixels. When the misorientation between two neighbouring pixels is 192
193 Chapter 5: Corrosion Behaviour of AA2024-T351 Aluminium Alloy above a selected threshold value, the stored energy of the pixel pair can be calculated using the Read-Shockley equation: γ s = γ 0 θ (A ln θ) where θ is the misorientation angle, γ 0 and A are constants. Then stored energy of an individual grain is determined by averaging the sum of stored energy of all pixels within the grain, which reflects the dislocation density of the grain [103]. The grain-stored energy map reveals the distribution of grain-stored energy with different levels of brightness. It is a grey-scale map, with high brightness representing high level of grainstored energy, namely high population density of dislocations. SEM micrograph of a typical stable localized corrosion site on the alloy surface is shown in Figure 5.27 (a), with the corresponding crystallographic orientation map in Euler s colour shown in Figure 5.27 (b). The localized distribution of attacked grain boundary on the surface indicates the heterogeneous corrosion susceptibility of grain boundaries in AA2024 alloy. Due to the low intensity of diffraction at the cavities on the alloy surface and the different crystallographic structure of second phase particles, parts of the alloy surface fail to be indexed, which is represented by black colour in the corresponding EBSD reconstruction maps. The grains-stored energy map as shown in Figure 5.27 (c) reveals the distribution of stored energy at the stable localized corrosion site with yellow lines applied to represent the high angle grain boundaries. Comparing the distribution of grain-stored energy with the SEM micrograph of the localized corrosion site, it is evident that attacked grain boundaries preferentially locate in the periphery of the grain with higher level of stored energy, correlating the population density of dislocations to the intergranular corrosion susceptibility in AA2024 alloy. EBSD analysis was also performed on the cross section of a typical stable localized corrosion site in AA2024-T351 aluminium alloy after 2 hours immersion in a 3.5 wt. % NaCl solution. Scanning electron micrograph along with the corresponding EBSD reconstruction maps are shown in Figures 5.27 (d)-(f). Unlike the alloy surface, various depths beneath the alloy surface indicates different exposing time to aggressive environment since the electrolyte transports to the sub-surface area via attacked grain boundary network, from the near surface area to the region deep beneath the alloy surface. However, in the Figure 5.27 (d), it is evident that the grain boundary A-A (as marked in Figure 5.27 (d)) near the alloy surface remained intact whereas the grain 193
194 Chapter 5: Corrosion Behaviour of AA2024-T351 Aluminium Alloy boundary B-B deep beneath the surface was preferentially attacked, indicating the intrinsic higher corrosion susceptibility of grain boundary B-B than that of grain boundary A-A and, consequently, confirming the heterogeneous corrosion susceptibility of grain boundaries in AA2024-T351 alloy. Figure 5.27 (f) displays the grain-stored energy distribution of the corresponding cross section. Comparing the SEM micrograph (Figure 5.27 (d)) with the corresponding grain-stored energy map (Figure 5.27 (f)), it is evident that attacked grain boundaries preferentially locate around the grain with higher level of stored-energy. Therefore, the grain boundary attack tends to occur at the grain boundaries surrounding the grain with higher stored energy, indicating the higher corrosion susceptibility of grain boundaries around the grains with higher stored energy Crystallographic corrosion As shown in Figure 5.16, the corrosion pit within the grain is one of the dominant corrosion morphologies after anodic polarization to -0.3 V (SCE) in a 3.5 wt. % NaCl solution at ambient temperature. The relatively well-defined shapes of typical corrosion pits indicate the crystallographic features of the intragranular corrosion, indicating the high corrosion susceptibility of crystallographic corrosion in the AA2024 alloy General observation Figure 5.28 (a) displays the SEM micrograph of a typical stable localized corrosion site on the surface of AA2024-T351 aluminium alloy after 15 hours immersion in a 3.5 wt. % NaCl solution at ambient temperature. Apart from the attacked grain boundaries, selective attack of grain interior is evident, as indicated by red arrows. Interestingly, the neighbouring grain, as marked with the white arrow, is nearly intact with the absence of corrosion pits, indicating the heterogeneous corrosion susceptibility of grains in AA2024-T351 alloy. In contrast to the widely-existed corrosion pits within the grain after 15 hours immersion, the alloy surface displays extensive attacked grain boundaries with little evidence of intragranular corrosion after 1 hour immersion in a 3.5 wt. % NaCl testing solution (Figure 5.20), suggesting that the grain interior attack is the late stage corrosion behaviour following with the intergranular corrosion in AA2024-T351 alloy. Figure 5.28 (b) displays the framed area in Figure 5.28 (a) at increased magnification, displaying the corroded volume within the grain interior, which is characterised with 194
195 Chapter 5: Corrosion Behaviour of AA2024-T351 Aluminium Alloy corrosion pits with the dimension ranging from several hundred nanometres to several microns. It is found that corrosion pits within the grain interior exhibit polyhedron-like shapes, indicating the crystallographic features of the grain interior attack. Two typical individual corrosion pits are shown in Figures 5.28 (c)-(d). It is revealed that the pits within the grain interior are bounded by scalloped corrosion fronts and rounded pit walls along certain orientation, suggesting the crystallographic dissolution of the alloy matrix. Therefore, the corrosion pits from the intragranular corrosion are termed as crystallographic pits due to its crystallographic features. Additionally, scrutiny of typical crystallographic pits in Figures 5.28 (c)-(d) reveals the ragged features along the pit walls, indicating the heterogeneous dissolution rates along the pit walls. Obviously, the crystallographic pit in AA2024-T351 aluminium alloy is much different from the crystallographic pits in high purity aluminium, which displays less well-defined shapes on a much finer scale with respect to typical crystallographic pits in pure aluminium [138, 140]. Cross section of a typical stable localized corrosion site after 15 hours immersing in a 3.5 wt. % NaCl solution was obtained with FIB as shown in Figure 5.28 (e). The corrosion feature of the cross section is similar with that shown on the alloy surface at the stable localized corrosion site, with crystallographic pits as the dominant corrosion morphology. The SEM micrograph of the cross section suggests the corrosion in the alloy matrix penetrated deep beneath the alloy surface in form of crystallographic dissolution, which is characterized by crystallographic pits with the dimensions ranging from hundreds of nanometres to several microns. Figure 5.28 (f) displays the framed area in Figure 5.28 (e) at higher magnification, displaying the exposed parallel planes, as indicated by red arrows, which provides direct evidence about the crystallographic feature of the grain interior attack in AA2024-T351 aluminium alloy The relationship between crystallographic pits and attacked grain boundaries More typical SEM micrographs of crystallographic corrosion are shown in Figures 5.29 (a)-(b), displaying the presence of crystallographic pits on the alloy surface after 15 hours immersing in a 3.5 wt. % NaCl solution. Since high population density of crystallographic pits tend to locate in the periphery of attacked grain boundaries instead of the grain interior further away from the grain boundaries (Figures ), it is 195
196 Chapter 5: Corrosion Behaviour of AA2024-T351 Aluminium Alloy suggested that grain interior attack characterized by crystallographic pits is closely associated with the attacked grain boundary. To establish the relationship between the attacked grain boundary and the crystallographic pits within the grain interior, SEM with various voltages were employed to examine a typical region containing attacked grain boundary and crystallographic pits, with the corresponding micrographs shown in Figures 5.29 (c)-(h). The voltage employed during the SEM observation determines the reaction volume between the electron beam and the specimen and, consequently, determines the depth of information that the SEM micrograph could display. With the increase of the electron voltage, the electron penetrates deeper beneath the surface, with the corresponding SEM micrograph exhibiting the information from the large volume beneath the surface. Figures 5.29 (c)-(d) show the crystallographic pits along with the neighbouring attacked grain boundary at the voltage of 1.5 kv. Due to its low voltage, the SEM micrograph displays the information collected from the superficial surface area, exhibiting the morphological features of crystallographic pits. Figures 5.29 (e)-(f) display the corresponding area at the voltage of 10 kv with larger reaction volume. The results exhibit more information beneath the alloy surface, displaying the crystallographic corrosion penetrates deep into the sub-surface area. Finally, Figures 5.29 (g)-(h) displays the identical area at higher voltage of 20 kv. Due to the increased reaction volume, the connection between the attacked grain boundary and the crystallographic pits of the grain interior beneath the alloy surface is obviously displayed, as indicated with the red arrow in Figure 5.29 (h), providing the direct evidence about the connection between the crystallographic pits and the attacked grain boundary. It is believed that the connection with the attacked grain boundaries enables the transportation of aggressive electrolyte into the grain interior, resulting in the selective attack of the grain interior. The 2D SEM micrograph at the voltage of 20 kv successfully confirms the connection between the attacked grain boundary and the crystallographic pits in the periphery. However, due to the inadequate information from the 2D characterization technique, it is still unclear about the connection of the crystallographic pits within the grain interior. Therefore, 3D characterization technique was employed to explore a typical localized 196
197 Chapter 5: Corrosion Behaviour of AA2024-T351 Aluminium Alloy corrosion site involving crystallographic pits after 15 hours immersion in a 3.5 wt. % NaCl solution. Figures 5.30 (a)-(b) show the 3D volumetric reconstruction of a typical region involving grain boundary attack and crystallographic pitting in AA2024-T351 aluminium alloy. As shown in Figure 5.30 (a), yellow and red colours were applied to represent the corrosion product and second phase particles, respectively. Both the attacked grain boundary and crystallographic pits in the grain interior were segmented with yellow colour due to the accumulation of corrosion product after the oxidization of aluminium. It is obvious that the attacked grain boundary is connected with the crystallographic pits within the grain interior. However, since the intermetallic particle is present as solid red volume that hides any feature behind, the distribution of crystallographic pits within the grain interior is unclear. Therefore, as shown in Figure 5.30 (b), the 3D volumetric reconstruction was rotated, with selective transparency and yellow applied to the intermetallic particles and corrosion product, respectively. It is evident that the crystallographic pits are connected to form a continuous corrosion path, which facilitates the transportation of electrolyte, providing necessary chemical condition for the further development of crystallographic pits. However, few small tiny yellow spots appear to be isolated, which exhibit no connection with neither other crystallographic pits nor the attacked grain boundary. The situation may be attributed to three technical reasons. The first reason is about the limited spatial resolution of SEM with respect to crystallographic pits of nanometre scale dimensions. Second, the only part of the localized corrosion was taken into account, indicating the isolated crystallographic pit may be connected with the other parts of the crystallographic dissolution site that is not displayed in the present image. It is also possible that the corrosion product generated by other corrosion behaviour, such as pitting corrosion related to individual intermetallic particles, was also segmented as yellow, which is actually independent from the crystallographic dissolution Crystallographic dissolution To identify the crystallographic features of the corrosion pits within grain interior, SEM micrograph of the crystallographic pits along with the corresponding Kikuchi pattern was obtained using SEM and EBSD, respectively. After 15 hours immersion in a
198 Chapter 5: Corrosion Behaviour of AA2024-T351 Aluminium Alloy wt. % NaCl solution, the AA2024-T351 alloy was gently polished with silicon suspension (i.e. OPS) to create a stress-free surface for further EBSD analysis and to keep the morphology of crystallographic pits intact during the surface treatment. A typical SEM micrograph together with the corresponding Kikuchi pattern is shown in Figures 5.31 (a)-(b). Due to the low diffraction intensity of the attacked alloy matrix, the Kikuchi pattern was obtained from the marked location on the surface of AA2024-T351 alloy, as shown in Figure 5.31 (a). Comparing the Kikuchi pattern with the morphology of the corrosion pit, it is obvious that crystallographic pit walls are in the directions generally parallel with low index planes of aluminium, as indicated by lines in various colour in the inset of Figure 5.31 (a). Unlike typical crystallographic pit bounded by {001} oriented planes, the rounded pit walls of crystallographic pits in AA2024 aluminium alloy could be composed of {001}, {011} and {111} oriented planes, contributing to the development of the random polyhedral shapes of the crystallographic pits. Even though both the limited resolution of Kikuchi pattern and the rounded pit walls in a fine scale might introduce some deviation during the determination of the orientation of pit walls, the combination between the Kikuchi pattern with the corresponding SEM micrograph is an effective method to reveal the crystallographic features of the corrosion pits developed in the grain interior of AA2024-T351 alloy STEM analysis To further understand the crystallographic pitting behaviour in AA2024 alloy, an electron transparent foil with the thickness around 15 nm was obtained with ultramicrotomy from the cross section of a typical stable localized corrosion site involving crystallographic dissolution. Figure 5.32 (a) displays a high angle annular dark field (HAADF) micrograph, displaying the general view of the localized corrosion site. Typical corrosion morphologies, including attacked grain boundaries and crystallographic pits, are displayed. Figure 5.32 (b) displays the HAADF micrograph of the framed area 1 in Figure 5.32 (a) at higher magnification, revealing the presence of an attacked grain boundary. Figure 5.32 (c) displays the framed area in Figure 5.32 (b) at higher magnification. The contrast in HAADF micrographs is highly sensitive to atomic number difference, indicating the enrichment of heavy element. Extensive work has confirmed that the 198
199 Chapter 5: Corrosion Behaviour of AA2024-T351 Aluminium Alloy chemical and electrochemical process could result in the copper build-up in the coppercontaining aluminium alloy, such as AA2024-T351 aluminium alloy [171, 187, 188, 192].Therefore, it is believed that a copper-enriched layer developed along the pit walls. Further, the heterogeneous distribution of copper build-up is evident with the absence of copper enrichment at the tip of the protrusion, as indicated with the red arrow. Additionally, the vertical relationship between the two rounded pit walls (delineated with two red lines in Figure 5.32 (c)) reveals the crystallographic features during the selective dissolution of the alloy matrix. Figure 5.32 (d) shows the framed area 2 in Figure 5.32 (a) at increased magnification, displaying a typical region at a stable localized corrosion site containing several crystallographic pits in the periphery of the attacked grain boundary. It is revealed that the crystallographic pits are either directly connected with attacked grain boundary or located at its adjacent, indicating the close relationship between the crystallographic pits and attacked grain boundary. Further, a fine bright band with the dimension around 2 nm is present along pit walls as well as the crevice wall induced by attacked grain boundary beneath the corrosion product layer. What s more, the crystallographic orientation relationship of the crystallographic pits is also evident, as indicated in the HAADF micrograph (Figure 5.32 (d)). In Grain A, the parallel relationship between pit walls of two individual crystallographic pits was delineated with red lines, indicating the selective dissolution of grain interior developed along certain crystallographic orientation. As displayed in Grain A, the neighbouring crystallographic pit walls displays a degree, corresponding to the angle between {111} plane and {001} plane of aluminium, revealing the crystallographic features in the selective attack of grain interior. The result is also consistent with the conclusions from Kikuchi pattern (Figure 5.31) that pit walls in AA2024 alloy consist of all low index crystallographic planes including {001}, {011} and {111} oriented planes instead of the dominant role of {001} planes as pit wall of typical crystallographic pits developed in high purity aluminium. In Grain B, two crystallographic pits were observed, displaying relatively well-defined polyhedral shapes, which are bounded by rounded pit walls along certain orientations. Both crystallographic pits display the typical vertical relationship between the neighbouring rounded pit walls as marked with yellow lines, corresponding to the angle between two {001} planes. The parallel relationship between the pit walls of two 199
200 Chapter 5: Corrosion Behaviour of AA2024-T351 Aluminium Alloy crystallographic pits (as marked with yellow lines) were also detected, providing solid evidence about the crystallographic features of the grain interior attack. Figures 5.32 (e)-(f) displays HAADF micrographs of the two typical crystallographic pits in Grain B, respectively. The copper-enriched layer with the dimension around 2 nm is evident along the rounded pit walls beneath the corrosion product layer, displaying higher brightness with respect to the alloy matrix in the periphery in the HAADF micrograph. The ragged features on the pit walls are also evident, indicating the uneven dissolution rate of aluminium. The chemical compositional information of the fine band is provided by EDX spectra from point 1 and point 2, as marked in Figure 5.32 (f). The EDX spectrum of point 1 along the fine band displays much higher intensity of copper peak than that of point 2, revealing the increased yield of copper along the fine band beneath the corrosion product layer relative to that in the alloy matrix. Further, copper EELS mapping of the corresponding crystallographic pit in Figure 5.32 (f) is also shown in Figure 5.32 (h), revealing the copper rich nature of the fine band at the interface between the alloy matrix and corrosion product layer, which is consistent with the EDX analysis result as shown in Figure 5.32(g). What s more, it is also revealed the uneven distribution of copper build-up along the pit wall since the brightness along the band beneath the corrosion product layer is non-uniform. The heterogeneity of copper build-up is crucial in the development of crystallographic corrosion, which will be elucidated in the following section Discussion Intergranular corrosion Internal corrosion When immersed in deionized water followed by the immersion in NaCl solution for 30 min, the alloy surface was directly exposed to deionized water. The absence of external aggressive medium results in the significant reduction of the support from the alloy surface for the further dissolution of alloy matrix. However, the further accumulation of corrosion product and the newly-formed corrosion product ring during the immersion in deionized water were evidently observed by in-situ video system, indicating the corrosion continued at the stable localized corrosion sites (Figure 5.17). 200
201 Chapter 5: Corrosion Behaviour of AA2024-T351 Aluminium Alloy Furthermore, the statistic results (Tables ) about the population density of stable localized corrosion sites on the alloy surface and the corrosion depth beneath the alloy surface confirm the continuous corrosion development at the stable localized corrosion site during the immersion in deionized water. According to results listed in Table 5.2, the population density of localized corrosion sites after 30 min immersion in NaCl (H 2 O 2 ) solution (condition 1) is lower than that after 30 min immersion in NaCl (H 2 O 2 ) solution followed by another 30 min in deionized water (condition 2), suggesting the corrosion continued during the immersion in deionized water. As mentioned above, during the immersion in deionized water, the absence of external aggressive medium significantly retarded the external corrosion on the alloy surface, suggesting that internal corrosion is responsible for the increased population density of localized corrosion sites. It is believed that internal corrosion continued to propagate beneath the alloy surface and might re-emerge to the surface during the immersion in deionized water. The propagation mechanism is confirmed by the 3D volumetric reconstruction as shown in Figure 5.21, displaying the corrosion propagates along grain boundary network in all directions and finally re-emerges on the alloy surface from the region away from its initiation site. The re-emerging of an existing localized corrosion site results in accumulation of corrosion product in the new region, namely the establishment of a new localized corrosion site, during the immersion in deionized water, which is responsible for the different localized corrosion sites density between condition 1 and condition 2. During the immersion in NaCl (H 2 O 2 ) solution, the initiation of localized corrosion can occur on the alloy surface, while no new localized corrosion could initiate during the immersion in deionized water due to the lack of external aggressive chemical condition [23, 71]. As a result, the localized corrosion site density under the testing condition of 30 min immersion in NaCl (H 2 O 2 ) solution followed by another 30 min immersion in deionized water (condition 2) is lower than that after 60 min immersion in NaCl (H 2 O 2 ) solution (condition 3). The combined effect of the initiations of new localized corrosion sites and re-emerging of existing localized corrosion sites during the second 30 min immersion contributes to the increase of the localized corrosion sites density on the alloy surface with prolonged immersion time in NaCl solution (i.e. the difference between condition 1 and condition 3). 201
202 Chapter 5: Corrosion Behaviour of AA2024-T351 Aluminium Alloy As listed in Table 5.3, it is evident that after 30 min immersion in NaCl (H 2 O 2 ) solution following with 30 min immersion in deionized water (condition 2), the average corrosion depth beneath the alloy surface displays a much higher value than that after the immersion in NaCl (H 2 O 2 ) solution for just 30 min (condition 1), suggesting the corrosion developed further deep beneath the alloy surface during the immersion in deionized water. Due to the absence of external aggressive chemical condition during the immersion in deionized water, the propagation of internal corrosion is attributed to the increased corrosion depth. However, the difference of the corrosion depth is negligible between condition 2 and condition 3, which indicates that the internal corrosion at the stable localized corrosion site is independent from external chemical surrounding. Even though there are numerous occasional factors that may affect maximum corrosion depth, the tendency of maximum corrosion depth remains similar with that of average corrosion depth. Therefore, the internal corrosion, which is independent from external chemical surrounding, significantly contributes to the stable localized corrosion propagation. The result is consistent with the previous work, in which it was suggested that internal corrosion current is around 40% of the total corrosion current, as estimated with scanning vibrating electron (SVE) [80] Chemical condition of the corrosion front area As mentioned above, the internal corrosion is independent from the external chemical condition, suggesting that the necessary chemical condition (low ph and high concentration of chloride) must be generated and maintained beneath the alloy surface to support internal corrosion. In the corrosion front area, aluminium oxidation provides high concentration of aluminium ions. Rapid hydrolysis of aluminium ions results in the acidification of the electrolyte in the corrosion front area, which is also rich in chloride for the charge balance. Therefore, the chemical condition in the corrosion front area (low ph and chloride-enriched) provides the necessary chemical condition for localized corrosion development, which prevents the active corrosion front from re-passivation [84, 105]. It has been revealed in related literatures that the geometry of stable localized corrosion site is crucial to maintain the chemical condition at the active corrosion front area [ ]. The geometrical structures of all stable localized corrosion sites in AA2024 alloy 202
203 Chapter 5: Corrosion Behaviour of AA2024-T351 Aluminium Alloy have the similar features, i.e. a relatively large reaction volume beneath the alloy surface along with a small area of connection to the bulk solution on the alloy surface as shown in Figures The small area of connection on the alloy surface to the bulk solution provides a restriction for the electrolyte exchange between the bulk solution and the corrosion front area, minimizing the influence of bulk solution on the local electrolyte in the corrosion front area. Further, intergranular corrosion penetrates deep beneath the alloy surface, resulting in the establishment of a restricted diffusion path between the bulk solution and the local electrolyte in the corrosion front area. When the diffusion path is sufficiently long (i.e. the reaction volume is large enough beneath the alloy surface), the concentration gradient from bulk solution to the electrolyte in the corrosion front area can be established, which contributes to the stabilisation of the chemical condition in the corrosion front area. Additionally, it is worth to mention that the presence of corrosion product along the attacked grain boundary generates the barrier for diffusion, partly or completely occluding the active intergranular corrosion crevice, which also contributes to the stabilisation of the chemical condition at the corrosion front. Therefore, the geometrical structure of the stable localized corrosion site, which is characterized by a large reaction volume beneath the alloy surface along with a small area of connection on the surface, contributes to the maintenance of the necessary chemical condition, i.e. low ph and chloride enriched, in the corrosion front area to promote further corrosion development Cathode in the corrosion front area The equivalent cathodic current must be provided to support the anodic dissolution of aluminium in the corrosion front area. Therefore, an effective cathode is necessary for the development of stable localized corrosion. As shown in Figure 5.22, no effective cathode is present on the alloy surface at the stable localized corrosion sites to support the further corrosion development during the immersion in deionized water following the immersion in NaCl solution for 40 min. However, as mentioned above, corrosion continues at the stable localized corrosion sites with further accumulation of corrosion product and increased corrosion depth beneath the alloy surface, indicting the presence of an effective cathode to support the 203
204 Chapter 5: Corrosion Behaviour of AA2024-T351 Aluminium Alloy continuous corrosion. Therefore, it is suggested that effective cathode that supports the continuous development of localized corrosion exists beneath the alloy surface. In the corrosion front area, as shown in Figure 5.23, a copper-enriched layer with a few nanometre thicknesses is present along the interface between the corrosion product layer and the alloy matrix. Due to the less negative Gibbs free energy per equivalent for the formation of copper oxide with respect to that of aluminium oxide, a copper-enriched layer around 2-3 nm thickness could be formed at the interface between the alloy matrix and the corrosion product layer during chemical and electrochemical process of coppercontaining aluminium alloys [168, 171, 187, 188]. The copper build-up along corrosion crevice wall leads to a positive shift of electrode potential, resulting in a more positive potential with respect to that of the peripheral alloy matrix due to the cathodic nature of copper [189]. As mentioned above, the necessary chemical condition is generated and maintained in the corrosion front area, which provides the necessary chemical condition for active cathode to support the further corrosion beneath the alloy surface. Therefore, the copper build-up along the corrosion crevice behind the active corrosion front can act as a cathode. Further, studies have shown that the cathodic reaction is the rate-limiting reaction in the corrosion of aluminium [80, 84], since the current density of anodic dissolution is several orders of magnitude higher than that with net cathodic current. Therefore, an effective cathode should provide relatively high cathodic current density along with a large spreading area to support the anodic dissolution at the corrosion front. Cathodic polarization curves of AA2024-T351 alloys shown in Figure 5.25 illustrate that the etched AA2024 alloys with a copper-enriched layer on its surface could provide much higher cathodic current density than as-received AA2024 alloy, which represents the alloy matrix due to the negligible surface area of grain boundaries. The result reveals that, relative to the alloy matrix, the copper-enriched layer can provide a higher cathodic current density in the corrosion front area as an effective cathode. Comparing to the exposed area of the alloy matrix at the corrosion front, the copper-enriched layer spreads along the corrosion crevice walls with a much larger area. Therefore, it is believed that the copper-enriched layer along corrosion crevice wall could provide high cathodic current to support the anodic dissolution of aluminium at the corrosion front. Therefore, the copper-enriched layer along the corrosion crevice wall could act as an 204
205 Chapter 5: Corrosion Behaviour of AA2024-T351 Aluminium Alloy effective internal cathode to support the corrosion propagation in the corrosion front area. The cathodic reduction preferentially occurs at the effective cathode, i.e. the copperenriched layer along corrosion crevice wall, resulting in the decreased concentration of protons, i.e. the increased ph of the localized electrolyte in its periphery. The less aggressive chemical environment could prevent the interior of the neighbouring grains along the attacked grain boundary from further attack. Therefore, corrosion propagation preferentially develops along the more anodic part, namely, the alloy matrix at the corrosion front with less or no copper build-up, which is consistent with the dominant corrosion feature as attacked grain boundaries in AA2024 alloy (Figures ). In summary, in the active corrosion front area with the necessary chemical condition (low ph and high concentration of chloride), the micro-coupling between the alloy matrix and the copper-enriched layer in provides the driving force for internal corrosion, contributing to the continuous corrosion development in AA2024-T351 aluminium alloy. The propagation mechanism is illustrated in the schematic diagram as shown in Figure Grain-stored energy After the establishment of stable localized corrosion in AA2024 alloy, the propagation path of intergranular corrosion is closely associated with the distribution of grain-stored energy, namely the population density of dislocations. The heterogeneous corrosion susceptibility in AA2024 alloy is evident. As revealed in Figure 5.27 (a), selected grain boundaries are attacked on the alloy surface. Since the grain boundaries were exposed to the bulk testing solution for the same period, the localized distribution of attacked grain boundaries on the surface suggests that intrinsic microstructure is responsible for different corrosion susceptibility of grain boundaries in AA2024 alloy. Further, the attacked grain boundaries at various corrosion depths on the cross section of the stable localized corrosion site (Figure 5.27 (d)) confirms the heterogeneity of intergranular corrosion, indicating the significant role of intrinsic microstructural factor on the corrosion susceptibility of the grain boundary. What s more, the intergranular attack is not confined within the area immediately adjacent to the grain boundary, but preferentially develops into the selected grain as shown in Figure The uneven attack on neighbouring grains along attacked grain boundary 205
206 Chapter 5: Corrosion Behaviour of AA2024-T351 Aluminium Alloy reveals the corrosion susceptibility difference of the grains, which may be attributed to the difference of grain-stored energy. Finally, with prolonged immersion time, the selective attack of grain interior indicates the heterogeneous corrosion susceptibility of individual grains since the selective grain was preferentially attacked while the other grain in the periphery remained intact as shown in Figure 5.28 (a). Comparing the grain-stored energy maps as shown in Figure 5.27 (c) and Figure 5.27 (f) with the corresponding SEM micrographs, it indicates that attacked grain boundaries tend to locate surrounding the grain with high stored energy, suggesting the grain boundaries around the grain with higher stored energy have higher corrosion susceptibility, which is consistent with conclusions from previous work [102, 103, 135]. The stored energy is associated with the population density of dislocations in the individual grain. It is believed that the fabrication history of the alloy is responsible for the variation of stored energy in individual grains. AA2024-T351 aluminium alloy is cold worked to achieve T351 temper, which introduced a high level of plastic deformation and resulted in high population density of dislocations. Plastic deformation is also promoted by the coil process involving sheet deformation, further increasing the population density of dislocations in AA2024-T351 aluminium alloy. The level of plastic deformation significantly depends on the number of active slip systems in the individual grain [174]. Since the number of available slip systems for an individual grain is determined by its grain orientation with respect to the fabrication direction, the different level of plastic deformation, namely dislocation density, is introduced depending on the corresponding grain orientation. Therefore, the distribution of dislocations exhibits evident grain orientation dependence, which, consequently, results in the non-uniform distribution of grain-stored energy in AA2024-T351 aluminium alloy. Three factors might contribute to the relationship between the corrosion susceptibility and grain-stored energy. First, high population density of dislocations in certain grain may result in a more thermodynamically unstable condition since metal atoms are at a higher energy level, leading to higher corrosion susceptibility of the grain. As a result, the grain boundaries around the thermodynamically unstable grains display higher corrosion susceptibility, leading to the preferential attack during the immersion testing [135]. Second, the influence of the dislocations density on the corrosion potential is 206
207 Chapter 5: Corrosion Behaviour of AA2024-T351 Aluminium Alloy likely to be another contributor for the selective corrosion behaviour in the aluminium alloy. In Brunner s work of aluminium alloys with ultrafine-grained microstructure, it was revealed that the dislocation density significantly affects the corrosion susceptibility and, consequently, corrosion morphology due to the shift of corrosion potentials of the alloy matrix and grain boundary [65, 193, 194]. The shift of corrosion potentials in AA2024-T4 aluminium alloy was also investigated by Salimon with dislocation density determined by line broadening in X-ray diffraction. It was revealed that corrosion potential exhibits the difference around mv between the alloy with a low level of dislocation density and that with higher density of dislocations [195]. The corrosion potential difference due to the heterogeneous distribution of dislocations may contribute to the corrosion susceptibility heterogeneity, leading to the selective grain boundary attack in AA2024-T351 aluminium alloy. Finally, the high population density of dislocations facilitates the diffusion of the alloying element atoms, which may result in the segregation along selective grain boundary with the typical examples in Figure The heterogeneous distribution of grain boundary segregation may contribute to the high corrosion susceptibility of selective grain boundaries, which is in agreement with the previous literature [116, 117, 196, 197]. Therefore, the heterogeneous distribution of grain-stored energy leads to the heterogeneous corrosion susceptibility of grain boundaries, resulting in the selective grain boundary attack in AA2024-T351 aluminium alloy Crystallographic corrosion Nucleation and propagation C. Nucleation Typical stable localized corrosion sites developed in AA2024-T351 aluminium alloy under different testing conditions (i.e. anodic polarization and immersion testing) exhibit attacked grain boundaries along with crystallographic pits in the grain interior. As shown in Figures , a high population density of crystallographic pits was preferentially located in the periphery of the attacked grain boundary instead of the grain interior further away from the grain boundary. The connection beneath the alloy surface between crystallographic pits and the attacked grain boundary was detected with SEM at 20 kv as shown in Figure And more convincingly, the 3D reconstruction result of the stable localized corrosion site involving crystallographic pits, as shown in 207
208 Chapter 5: Corrosion Behaviour of AA2024-T351 Aluminium Alloy Figure 5.30, confirms the connection between the attacked grain boundary and crystallographic pits in the interior of the neighbouring grain, suggesting that the development of crystallographic pits is closely associated with attacked grain boundaries. In addition, the 3D reconstruction result reveals that the crystallographic pits within an individual grain are connected with each other, allowing the transportation of testing solution into the sub-surface area via the continuous propagation path comprised of crystallographic pits and attacked grain boundaries. The absence of crystallographic pits at the localized corrosion site after 30 min immersion in a 3.5 wt. % NaCl solution (Figures ), whereas high population density of crystallographic pits is present with prolonged immersion time to 15 hours (Figure 5.28). The difference indicates that corrosion in AA2024 alloy propagates in form of intergranular corrosion at the early stage and, subsequently, develops into selective grain interior with prolonged immersion time. Therefore, the crystallographic pit is relatively late-stage corrosion morphology, following the development of intergranular corrosion in AA2024-T351 aluminium alloy. Considering the connection between the attacked grain boundary and crystallographic pits (Figures ) along with the development subsequence during the immersion testing (Figures and 5.28), it is suggested that the crystallographic pits initiate from the attacked grain boundary. Along the grain boundary, the change of crystallographic orientation is evident due to its complex atomic arrangement, resulting in the availability of various orientations. Meanwhile, the complex atomic arrangement facilitates the development of crystallographic defects along the grain boundary, which may promote the initiation of crystallographic pits. The uneven dissolution rates along the corrosion crevice during the grain boundary attack leads to the heterogeneous distribution of copper enrichment along the corrosion crevice wall (Figures 5.23 and 5.32), resulting in the presence of locations with less copper build-up. In the present study, these locations with less copper build-up are termed as weak points. Due to the cathodic nature of copper, the weak point with less copper build-up is anodic with respect to that with high level of copper enrichment. Therefore, the point with high level of copper build-up, i.e. the copper rich region, acts as an effective cathode when coupling with the weak point, promoting the anodic 208
209 Chapter 5: Corrosion Behaviour of AA2024-T351 Aluminium Alloy dissolution of alloy matrix underlying the weak point. As a result, the initiation of grain interior corrosion initiates at the weak point along the crevice wall. In addition, the possible existence of crystallographic defects at selective weak points could further facilitate the initiation of crystallographic dissolution into the grain interior area. The attacked grain boundaries in the periphery of crystallographic pits provides a continuous path for the transportation of aggressive testing solution to the sub-surface area, thereby providing the necessary chemical condition to support the initiation of crystallographic dissolution. As mentioned above, the establishment of restricted diffusion between the bulk solution and the electrolyte in the corrosion front area requires a sufficiently deep corrosion front. In other words, when the diffusion path between the weak point and the alloy surface is long enough, the necessary chemical condition can be maintained to support the initiation of intragranular corrosion. Therefore, the crystallographic pitting corrosion preferentially initiates deep beneath the alloy surface, which is in good agreement with that shown in Figure 5.32 (a) with the crystallographic pits preferentially locating further away from the alloy surface. D. Propagation It has been revealed in the related work that the development of crystallographic pits is the consequence of the preferential dissolution of fast-dissolving planes during the selective attack of grain interior, leaving the slow-dissolving planes as the crystallographic pit walls [158]. It has also suggested that each crystallographic wall has a limited lifetime and a large fraction of crystallographic pit walls are passivated while only small portion remain active during the immersion, indicating the crystallographic pitting is a discontinuous process [137]. As mentioned above, due to anodic dissolution of aluminium at the corrosion front, the localized concentration of aluminium ions increases, resulting in the acidification of the local electrolyte due to their rapid hydrolysis. Meanwhile, the increased concentration of chloride ions is necessary for the charge balance in the corrosion front area [71, 102]. Therefore, the localized electrolyte with low ph and high concentration of chloride provides the necessary chemical condition to avoid re-passivation and to support the further development of crystallographic dissolution within the grain. On the contrary, without the necessary chemical condition to prevent the active pit wall from repassivation, the crystallographic dissolution ceases. Therefore, it is believed that the 209
210 Chapter 5: Corrosion Behaviour of AA2024-T351 Aluminium Alloy limited lifetime of dissolution event during the crystallographic corrosion is closely associated with the necessary chemical condition. At the early stage of the crystallographic pitting propagation, the necessary chemical condition is generated and maintained in the corrosion front area in the similar way with that in the intergranular corrosion front. The attacked grain boundary penetrates deep beneath the alloy surface. Meanwhile, a small area of connection on the alloy surface minimizes the influence of the bulk solution on the localized chemical condition in the corrosion front area. Therefore, the geometrical structure of the stable localized corrosion sites results in a concentration gradient to stabilize the chemical condition in the corrosion front area, preventing the active pit wall from re-passivation and promoting the crystallographic dissolution of the grain interior. With the prolonged immersion time, the crystallographic pitting corrosion emerges to the alloy surface, increasing the area of connection with the bulk testing solution. Thus, in order to maintain the necessary chemical condition supporting the continuous dissolution at the active pit walls, an increased length of diffusion path is required to establish the restricted diffusion between the bulk solution and the local electrolyte in the corrosion front area. Therefore, some existing pit walls become re-passivated due to the absence of necessary chemical condition, which is consistent with the limited life time of localized dissolution events during the crystallographic corrosion [137]. Since the area of connection on the alloy surface gets large with more crystallographic pits developed on the alloy surface, the length of diffusion path required to maintain the necessary chemical condition increases, which results in the decreased number of existing active pit walls. Meanwhile, at selected weak points (with less copper build-up and possibly crystallographic defects) under the necessary chemical condition, the initiation of crystallographic pitting provides newly-built active pit walls. The dynamic balance between the re-passivation of existing pit walls and the development of newlybuilt pit walls contributes to the stable development of the crystallographic corrosion in AA2024 alloy. Besides the influence of necessary chemical condition on the development of crystallographic pits, the heterogeneous distribution of copper build-up, as shown in Figure 5.32, also has a significant impact on the propagation of crystallographic pitting. 210
211 Chapter 5: Corrosion Behaviour of AA2024-T351 Aluminium Alloy As mentioned above, the heterogeneous distribution of copper is evident along the pit walls, resulting in the two distinctive areas in the copper-enriched layer, namely: the copper-rich region as well as the weak point with less copper build-up. The region with increased copper build-up has a more positive corrosion potential due to the relatively positive electrode potential of copper and, consequently, act as an effective cathode when coupling with the regions with less copper build-up, namely weak points. The micro-coupling between the copper-rich area and the weak point supports further development of crystallographic corrosion at the weak point. With the further development of crystallographic corrosion at the selected weak points, the preferential dissolution of aluminium leads to further copper build-up at the corresponding points. The increased level of copper enrichment at the original weak point leads to the disappearance of the weak point, which results in the subsequent repassivation of the pit wall. The passivation of the pit wall indicates the cease of the crystallographic dissolution, corresponding to the limited lifetime of the dissolution event. As a result, it is believed that the active pit wall has a limited lifetime and the dissolution event of the weak point creases when the copper enrichment increases to a critical level at the original region of the weak point, which is consistent with the previous work [137]. Meanwhile, weak points with less copper build-up could be generated at other sites due to the uneven dissolution rate of aluminium. The generation of new weak points enables the initiation of new crystallographic dissolution events, resulting in the continuous crystallographic dissolution at the stable localized corrosion site. And the various locations of weak points lead to the development of crystallographic corrosion in various directions, resulting in various morphologies of crystallographic pits as discussed in the following section. The balance between the generation of new weak points and the disappearance of existing weak points contributes to the stable crystallographic pitting in AA2024 alloy. The nucleation and propagation mechanism of crystallographic pit is revealed in the schematic diagram as shown in Figure Crystallographic pits morphology A. Crystallographic feature Even though the morphology of crystallographic pits in AA2024 aluminium alloy is not as well-defined as that of the typical crystallographic pits developed in high purity 211
212 Chapter 5: Corrosion Behaviour of AA2024-T351 Aluminium Alloy aluminium, the crystallographic features are still evident during the selective attack of grain interior in AA2024 alloy. The crystallographic pits developed in different testing conditions exhibit relatively well-defined polyhedral shapes bounded by scalloped corrosion fronts and step-like pit walls along certain orientations as shown in Figure 5.16 and Figures Further, the cross section as shown in Figure 5.28 (e) exhibits the exposed parallel crystallographic planes, revealing the crystallographic features during the selective attack of grain interior. Additionally, the typical HAADF micrograph of localized corrosion site also reveals the orientation relationship of pit walls, confirming the crystallographic features of grain interior attack in AA2024 alloy (Figure 5.32). More convincingly, Kikuchi pattern obtained by EBSD (Figure 5.31) provides the direct evidence to support the crystallographic feature of grain interior attack. Comparing the orientation of pit walls with the crystallographic orientation of the alloy matrix as identified by Kikuchi pattern, it was revealed that most of rounded pit walls are roughly aligned with the selected Kikuchi lines, indicating the pit walls develop in the directions parallel with the low index orientation planes, i.e. {001}, {011} and {111} planes. B. Pit morphology It has been reported that typical crystallographic pit in high purity aluminium is bounded by well-defined {001} oriented plane, which is the slowest-dissolving plane of all three low index crystallographic planes [139, 152] with the highest thermodynamic stability [140, 147]. What s more, it was revealed that the development of crystallographic pits is attributed to the disappearance of fast-dissolving planes with less thermodynamic stability, showing no direct relationship with grain boundary attack [138, 139, 147, 152]. However, as discussed above, the crystallographic pit in AA2024- T351 alloy is considered to initiate from attacked grain boundary and the crystallographic pits in AA2024-T351 aluminium alloy are bounded by rounded pit walls on a finer scale. In the present work, it is believed that the difference in crystallographic pit morphology between the AA2024-T351 aluminium alloy and high purity aluminium is mainly attributed to the formation of a copper-enriched layer along the pit wall with the detailed explanations as follows. 212
213 Chapter 5: Corrosion Behaviour of AA2024-T351 Aluminium Alloy First, the crystallographic pit in AA2024 aluminium alloy is bounded by pit walls following {001}, {011} and {111} planes with no evident preference in contrast to the dominant role of slow-dissolving planes {001} as pit walls in pure aluminium. It was revealed that, with the addition of copper in aluminium, the breakdown potentials of single crystal Al-Cu alloys exhibit little orientation dependence. Further, the current densities at the breakdown potential during the anodic polarization of single crystal Al- Cu alloys were similar [141], indicating all low index planes with copper enrichment have similar electrochemical behaviours. As a result, with the decoration of copper build-up, the thermodynamic stability and the dissolution rate of {001}, {011} and {111} planes are close to each other. In the present study, the HAADF micrographs (Figure 5.32) obviously show the presence of copper build-up along the crystallographic pit walls beneath the corrosion product layer in AA2024 alloy. Therefore, all three low index planes could exist as the crystallographic pit walls in AA2024 alloy. Additionally, an alternative explanation for the existence of {011} and {111} planes as crystallographic pit walls, which are always considered as less favourable as the crystallographic planes with respect to {001} plane, is that the crystallographic pit is in the transitional condition. However, it is less likely that way since no preferred orientation is present and all three low index planes are widely existed as the pit walls (Figure 5.31). Second, the rounded pit wall decorated with ragged features is another difference between the morphology of the crystallographic pit in high purity aluminium and that in AA2024 alloy. It is believed that the difference is also attributed to the copper-enriched layer along the crystallographic pit walls. At the initial stage, the selective dissolution of aluminium preferentially occurs at the kink edge [141], which, consequently, leads to the copper build-up at the corresponding site. As mentioned above, the copper enrichment protects the underlying alloy matrix and facilitates the dissolution of the adjacent alloy matrix. As a result, the anodic dissolution of aluminium at the kink edge is retarded due to the copper build-up. Meanwhile, the dissolution on two adjacent terraces next to the kink edge accelerates with the copper build-up at the edge acting as an effective cathode, which leads to the development of rounded pit walls around the crystallographic pits. What s more, the uneven dissolution rate of the alloy matrix leads to the heterogeneous distribution of copper enrichment, resulting in the development of weak points with less copper build-up. The copper enrichment along the pit walls 213
214 Chapter 5: Corrosion Behaviour of AA2024-T351 Aluminium Alloy protects the alloy matrix underlying the copper rich regions and promotes the dissolution at the weak points. As a result, protrusions are generated, leading to the ragged features along the pit wall. Finally, the crystallographic pit in AA2024-T351 alloy exhibits on a much finer scale comparing with that in pure aluminium. The finer scale of crystallographic pit in AA2024-T351 alloy is closely associated with the limited lifetime of the individual pit wall during the crystallographic corrosion. As mentioned above, the weak points act as the preferential dissolution site before the passivation. With the necessary chemical condition, the lifetime of dissolution event of the pit wall is determined by the copper enrichment level of the weak point. When the copper build-up reaches to a critical level during the crystallographic dissolution, the dissolution event ceases along with the repassivation of the corresponding pit wall. Comparing with the crystallographic pit wall in aluminium under the same chemical condition, the crystallographic pit wall in AA2024 alloy developed from the weak points could be re-passivated much easier due to the extra protection from the copper build-up, which further deceases the lifetime of individual pit wall. Therefore, the activation and re-passivation of crystallographic pit walls happen in a higher frequency, resulting in a finer scale of the typical crystallographic pit in AA2024 alloy [137]. 214
215 Chapter 5: Corrosion Behaviour of AA2024-T351 Aluminium Alloy 5.3 Conclusions Corrosion behaviour of constituent intermetallic particles After 30 min immersion in a 3.5 wt. % NaCl (H 2 O 2 ) solution, due to the selective dissolution of Mg, there was a significant decrease of Mg content in the S-phase particle, which resulted in the copper-rich S-phase remnant. Porous structure was observed in the S-phase remnant, which is comprised of copper rich nano-particles with the dimensions ranging from 10 nm to 40 nm. The S-phase switched from anode to cathode relative to the alloy matrix due to the increased copper content in the S-phase remnant. Then, the localized alkaline condition generated by the oxygen reduction resulted in the breakdown of the protective alumina film around the S-phase remnant. The galvanic coupling between the S-phase remnant and the adjacent alloy matrix led to the preferential dissolution of the adjacent alloy matrix, which, consequently, resulted in the development of trenching in its periphery. Trenching was present in the periphery of the θ-phase particle after 30 min immersion in a 3.5 wt. % NaCl (H 2 O 2 ) solution, suggesting its cathodic nature with respect to the alloy matrix. In addition, selective dissolution also occurred in the θ-phase particle, resulting in evident compositional and morphological modification. EDX analysis indicated the increased copper content of the θ-phase particle remnant. The corrosion pits, due to the removal of S-phase inclusions from the θ-phase particle, were detected. Further, the banding structure, which is comprised of small ligaments with the typical width around 10 nm and enclosed intact islands, developed along the preferred orientation during the selective dissolution. It was believed that the development of dealloyed banding structure is closely associated with crystallographic defects in the θ- phase particle. In contrast to the active nature of S-phase, the Al-Cu-Fe-Mn intermetallic particles are relatively inert during the immersion testing, showing little modification after 2 hours immersion in a 3.5 wt. % NaCl solution. With prolonged immersion time, trenching was observed in the periphery of the Al-Cu-Fe-Mn intermetallic particle. Additionally, selective dissolution also occurred in Al-Cu-Fe-Mn intermetallic particles after 20 hours immersion in a 3.5 wt. % NaCl solution, resulting in the development of porous banding structure along certain orientation. 215
216 Chapter 5: Corrosion Behaviour of AA2024-T351 Aluminium Alloy Intergranular corrosion In the corrosion front area, the chloride-enriched electrolyte is acidified due to the rapid hydrolysis of aluminium ions, providing the necessary chemical condition to prevent the corrosion front from re-passivation. Further, a typical stable localized corrosion site in the AA2024-T351 aluminium alloy displays the geometrical structure characterized by a large reaction volume beneath the alloy surface together with a small area of connection to the bulk testing solution on the alloy surface. The geometrical structure of the stable localized corrosion site results in the restricted diffusion between the electrolyte in the corrosion front area and the bulk solution, contributing to the maintenance of the necessary chemical condition in the corrosion front area. Therefore, with a copperenriched layer along the corrosion crevice wall as an effective internal cathode, the localized corrosion continues with anodic dissolution of aluminium at the active corrosion front. In the AA2024-T351 aluminium alloy, intergranular corrosion could occur at the grain boundary with no precipitates or segregations, suggesting the crucial role of structural factors in the intergranular corrosion development. It was revealed that the frequency distribution of attacked grain boundary misorientations is similar with that in asreceived alloy, indicating the limited influence of grain boundary misorientation on the corrosion susceptibility of the grain boundary. Further, it was found that the propagation path of the intergranular corrosion is closely linked to the distribution of grain-stored energy, namely the density of dislocations. EBSD analysis revealed that attacked grain boundaries preferentially locate around the grain with relatively high level of stored energy, correlating the corrosion susceptibility with the population density of dislocations Crystallographic corrosion Following the intergranular corrosion development, crystallographic pits initiate at the weak points along attacked grain boundaries. The weak point is characterized by less or no copper build-up, which is possibly associated with the presence of crystallographic defects. 216
217 Chapter 5: Corrosion Behaviour of AA2024-T351 Aluminium Alloy After the initiation of crystallographic dissolution, the crystallographic pit develops to form pit walls following three low index planes (i.e. {001}, {011} and {111} planes) for the maximum thermodynamic stability. During the development of crystallographic dissolution, the geometrical structure of the typical localized corrosion site (a large reaction volume beneath the alloy surface along with a small connection on the alloy surface) contributes to the maintenance of the necessary chemical condition (low ph and chloride rich) at the corrosion front, which prevents the active pit wall from re-passivation. Meanwhile, the preferential dissolution of aluminium at the weak point leads to the increased copper build-up, which results in the disappearance of the weak point and, consequently, contributes to the re-passivation of the corresponding pit wall. Therefore, the combined effect of copper build-up at the weak point and localized chemical condition determines the lifetime of the dissolution event along the pit wall. When the weak point disappears, the corresponding pit wall becomes re-passivated and the lifetime of the dissolution event is over. Meanwhile, another weak point could be generated at another site due to uneven intrinsic dissolution rates of aluminium, leading to the subsequent development of a new crystallographic pit. The process repeats, resulting in the continuous development of crystallographic corrosion. Further, it was also revealed the crystallographic pit morphology is significantly affected by the copper build-up along the pit walls, which leads to the development of polyhedron-shaped crystallographic pits bounded by step-like pit walls and scalloped corrosion fronts in the AA2024-T351 aluminium alloy. 217
 (b) (c)")

")
-(d) Stable localized corrosion")
218 Chapter 5: Corrosion Behaviour of AA2024-T351 Aluminium Alloy (a) (b) (c) (d) Figure 5.1: Scanning electron micrographs of AA2024-T351 aluminium alloy surface (a) General view before the immersion, (b) General view after the immersion for 30 min, (c)-(d) Stable localized corrosion site of marked area in (b) at increased magnification. 218

 Figure 5.")
219 Chapter 5: Corrosion Behaviour of AA2024-T351 Aluminium Alloy (a) (b) (c) (d) Figure 5.2: To be continued. 219
 General view before the immersion, (b) General view after the immersion for 30")
 High resolution SEM micrograph after the immersion of particle B, (g) EDX spectrum after the immersion of")
220 Chapter 5: Corrosion Behaviour of AA2024-T351 Aluminium Alloy (e) (f) (g) (h) Figure 5.2: Scanning electron micrographs and corresponding EDX spectra (a) General view before the immersion, (b) General view after the immersion for 30 min, (c) EDX spectrum before the immersion of particle A, (d) EDX spectrum before the immersion of particle B, (e) High resolution SEM micrograph after the immersion of particle A, (f) High resolution SEM micrograph after the immersion of particle B, (g) EDX spectrum after the immersion of particle A, (h) EDX spectrum after the immersion of particle B. 220

221 Chapter 5: Corrosion Behaviour of AA2024-T351 Aluminium Alloy Table 5.1: Compositions of particle A, particle B and the alloy matrix (as shown in Figure 5.2) before and after the immersion in a 3.5 wt. % NaCl solution (wt. %). 221
 (b) (c) (d)")


 Backscattered electron")
222 Chapter 5: Corrosion Behaviour of AA2024-T351 Aluminium Alloy (a) (b) (c) (d) Figure 5.3: Scanning electron micrographs of a typical S-phase particle after 30 min immersion in a 3.5 wt. % NaCl solution (a) Secondary electron micrograph, (b) Backscattered electron micrograph, (c)-(d) Typical areas in the S-phase particle at higher magnifications. 222
 (b) (c) (d) Figure 5.")


-(c) At increased magnifications, (d)")
223 Chapter 5: Corrosion Behaviour of AA2024-T351 Aluminium Alloy (a) (b) (c) (d) Figure 5.4: Transmission electron micrographs and corresponding diffraction pattern of an ultramicrotomed foil of AA2024-T351 alloy after the immersion in a 3.5 wt. % NaCl solution for 1 minute (a) General view, (b)-(c) At increased magnifications, (d) Diffraction pattern of the de-alloyed area in the S-phase particle. 223
 (b) (c) (d) Figure 5.")


-(d) Scanning electron micrographs of typical")
224 Chapter 5: Corrosion Behaviour of AA2024-T351 Aluminium Alloy (a) (b) (c) (d) Figure 5.5: (a)-(b) Scanning electron micrographs of a typical θ-phase particle after the immersion in a 3.5 wt. % NaCl solution for 30 min followed by GDOS to clean the alloy surface after the immersion, (c)-(d) Scanning electron micrographs of typical θ- phase particles after the immersion for 2 hours. 224
 (b) (c)")

-(b) A severely")
-(d) Typical θ-phase")

225 Chapter 5: Corrosion Behaviour of AA2024-T351 Aluminium Alloy (a) (b) (c) (d) (e) (f) Figure 5.6: Scanning electron micrographs of typical de-alloyed θ-phase particles with banding structures (a)-(b) A severely de-alloyed θ-phase particle at different magnifications, (c)-(d) Typical θ-phase particles with mild de-alloying, (e)-(f) Cross sections of a typical de-alloyed θ-phase particle generated using focussed ion beam. 225
 (b) 12-1 (c) (d) Figure 5.")
")
 Increased magnification, (d) High")

226 Chapter 5: Corrosion Behaviour of AA2024-T351 Aluminium Alloy (a) (b) 12-1 (c) (d) Figure 5.7: Transmission electron micrographs and corresponding diffraction pattern of a de-alloyed θ-phase particle (a) General view, (b) Corresponding diffraction pattern with indexed results, (c) Increased magnification, (d) High resolution TEM micrograph displaying the linear defects, inset: corresponding FFT result, in consistent with diffraction pattern. 226
 (b) (c) (d) {110} Figure 5.")
 HAADF micrograph of typical ligaments in the")
 High resolution HAADF micrograph of")


227 {112} Chapter 5: Corrosion Behaviour of AA2024-T351 Aluminium Alloy (a) (b) (c) (d) {110} Figure 5.8: (a) HAADF micrograph of a de-alloyed θ-phase particle, (b) HAADF micrograph of typical ligaments in the de-alloyed θ-phase particle, with the corresponding EDX copper map inset, (c) High resolution HAADF micrograph of the linear crystallographic defects marked in (a), with the corresponding FFT results inset, revealing the crystallographic orientation, (d) HAADF micrograph of the typical ligaments in the de-alloyed θ-phase particle, with the orientations marked. 227
 (b) Figure 5.")

228 Chapter 5: Corrosion Behaviour of AA2024-T351 Aluminium Alloy (a) (b) Figure 5.9: Scanning electron micrographs of Al-Cu-Fe-Mn intermetallic particles after the immersion in a 3.5 wt. % NaCl solution for (a) 2 hours, (b) 24 hours. 228


-(d), in the sequence of Al,")
229 Chapter 5: Corrosion Behaviour of AA2024-T351 Aluminium Alloy (a) (b) (c) (d) (e) Figure 5.10: Typical Al-Cu-Fe-Mn intermetallic particles after the immersion for 24 hours (a)-(b) SEM micrographs of a typical Al-Cu-Fe-Mn intermetallic particle, (c)-(d) SEM micrographs of another typical Al-Cu-Fe-Mn intermetallic particle, (e) EDX maps of the Al-Cu-Fe-Mn intermetallic particle shown in (c)-(d), in the sequence of Al, Cu, Fe, Mn, Mg and O. 229
 (b) (c) (d) Figure 5.")

-(b) Typical Al-Cu-Fe-Mn intermetallic particles")

230 Chapter 5: Corrosion Behaviour of AA2024-T351 Aluminium Alloy (a) (b) (c) (d) Figure 5.11: Scanning electron micrographs of Al-Cu-Fe-Mn intermetallic particles after 24 hours immersion with gentle polishing to remove the corrosion product layer (a)-(b) Typical Al-Cu-Fe-Mn intermetallic particles with linear de-alloyed bands, (c)-(d) A typical Al-Cu-Fe-Mn intermetallic particle with linear de-alloyed bands at different magnifications. 230
 Scanning electron micrograph of a typical intermetallic particle cluster prior to the immersion testing, (b)-(e) EDX spectra corresponding to points 1-4 shown in (a), (f)-(i) Kikuchi patterns")
231 Chapter 5: Corrosion Behaviour of AA2024-T351 Aluminium Alloy (a) (b) (c) (d) (e) Figure 5.12: (a) Scanning electron micrograph of a typical intermetallic particle cluster prior to the immersion testing, (b)-(e) EDX spectra corresponding to points 1-4 shown in (a), (f)-(i) Kikuchi patterns along with the corresponding indexed results from point 1 and point 3, (j) Scanning electron micrograph of the intermetallic particle cluster after the immersion for 30 min. 231


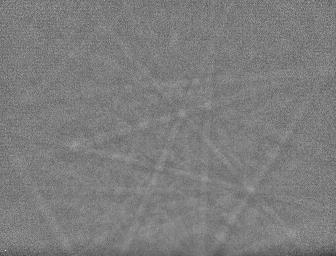
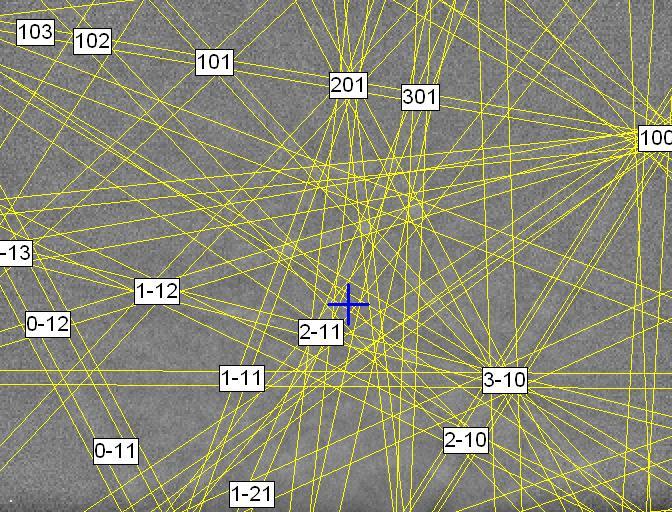
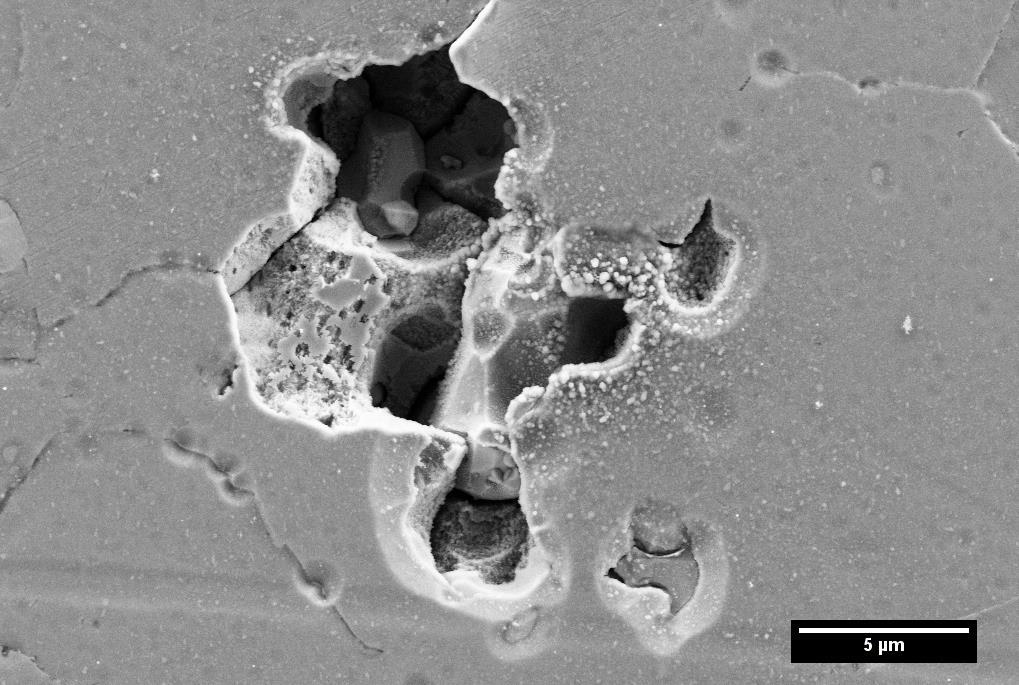
232 Chapter 5: Corrosion Behaviour of AA2024-T351 Aluminium Alloy (f) (g) (h) (i) (j) Figure 5.12: Continued. 232


 (c) (d)")

233 Chapter 5: Corrosion Behaviour of AA2024-T351 Aluminium Alloy (a) (b) (c) (d) (e) (f) Figure 5.13: To be continued. 233
 Scanning electron micrograph of the intermetallic particle cluster prior to the immersion testing, (b)-(d) EDX spectra corresponding to points 1-3 shown in (a), (e)-(g) Kikuchi patterns along")
234 Chapter 5: Corrosion Behaviour of AA2024-T351 Aluminium Alloy (g) (h) 3 1 (i) (j) Figure 5.13: (a) Scanning electron micrograph of the intermetallic particle cluster prior to the immersion testing, (b)-(d) EDX spectra corresponding to points 1-3 shown in (a), (e)-(g) Kikuchi patterns along with the corresponding indexed results from points 1-3 in shown in (a), (h) Scanning electron micrograph of the intermetallic particle cluster after 30 min immersion, (i)-(j) EDX spectra of point 1 and point 3 shown in (h). 234


 General")
235 Chapter 5: Corrosion Behaviour of AA2024-T351 Aluminium Alloy (a) (b) (c) (d) Figure 5.14: Scanning electron micrographs of intermetallic particle clusters after 2 hours immersion in a 3.5 wt. % NaCl solution (a) General view, (b)-(d) Typical clusters. 235

 (b) Figure 5.")


236 Chapter 5: Corrosion Behaviour of AA2024-T351 Aluminium Alloy (a) (b) Figure 5.15: (a) Scanning electron micrograph of an attacked intermetallic particle cluster after 2 hours immersion in a 3.5 wt. % NaCl solution, (b) EDX maps of the intermetallic particle cluster shown in (a), in the sequence of Al, Cu, O, Mn, Fe and Mg. 236
 (b) (c) (d) (e) Figure 5.")


 Plan-view, (c)-(e)")
237 Chapter 5: Corrosion Behaviour of AA2024-T351 Aluminium Alloy (a) (b) (c) (d) (e) Figure 5.16: Electrochemical measurement of AA2024-T351 aluminium alloy in a 3.5 wt. % NaCl solution (a) Voltage-current density curve during the anodic polarization, Scanning electron micrographs of the AA2024-T351 aluminium alloy after anodic polarization, (b) Plan-view, (c)-(e) Cross section at various magnifications. 237

 At the")
 After 30 min immersion in a 3.5 wt.")
 After 30 min")

238 Chapter 5: Corrosion Behaviour of AA2024-T351 Aluminium Alloy Figure 5.17: Optical micrographs of AA2024-T351 aluminum alloy at different stages during the immersion testing (a) At the beginning of the immersion in a 3.5 wt. % NaCl solution, (b) After 30 min immersion in a 3.5 wt. % NaCl solution, (c) Moving to deionized water after 30 min immersion in NaCl solution, (d) After 30 min immersion in deionized water. Table 5.2: Population density of localized corrosion sites on AA2024-T351 alloy surface after the immersion in 3.5 wt. % NaCl solution / deionized water. 238
 (b) (c) (d) (e) (f) Figure 5.")


 Cross section with an attacked intermetallic particle")
 at higher magnification; Other typical cross")

239 Chapter 5: Corrosion Behaviour of AA2024-T351 Aluminium Alloy (a) (b) (c) (d) (e) (f) Figure 5.18: Scanning electron micrographs of typical stable localized corrosion sites in AA2024-T351 aluminium alloy after the immersion in a 3.5 wt. % NaCl solution for 30 min followed by the immersion in deionized water for another 30 min (a) Plan-view, (b) Tilted 30, (c) Cross section with an attacked intermetallic particle intersected the alloy surface, (d) Attacked intermetallic particle in (c) at higher magnification; Other typical cross sections after the identical immersion testing, (e) Cross section with an attacked intermetallic particle buried beneath alloy surface, (f) Cross section with no attacked intermetallic particle beneath alloy surface. 239

 (b) Figure 5.")


240 Chapter 5: Corrosion Behaviour of AA2024-T351 Aluminium Alloy (a) (b) Figure 5.19: Scanning electron micrographs of typical cross sections at stable localized corrosion sites in AA2024-T351 aluminium alloy after the immersion in a 3.5 wt. % NaCl solution for 30 min. (a) (b) Figure 5.20: Scanning electron micrographs of typical cross sections at stable localized corrosion sites in AA2024-T351 aluminium alloy after the immersion in a 3.5 wt. % NaCl solution for 60 min. Table 5.3: Average and maximum corrosion depth for AA2024-T351 alloy after the immersion in 3.5 wt. % NaCl solution / deionized water. 240

241 Chapter 5: Corrosion Behaviour of AA2024-T351 Aluminium Alloy Figure 5.21: 3D volumetric reconstruction of a typical stable localized corrosion site of AA2024-T351 aluminium alloy after the immersion in a 3.5 wt. % NaCl solution followed by deionized water, with selective transparency applied to alloy matrix, and red and yellow applied to represent intermetallic particles and corrosion product, respectively. 241
 (b)")

-(c) After")


-(f) After by the")
-(j) After")


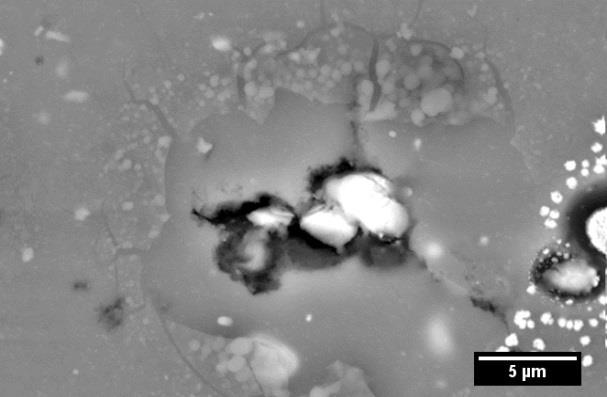
242 Chapter 5: Corrosion Behaviour of AA2024-T351 Aluminium Alloy (a) (b) (c) (d) (e) (f) (g) (h) (i) (j) Figure 5.22: Scanning electron micrographs of AA2024 alloy surface (a)-(c) After the immersion in a 3.5 wt. % NaCl solution for 40 min followed by the immersion in 3.5 wt. % NaCl solution with 10-4 M copper chloride as addition for another 40 min, (d)-(f) After the immersion in a 3.5 wt. % NaCl solution for 40 min followed by the immersion in deionized water with 10-4 M copper chloride as addition for another 40 min, (g)-(j) After the immersion in a 3.5 wt. % NaCl solution for 40 min followed by the immersion in deionized water for another 40 min, then the specimen was immersed in 0.01 M copper chloride solution for 5 seconds. 242

 Figure 5.")
243 Chapter 5: Corrosion Behaviour of AA2024-T351 Aluminium Alloy (a) (b) (c) (d) Figure 5.23: To be continued. 243

, (e) EDX line-scan result along line 1 in (b), (f) The copper EELS map of the corrosion front shown in (b),")
244 Chapter 5: Corrosion Behaviour of AA2024-T351 Aluminium Alloy (e) (f) (g) Figure 5.23: TEM analysis of an intergranular corrosion filament in AA2024-T351 alloy after the immersion in a 3.5 wt. % NaCl solution for 30 min followed by deionized water for another 30 min (a) Bright field TEM micrograph, (b) HAADF micrograph, (c)-(d) EDX spectra from point 1, point 2 and point 3 in (b), (e) EDX line-scan result along line 1 in (b), (f) The copper EELS map of the corrosion front shown in (b), (g) High resolution TEM micrograph. Inset: fast Fourier transform of the framed region, indicating Al 2 Cu phase. 244
 (b)")


245 Chapter 5: Corrosion Behaviour of AA2024-T351 Aluminium Alloy (a) (b) (c) (d) Figure 5.24: Typical HAADF micrographs of attacked grain boundaries along with the intergranular corrosion front in AA2024-T351 aluminium alloy after the immersion in a 3.5 wt. % NaCl solution for (a)-(b) 1 hour, (c)-(d) 8 hours. 245
 HAADF micrograph of AA2024-T351 aluminium alloy after alkaline etching, (b) Cathodic polarization curves for as-received and alkaline-etched AA2024- T351 alloy in")
246 Chapter 5: Corrosion Behaviour of AA2024-T351 Aluminium Alloy (a) (b) Figure 5.25: (a) HAADF micrograph of AA2024-T351 aluminium alloy after alkaline etching, (b) Cathodic polarization curves for as-received and alkaline-etched AA2024- T351 alloy in de-aerated 3.5 wt. % NaCl (with HCl to ph=3) testing solution with a scanning rate of 1 mv/s. 246
 Scanning electron micrograph of a typical stable localized corrosion site in AA2024-T351 aluminium alloy after the immersion in a")
 Histogram of the attacked grain boundary")
247 Chapter 5: Corrosion Behaviour of AA2024-T351 Aluminium Alloy (a) (b) Figure 5.26: (a) Scanning electron micrograph of a typical stable localized corrosion site in AA2024-T351 aluminium alloy after the immersion in a 3.5 wt. % NaCl solution for 8 hours, with misorientations of attacked grain boundaries marked, (b) Histogram of the attacked grain boundary misorientation distribution in corroded AA2024-T351 aluminium alloy, with the abscissa axis representing the grain boundary misorientation value and longitudinal axis representing the frequency. 247
 (b) (c) (d) (e) (f) Figure 5.")

")
")

 Grain-stored")
248 Chapter 5: Corrosion Behaviour of AA2024-T351 Aluminium Alloy (a) (b) (c) (d) (e) (f) Figure 5.27: (a) SEM micrograph of a typical stable localized corrosion site on the surface of AA2024-T351 aluminium alloy, (b) Crystallographic orientation distribution in Euler's colour, (c) Grain-stored energy distribution in grey scale, with yellow lines applied to represent HAGBs, (d) SEM micrograph of a typical cross section at the stable localized corrosion site in AA2024-T351 aluminium alloy, (e) Crystallographic orientation distribution in Euler's colour, (f) Grain-stored energy distribution in grey scale. 248
 (b) (c)")


-(d)")

249 Chapter 5: Corrosion Behaviour of AA2024-T351 Aluminium Alloy (a) (b) (c) (d) (e) (f) Figure 5.28: Scanning electron micrographs of AA2024-T351 aluminium alloy after 15 hours immersion in a 3.5 wt. % NaCl solution (a) Plan-view of a typical stable localized corrosion site, (b) Framed area in (a) at increased magnification, (c)-(d) Typical crystallographic pits, (e) Cross section of a stable localized corrosion site, (f) Framed area in (e) at increased magnification. 249

 (e) (f) (g) (h) Figure 5.")


-(d) At 1.")
250 Chapter 5: Corrosion Behaviour of AA2024-T351 Aluminium Alloy (a) (b) (c) (d) (e) (f) (g) (h) Figure 5.29: Scanning electron micrographs of AA2024-T351 aluminium alloy after 15 hours immersion in a 3.5 wt. % NaCl solution (a)-(b) Typical stable localized corrosion sites, and a region containing an attacked grain boundary and crystallographic pits (c)-(d) At 1.5 kv, (e)-(f) At 10 kv, (g)-(h) At 20 kv. 250
 3D reconstruction result of a typical localized corrosion site characterized by attacked")
 3D reconstruction result at the same site with only")
251 Chapter 5: Corrosion Behaviour of AA2024-T351 Aluminium Alloy (a) (b) Figure 5.30: (a) 3D reconstruction result of a typical localized corrosion site characterized by attacked grain boundaries and crystallographic pits, with yellow and red representing corrosion product and intermetallic particles, respectively, (b) 3D reconstruction result at the same site with only corrosion product shown. 251
 SEM micrograph of a typical localized corrosion site on the surface of AA2024-T351 aluminium alloy after 15")
,")
252 Chapter 5: Corrosion Behaviour of AA2024-T351 Aluminium Alloy (a) (b) (c) Figure 5.31: (a) SEM micrograph of a typical localized corrosion site on the surface of AA2024-T351 aluminium alloy after 15 hours immersion in a 3.5 wt. % NaCl solution, with the inset displaying the crystallographic orientations ({111}: blue; {001}: red; {011}: green), (b) Kikuchi pattern obtained from the marked location as shown in (a), (c) Indexed result of the Kikuchi pattern shown in (b). 252


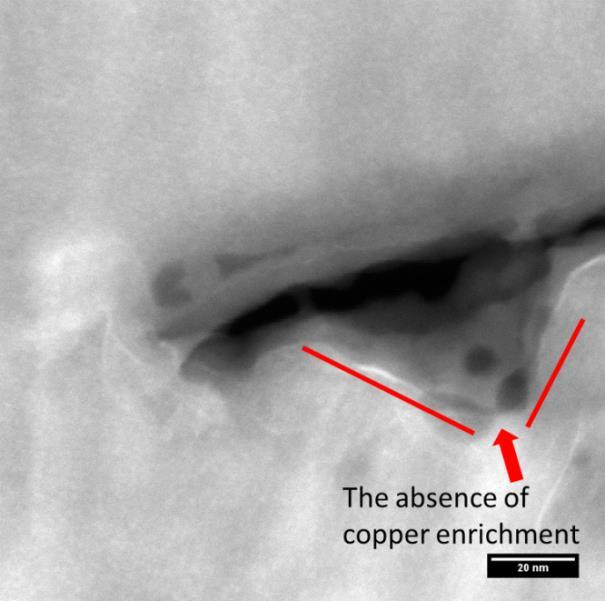
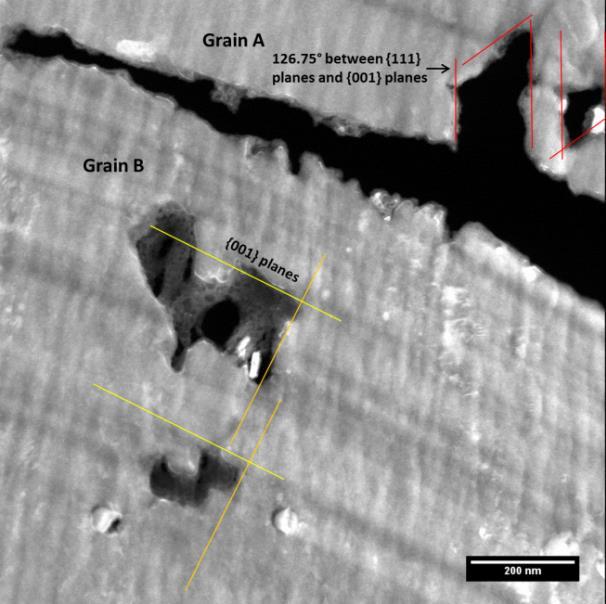


253 Chapter 5: Corrosion Behaviour of AA2024-T351 Aluminium Alloy (a) (b) (c) (d) (e) (f) Figure 5.32: To be continued. 253

254 Chapter 5: Corrosion Behaviour of AA2024-T351 Aluminium Alloy (g) (h) Figure 5.32: HAADF micrographs and EDX analysis of crystallographic pits in AA2024-T351 aluminium alloy after the immersion in a 3.5 wt. % NaCl solution (a) General view of localized corrosion site, (b)-(c) Crystallographic pits along attacked grain boundary at different magnifications, (d)-(f) Crystallographic pits in the grain interior at various magnifications, (g) EDX spectra from point 1 and point 2 in (f), (h) Copper EELS map of the crystallographic pit shown in (f). 254

255 Chapter 5: Corrosion Behaviour of AA2024-T351 Aluminium Alloy Figure 5.33: Schematic diagram showing the development of intergranular corrosion in the corrosion front area. 255


256 Chapter 5: Corrosion Behaviour of AA2024-T351 Aluminium Alloy Figure 5.34: Schematic diagram showing the development of crystallographic corrosion into the grain interior following the grain boundary attack. 256
257 Chapter 6: Corrosion Behaviour of 2A97 Aluminium Alloy CHAPTER 6 Corrosion Behaviour of 2A97 Aluminium Alloys 257
258 Chapter 6: Corrosion Behaviour of 2A97 Aluminium Alloy 6 Corrosion Behaviour of 2A97 Aluminium Alloys A heterogeneous microstructure is intentionally developed in 2A97 Al-Cu-Li alloys to achieve desirable mechanical properties. However, the microstructural inhomogeneity may compromise the corrosion resistance of the alloy, limiting its application in the aircraft industry. Therefore, in this Chapter, the localized corrosion behaviour of 2A97 Al-Cu-Li alloys is investigated. The first part in the Chapter explores the corrosion behaviour of constituent intermetallic particles in 2A97 Al-Cu-Li alloys. In the subsequent section, stable localized corrosion behaviour of 2A97 Al-Cu-Li alloys is investigated, with particular focus on the relationship between the alloy microstructure and the propagation mechanism of stable localized corrosion. The influence of thermomechanical history on corrosion behaviour of 2A97 Al-Cu-Li alloys is also discussed. 6.1 Corrosion behaviour of constituent intermetallic particles Due to the relatively high melting point of intermetallic particles, ageing process has little influence on the composition and, consequently, the electrochemical behaviour of intermetallic particles. Cold working prior to ageing may break the intermetallic particles, which could affect the shapes and dimensions of intermetallic particles in the alloys. However, little evidence of compositional modification during the cold working has been revealed, indicating the limited influence of cold working on the corrosion behaviour of intermetallic particles. Therefore, the corrosion behaviour of intermetallic particles in 2A97 aluminium alloys in various tempers shares significant similarity General observation after 5 h immersion Typical SEM micrographs of the alloys after the immersion in a 3.5 wt. % NaCl solution at ambient temperature for 5 hours are displayed in Figure 6.1, showing the general view of the alloy surfaces. Cavities with dimensions ranging from several microns to tens of microns are evident on the alloy surfaces. The distribution of cavities on the alloy surface is consistent with that of intermetallic particles on the surface of the as-received alloys, suggesting the relationship between the cavities and the intermetallic particles. In addition, bright features of micrometre scale dimensions are also displayed, as indicated with white arrows in Figure 6.1, which are constituent intermetallic particles as revealed by EDX analysis. 258
259 Chapter 6: Corrosion Behaviour of 2A97 Aluminium Alloy The morphology of a typical intermetallic particle after the immersion in a 3.5 wt. % NaCl solution for 5 hours is displayed in Figure 6.2 (a). The gap with the dimension around several hundred nanometres, namely trenching, between the intermetallic particle and the adjacent alloy matrix is displayed in Figure 6.2 (a), suggesting the preferential dissolution of the alloy matrix in the vicinity of the particle during the immersion testing. Additionally, corrosion product is discernible around the attacked intermetallic particle, as marked in Figure 6.2 (a). As revealed in Chapter 4, the intermetallic particle in 2A97 alloys is rich in copper and iron, with a more positive corrosion potential with respect to that of the alloy matrix. Cathodic reactions preferentially occur on the cathodic intermetallic particles on the alloy surface, resulting in the increase of localized ph. As a result, the local alumina film becomes unstable in the alkaline environment, facilitating the initiation of the preferential dissolution of the alloy matrix at the adjacency. And the high concentration of OH - also contributes to the development of corrosion product on the intermetallic particles. Following the initiation, the micro-coupling between the intermetallic particles and alloy matrix promotes the anodic dissolution of the matrix in the periphery, resulting in the trenching around the intermetallic particles on the alloy surface. EDX maps of the intermetallic particle shown in Figures 6.2 (a) are displayed in Figure 6.2 (b) in the sequence of Al, Cu, Fe, Mn, Mg, Zn and O, indicating that the intermetallic particle in Figure 6.2 (a) corresponds to the typical Al-Cu-Fe-Mn particle in the as-received 2A97 alloys. The noted change in composition around the intermetallic particle is the increased level of oxygen, as a consequence of the accumulation of corrosion product, which is consistent with the SEM micrograph displaying the corrosion product covering its surface. Besides the galvanic coupling between the alloy matrix and the intermetallic particle, selective dissolution of intermetallic particles in the 2A97 aluminium alloy is evident. Figure 6.3 displays two individual intermetallic particles after 5 hours immersion in 3.5 wt. % NaCl solution, which were observed from the plan-view of the alloy surface (Figures 6.3 (a)-(b)) and the cross section beneath the alloy surface (Figures 6.3 (c)-(d)), respectively. As shown in Figure 6.3 (a), in addition to the corrosion product and trenching around the intermetallic particle, the corroded volume in form of bands (as indicated by the arrows) is evident on the surface of attacked intermetallic particles, 259
260 Chapter 6: Corrosion Behaviour of 2A97 Aluminium Alloy which preferentially developed along certain orientation. Focussing on the banding structure in the framed area of Figure 6.3 (a), Figure 6.3 (b) displays the backscattered electron micrograph at increased magnification, which provides detailed morphological information of the banding structure, revealing its typical spongy morphology. The morphology of the banding structure is similar with the porous structure of the S-phase particle in the AA2024 aluminium alloy after de-alloying [87], implying the selective dissolution of active elements from the intermetallic particles. The porous banding structure displays higher brightness in the backscattered electron micrograph (Figure 6.3 (b)), suggesting the enrichment of heavy alloying elements, possibly copper in this case. What s more, the banding structure is also present in the intermetallic particle on the cross section as shown in Figures 6.3 (c)-(d). The banding structure along preferred orientation (as indicated by the arrows) with typical spongy morphology in the attacked intermetallic particles suggests the selective dissolution occurred along certain orientation. The banding structure along {112} crystallographic orientation is present in θ-phase particles in the AA2024-T351 alloy as displayed in Chapter 5 (Figure 5.8). As an analogy, it is suggested that the selective dissolution of intermetallic particles in 2A97 alloys also developed along preferred crystallographic orientation. EDX maps of the attacked intermetallic particle shown in Figure 6.3 (a) is illustrated in Figure 6.3 (e) in the sequence of Al, Cu, Fe, Mg, O, Mn and Zn. Increased oxygen content in the area of the intermetallic particle relative to that of the alloy matrix indicates the accumulation of corrosion product preferentially occurred on the area with intermetallic particles, suggesting the higher corrosion susceptibility of intermetallic particles with respect to that of the alloy matrix. As mentioned above, the localized compositional modification due to the de-alloying is evident as shown in the backscattered electron micrograph (Figure 6.3 (b)) since the de-alloying bands display the brighter appearance. However, due to the relatively large interaction volume between the electron beam and the specimen compared to the dimension of the banding structure, the difference in the content of heavy alloying elements within the banding structure and that in other area of the intermetallic particle was compromised during the collection of X-ray signals, thereby exhibiting a relatively uniform brightness in EDX maps General observation after 20 h immersion 260
261 Chapter 6: Corrosion Behaviour of 2A97 Aluminium Alloy After 20 hours immersion in a 3.5 wt. % NaCl solution, the morphologies of the alloy surfaces are displayed in Figures 6.4 (a)-(d). It is revealed that increased population density of cavities of micrometre scale dimensions is present on the alloy surface with respect to that after 5 hours immersion. Bright features of micrometre scale dimensions, namely intermetallic particles, were also detected, as indicated with white arrows in Figure 6.4. Evidently, the distribution of cavities is consistent with the distribution of intermetallic particles in the as-received alloy, correlating the cavities with the intermetallic particles. It is believed that the formation of cavity with the similar dimension of the intermetallic particle on the alloy surface is the consequence of the preferential attack of the alloy matrix in the periphery of the intermetallic particle. The trenching at its adjacent undermines the intermetallic particle, leading to the removal of the particles from the alloy surface. Therefore, cavities with dimensions slightly larger than those of the intermetallic particles exhibit increased population density with prolonged immersion time. Small cavities of nanometre scale dimensions were also detected on the alloy surface after 20 hours immersion in a 3.5 wt. % NaCl solution, as indicated with white arrows in Figure 6.5 (a). The dimensions of the small cavities ranging from 400 nm to 600 nm are in the same order of magnitude as those of dispersoids in the 2A97 Al-Cu-Li alloys (as shown in Figure 4.35), suggesting a correlation between the small cavities and the dispersoids. Bright nano-particles with the dimensions around tens of nanometres, present individually or in cluster, are evident within the cavities. The bright appearance of the nano-particles in the backscattered electron micrograph indicates the enrichment of heavy alloying elements, which is likely to deposited copper nano-particles from the dissolution of alloy matrix in this situation. The typical corrosion morphology of intermetallic particles on the alloy surface after 20 hours immersion is displayed in Figure 6.5 (b), exhibiting an attacked intermetallic particle around 7 µm length and 2 µm width. The gap, namely trenching, between the intermetallic particle and the alloy matrix is around 1 µm, displaying significantly increased width with respect to that shown in Figure 6.2, which suggests further dissolution of the alloy matrix due to the micro-coupling between the intermetallic particle and the alloy matrix. Besides, the corrosion product is discernible on the surface. 261
262 Chapter 6: Corrosion Behaviour of 2A97 Aluminium Alloy Similar to Figure 6.5 (a), the bright features with the dimensions around tens of nanometres were also observed as marked with white arrows in Figure 6.5 (b), suggesting the presence of nano-particles from copper re-deposition during the immersion testing. EDX maps of the intermetallic particle in Figure 6.5 (b) are shown in Figure 6.5 (c), in the sequence of Al, Cu, Fe, Mn, Mg, Zn and O. Comparing with the EDX maps shown in Figure 6.2 (b), the similarity of alloying elements distribution after the immersion testing is revealed. The higher intensity of oxygen in the region of the intermetallic particle with respect to that of the alloy matrix indicates the localized corrosion preferentially occurs on the intermetallic particle, resulting in the presence of an increased amount of corrosion product. Another typical SEM micrograph associated with attacked intermetallic particles is shown in Figure 6.6 (a), displaying an intermetallic particle in a cavity, which is surrounded by a wide gap with the dimension around several microns between the alloy matrix and the intermetallic particle except the top region. Figure 6.6 (b) exhibits the framed area in Figure 6.6 (a) at increased magnification, which displays the porous morphology of the top region, indicating the selective dissolution of the intermetallic particle. Further, the high brightness of the top region in the BSE micrograph indicates the enrichment of heavy elements as a consequence of the selective dissolution of active alloying elements from the intermetallic particle [175]. EDX maps of the intermetallic particle in Figure 6.6 (a) are shown in Figure 6.6 (c) in the sequence of Al, Cu, Zn, Mn, Fe and O. Comparing the copper map and the SEM micrograph, it is suggested that copper enrichment was developed in the top region of the particle, which displays typical porous morphology. In addition, the zinc enrichment was also detected due to the higher brightness of the top area in the Zn map, indicating that the selective dissolution of intermetallic particles could lead to the enrichment of both copper and zinc in the 2A97 alloys. Copper re-deposition during the immersion testing is also evident, as indicated with white arrows in Figures 6.7 (a)-(b), respectively. Bright nano-particles with the dimensions around tens of nanometres, present individually or in cluster, are evident. EDX mapping of the intermetallic particle in Figure 6.7 (a) was conducted with the EDX maps shown in Figure 6.7 (c). Copper map indicates the intermetallic particle 262
263 Chapter 6: Corrosion Behaviour of 2A97 Aluminium Alloy acted as the preferential site for copper deposition during the immersion testing since the marked area in Figure 6.7 (a) displays higher brightness in the copper map, which is consistent with the conclusions from previous literature [23, 67, 94]. The higher contents of Fe and Mn relative to the surrounding alloy matrix indicate the existence of intermetallic particle beneath the corrosion product layer. Oxygen map reveals the presence of corrosion product in the region of the intermetallic particle. 6.2 Localized corrosion in 2A97 Al-Cu-Li alloys Electrochemical behaviour Figure 6.8 shows potentiodynamic polarization curves of 2A97-T3, T4, T6 and T8 specimens in a 3.5 wt. % NaCl solution at ambient temperature. Prior to the electrochemical measurement, high purity nitrogen was applied to obtain the de-aerated electrolyte. For the anodic polarization, the sample was maintained in the identical testing electrolyte for 5 min to reach a stable surface condition, and then the potential was switched to starting point, i.e. -50 mv (vs. OCP) and scanned at the rate of 0.5 mv/s. Pitting potential, which refers to the breakdown of the passive film on the alloy surface, is characterized by the sudden increase of anodic current density, as indicated with red arrows in Figure 6.8. No evident passivation is revealed on the potentiodynamic polarization curves, indicating that the alloys remained active during the anodic polarization. The current densities are comparable with the same over-potential while the corrosion potentials of the alloys in different tempers are evidently different. The sequence of corrosion potentials follows the decreasing order: T4 > T3 > T6 > T8 of the 2A97 Al- Cu-Li alloys. The T8 alloy has the most negative corrosion potential of V (vs SCE), indicating T8 alloy is thermodynamically more susceptible to localized corrosion comparing with alloys in other thermomechanical conditions. While T4 alloy has the most positive corrosion potential around V (vs SCE), suggesting its high localized corrosion resistance. The difference between corrosion potentials of the alloys is closely linked to their different thermomechanical histories. The corrosion potential of T6 alloy (-1.01 V vs SCE) is much lower than that of T4 alloy (-0.93 V vs SCE), indicating that artificial 263
264 Chapter 6: Corrosion Behaviour of 2A97 Aluminium Alloy ageing significantly shifts the corrosion potential in the negative direction. The corrosion potential difference between T3 alloy (-0.96 V vs SCE) and T4 alloy (-0.93 V vs SCE) reveals the impact of cold working on the corrosion potential, which is responsible for the more negative corrosion potential of T3 alloy. Additionally, the corrosion potential difference between T6 and T4 alloys (around 70 mv) is more significant than that between T3 and T4 alloys (around 30 mv), indicating the cold working has a relatively limited influence on corrosion potential of the alloys with respect to artificial ageing. The combined effect of artificial ageing and cold working contributes to the dramatic negative shift of corrosion potential of the 2A97-T8 alloy ( V vs SCE) with respect to alloys in other conditions Localized corrosion in cold worked alloy General observation The corrosion morphology of 2A97-T3 alloy after the immersion testing is relatively stable with the attacked grain boundaries as the dominant corrosion morphology. In contrast to the widely-existed attacked grain boundaries, little evidence of matrix dissolution was detected after 20 hours immersion in 3.5 wt. % NaCl solution, indicating high intergranular corrosion susceptibility in T3 alloy. Therefore, the grain boundary attack is the focus of the study on T3 alloy. The typical plan-view SEM micrograph at the stable localized corrosion site in 2A97- T3 aluminium alloy after 5 hours immersion in a 3.5 wt. % NaCl solution is shown in Figures 6.9 (a)-(b) at different magnifications. As shown in Figure 6.9 (a), several cavities with the similar dimensions of second phase particles in T3 alloy, are evident around the corrosion product ring, indicating the presence of corrosion pits associated with intermetallic particles in the region. The dark fine band with uniform width is displayed in Figure 6.9 (b), as marked by red arrows, indicating the corrosion propagated in the form of intergranular attack in T3 alloy. However, based on the typical surface plan view, it is difficult to understand the development of stable localized corrosion in the 2A97-T3 alloy. Therefore, the cross sections of typical stable localized corrosion sites were obtained with ultramicrotomy after 5 hours and 20 hours immersion, with the typical results shown in Figures 6.9 (c)- (d), respectively. 264
265 Chapter 6: Corrosion Behaviour of 2A97 Aluminium Alloy The typical cross section after 5 hours immersion is displayed in Figure 6.9 (c). As shown in the SEM micrograph, a narrow band is evident, indicating the corrosion preferentially occurs in the form of intergranular attack, which is consistent with that observed on the alloy surface. The uniform width of the corroded volumes indicates the corrosion propagation is confined within the region immediately adjacent to the grain boundaries, suggesting high intergranular corrosion susceptibility in T3 alloy. It is also revealed that intergranular corrosion developed in all directions, laterally as well as in depth, and penetrated around 11 µm beneath the alloy surface. Additionally, several attacked grain boundaries are connected to the alloy surface, introducing testing solution into the region beneath the alloy surface. The continuous propagation path, which consists of attacked grain boundaries, provides a diffusion path for the transportation of testing solution to the sub-surface area and extents the reaction volume beneath the alloy surface. With prolonged immersion time to 20 hours, the typical cross section as shown in Figure 6.9 (d) displays the similar corrosion morphology with that after 5 hours immersion. However, intergranular corrosion has much larger penetration depth beneath the alloy surface relative to that after 5 hours immersion. The penetration depth of intergranular corrosion excesses the dimension of the cross section, indicating the further development of stable localized corrosion with prolonged immersion time. The elongated shapes of grains in the region further away from the surface indicate the high plastic deformation introduced to the grains in the area during the cold working (Figure 6.9 (f)). While, the grain near the alloy surface displays a slight elongated pancakeshape, indicating less plastic deformation in the near surface area (Figure 6.9 (e)). Since the electrolyte penetrates into the sub-surface area via attacked grain boundaries [71, 104], the grain boundary network near the surface area are exposed to the corrosive environment for extended time, which is supposed to be more severely attacked. Interestingly, several grain boundaries near the surface area are intact, as indicated by the red arrows in Figure 6.9 (d), in contrast to the high population density of attacked grain boundaries in the area further away from the surface. The difference reveals the heterogeneous corrosion susceptibility of grain boundaries in 2A97-T3 alloy, suggesting the corrosion susceptibility of a grain boundary is determined by the intrinsic microstructure. What s more, since high population density of attacked grain boundaries exist in the area with the high level of plastic deformation, it is believed that the 265
266 Chapter 6: Corrosion Behaviour of 2A97 Aluminium Alloy corrosion susceptibility of the grain boundary is associated with the local plastic deformation caused by cold working, which will be further discussed in the following section Grain-stored energy EBSD analysis was conducted in a region containing typical stable localized corrosion features, i.e. attacked grain boundaries, to explore the influence of grain-stored energy on the stable localized corrosion development in the 2A97-T3 Al-Cu-Li alloy. Figures 6.10 (a)-(b) display the scanning electron micrographs of two neighbouring stable localized corrosion sites on the surface of 2A97-T3 alloy. It is evident that attacked grain boundaries are dominant corrosion features after 5 hours immersion in a 3.5 wt. % NaCl solution. After the immersion testing, the specimen was gently polished with 1 µm diamond paste to remove the corrosion product following with argon gas plasma cleaning to create a stress-free surface for EBSD analysis. The crystallographic orientation distribution of the corresponding area is exhibited in Euler s colours as shown in Figure 6.10 (c). Due to the low diffraction intensity of cavities and the Kikuchi patterns overlapping along the grain boundary, several areas failed to be indexed, which are illustrated in light green. The locations of two stable localized corrosion sites are marked by the frames in Figure 6.10 (c), correlating the crystallographic orientation map with the SEM micrographs. The grain-stored energy distribution of the corresponding area, containing two stable localized corrosion sites, is displayed in a grey-scale map as shown in Figure 6.10 (d), with brighter appearance representing higher grain-stored energy. Black colour is applied to represent the non-indexed area in the grain-stored energy map. Comparing the SEM micrographs of the localized corrosion sites (Figures 6.10 (a)-(b)) with the grain-stored energy map in Figure 6.10 (d), it is evident attacked grain boundaries tend to surround the grain with higher level of stored energy. It is also noticed that subgrain boundaries within the interior of grain with high stored energy were preferentially attacked. For example, in Grain A with high level of stored energy, the grain boundaries around the Grain A as well as the subgrain boundaries within Grain A are generally all attacked. On the contrary, only a small portion of grain boundaries are attacked around Grain B, which displays low brightness in the grain-stored energy map, indicating its low level of stored energy. Therefore, the corrosion susceptibility of an individual grain 266
267 Chapter 6: Corrosion Behaviour of 2A97 Aluminium Alloy varies with its grain-stored energy. The difference of stored energy also exists between various subgrains in the 2A97-T3 alloy as shown in Figure 6.10 (e), which exhibits more localized distribution of stored energy at the corresponding area, suggesting the different corrosion susceptibility of the subgrains. Another example of grain boundary attack at the stable localized corrosion site in the 2A97-T3 alloy is shown in Figures 6.10 (f)-(h), displaying the scanning electron micrograph and the corresponding EBSD reconstruction maps of the region containing typical stable localized corrosion features, namely attacked grain boundaries in this situation. At the localized corrosion site, little evidence of attacked subgrain boundary was detected. The distribution of crystallographic orientation and grain-stored energy in the corresponding area are displayed in Figures 6.10 (g)-(h), respectively. Based on the crystallographic orientation map in Euler s colour (Figure 6.10 (g)), it is revealed that corrosion propagated along the grain boundary network. Furthermore, the grey-scale map of grain-stored energy distribution (Figure 6.10 (h)) displays that attacked grain boundaries tend to locate around grains with high stored energy. For example, as shown in Figure 6.10 (h), grain boundaries located around grain C with high level of stored energy were preferentially attacked. While, most of grain boundaries remained intact around the neighbouring Grain D with low level of stored energy, correlating the corrosion susceptibility of the grain boundary to the stored energy of the corresponding grain Corrosion front area In order to further understand the corrosion propagation mechanism in the 2A97-T3 alloy, thin foils with thickness of 15 nm were created with ultramicrotomy at the stable localized corrosion site of the 2A97-T3 alloy after 5 hours immersion in a 3.5 wt. % NaCl solution. TEM observation was carried out to investigate the corrosion front area. Corrosion crevice induced by intergranular attack along with the intact grain boundary is shown in Figure 6.11 (a). The uniform width between the corrosion crevice and the corrosion front indicates the corrosion propagated in form of intergranular corrosion in the 2A97-T3 alloy. The two corrosion fronts ahead the corrosion crevice in Figure 6.11 (a) are revealed at increased magnifications, as shown in Figures 6.11 (b) and (c), respectively. It is evident that corrosion was not confined within the area immediately adjacent to the 267
268 Chapter 6: Corrosion Behaviour of 2A97 Aluminium Alloy grain boundary, but developed further into the neighbouring grains. Interestingly, the corrosion front in Figure 6.11 (c) displays a generally homogeneous attack on both neighbouring grains, whereas in Figure 6.11 (b), with white arrows indicating the intact grain boundary, the corrosion preferentially developed into grain A rather than grain B, indicating the higher corrosion susceptibility of grain A than that of grain B. As mentioned above, the higher corrosion susceptibility of grain A is likely to be attributed to its high level of stored energy. A dark band with the thickness around 2-3 nm on the interface between the corrosion product layer and the alloy matrix is evident, as indicated by white arrows in Figure 6.11 (c). Due to the relatively uniform thickness of the ultramicrotomed TEM specimen, the dark band is attributed to the enrichment of heavy alloying elements. To further understand the nature of the fine band in Figure 6.11 (c), a high angle annular dark field (HAADF) micrograph was obtained at the typical corrosion front area in the 2A97-T3 alloy to display the compositional heterogeneity since the contrast in HAADF micrographs originates from the atomic number difference. As shown in Figure 6.11 (d), a band beneath the corrosion product layer with the thickness around 2-3 nanometres displays a brighter appearance, confirming the enrichment of heavy alloying elements between corrosion product layer and the alloy matrix. Corrosion developed heterogeneously into the neighbouring grains with more than 25 nm into the interior of grain C and around 10 nm into grain D, indicating high corrosion susceptibility of grain C than that of grain D. To obtain the chemical information about the band at the interface between the alloy matrix and the corrosion product layer, EDX point analysis was performed on the alloy matrix and the fine bands in the corrosion front area. The EDX spectra from point 1 and point 2, as marked in Figure 6.11 (d), are shown in Figure 6.11 (e), revealing that an increased yield of copper in the fine band beneath the corrosion product layer with respect to that of alloy matrix. The appearance of Ni peaks in the EDX spectra is due to the Ni-containing TEM specimen grids. Therefore, the dark band with the thickness around 2-3 nm is a copper-enriched layer, which has been widely studied in coppercontaining aluminium alloys [171, 185, 187, 188]. The high resolution TEM micrograph in Figure 6.11 (f) reveals the lattice fringes of the copper-enriched layer. The crystallographic structure of the copper-enriched layer is determined by FFT analysis of the framed area. The indexing result of FFT reveals the copper-enriched layer consists 268
269 Chapter 6: Corrosion Behaviour of 2A97 Aluminium Alloy of Al 2 Cu phase, which is in good agreement with its copper rich nature and previous literature [168, 183]. Both as-received and etched 2A97-T3 alloys were employed for cathodic polarization measurement in a testing solution containing 3.5 wt. % NaCl with HCl to adjust the electrolyte ph to 3. The cathodic polarization curves of both as-received and etched 2A97-T3 alloys are displayed in Figure 6.12 (a). It is evident that the general shapes of the polarization curves are similar with each other. However, the corrosion potential of as-received 2A97-T3 alloy is more negative than that of etched 2A97-T3 alloy whereas the current density of as-received specimen is much lower than that of etched specimen in a wide range of potential. Figure 6.12 (b) shows typical bright field TEM micrograph of the cross section of the etched 2A97-T3 alloy, displaying a narrow dark band with the thickness around 2 nm at the interface between the alloy matrix and residual alumina layer, which suggests the enrichment of a relatively high atomic number element, supposedly copper in this case. The chemical nature of the narrow band was further confirmed by EDX line-scanning, with the EDX lines shown in Figure 6.12 (c). As shown in Figure 6.12 (c), a peak along the copper line is present ahead of the appearance of the peak along the aluminium line, indicating the presence of copper enrichment at the interface between the alloy matrix and residual alumina layer. The near-surface compositional change has been extensively studied, revealing that after alkaline etching of copper-containing aluminium alloys, a copper-enriched layer with the thickness around 2 nm could be developed on the interface between the residual alumina layer and the alloy matrix [168, 183, 198], which is in good agreement with the present study. Therefore, the copper-enriched layer significantly alters the electrochemical behaviour of the alloy, resulting in a positive shift of corrosion potential along with the significant increase of cathodic current density, which is consistent with previous literature [189] Localized corrosion in naturally aged alloy General observation To understand stable localized corrosion behaviour in the 2A97-T4 Al-Cu-Li alloy, specimens after mechanical polishing were immersed in a 3.5 wt. % NaCl solution for various periods. The dominant corrosion morphology in 2A97-T4 aluminium alloy after 5 hours immersion is attacked grain boundaries with little attack into the grain interior. 269
270 Chapter 6: Corrosion Behaviour of 2A97 Aluminium Alloy By contrast, with prolonged immersion time to 20 hours, in addition to attacked grain boundaries, further corrosion development into selected grain interior is also evident. In the present work, both the surface plan-view and cross section of the typical stable localized corrosion site in the 2A97-T4 alloy after the immersion for 5 hours and 20 hours were examined with a range of electronic microscopy techniques. Figure 6.13 (a) displays the plan-view of a typical stable localized corrosion site on the alloy surface in a 3.5 wt. % NaCl solution for 5 hours. It is evident that a corrosion product ring with the diameter around 70 µm was developed at the stable localized corrosion site with attacked grain boundaries in its centre. The red line A-A indicates the position of the cross section, which is shown in Figure 6.13 (b). As shown in Figure 6.13 (b), selective attack along the grain boundary network propagated in all directions, with the penetration depth around 15 µm beneath the alloy surface. The magnified framed area in Figure 6.13 (b) is shown in Figure 6.13 (c), displaying slight grain dissolution features in the periphery of the attacked grain boundary, which is likely to be the initiation of matrix dissolution. Another typical cross section is shown in Figures 6.13 (d)-(e) at different magnifications, displaying the similar corrosion morphology and corrosion depth with that shown in Figures 6.13 (b)-(c). It is evident that the intergranular corrosion is the dominant corrosion morphology after 5 hours immersion in a 3.5 wt. % NaCl solution. Scrutiny of Figure 6.13 (e) reveals the several corrosion pits within the grain interior, which is shown in Figure 6.13 (f) at increased magnification, suggesting the potential initiation of matrix dissolution within selected grains. Figure 6.14 displays the plan-view and cross sections of a typical stable localized corrosion site after 20 hours immersion in a 3.5 wt. % NaCl solution. As shown in Figure 6.14 (a), a corrosion product ring with the diameter around 100 µm, which is decorated by corrosion pits and several corrosion product domes, is present at the stable localized corrosion site on the alloy surface. Along the positions A-A and B-B shown in Figure 6.14 (a), two cross sections obtained with ultramicrotomy were examined with SEM. As shown in Figures 6.14 (b)-(c) at different magnifications, the cross section along A-A displays widely-existed attacked grain boundaries after 20 hours immersion. It is evident that intergranular corrosion developed laterally as well as in depth, penetrating around 20 µm beneath the alloy 270
271 Chapter 6: Corrosion Behaviour of 2A97 Aluminium Alloy surface. The increased corrosion depth after 20 hours immersion relative to that after 5 hours immersion indicates the further development of intergranular corrosion. The cross section along B-B is displayed in Figures 6.14 (d)-(f), exhibiting attacked grain boundaries along with corroded volume in the inner region of the selected grain, which suggests the development of intragranular corrosion in selective grain interior. The selective attack of grain interior propagated in form of corrosion pitting as shown in Figure 6.14 (e). Since the selective attack of grain interior is only existed at the stable localized corrosion site neighbouring attacked grain boundary after 20 hours immersion, it is suggested that attacked grain interior is a relatively late stage corrosion feature following the attacked grain boundaries in the 2A97-T4 alloy. Detailed morphology of corrosion pits within the grain is shown at increased magnification in Figure 6.14 (f), exhibiting relatively well-defined shapes of corrosion pits, which suggests that crystallographic dissolution of the grain interior resulted in the corrosion pits in the grain. Therefore, the corrosion pits as a consequence of grain interior dissolution is also termed as crystallographic pits Grain-stored energy and crystallographic features In order to correlate the local grain structure of the alloy with the stable localized corrosion behaviour, EBSD analysis was carried out on the typical region containing extensive attacked grain boundaries on the surface of 2A97-T4 alloy. Figure 6.15 (a) displays the scanning electron micrograph of a region containing typical corrosion features, namely attacked grain boundaries, on the surface of 2A97-T4 alloy after 5 hours immersion in a 3.5wt % NaCl solution. After the immersion testing, the specimen was gently polished with 1 µm diamond paste to remove the corrosion product following with argon gas plasma cleaning to create a stress-free surface for EBSD analysis. The framed area in Figure 6.15 (a) is shown in Figure 6.15 (b) at higher magnification, displaying the corroded volume within the grain developed in the form of bands along certain orientation (marked with a white arrow in Figure 6.15 (b)). It is also noticed that the banding structure located next to the attacked grain boundary, which connected the attacked grain boundary with the inner region of the grain. The grain orientation distribution of the selected area is exhibited in Figure 6.15 (c) with Euler s colour applied to represent different crystallographic orientations and light green applied to represent the non-indexed area. The grain-stored energy of the identical area 271
272 Chapter 6: Corrosion Behaviour of 2A97 Aluminium Alloy is shown in a grey-scale map (Figure 6.15 (d)), in which brighter appearance represents higher level of stored energy and darker appearance indicates lower level of stored energy. The high angle grain boundary (HAGB), which is defined as grain boundary with the misorientation higher than 15, is marked with the yellow line. Additionally, black colour is applied to represent the non-indexed area in the grain-stored energy map due to low diffraction intensity from attacked grain boundaries and cavities on the alloy surface. Comparing the SEM micrograph of the stable localized corrosion site (Figure 6.15 (a)) with the corresponding grain-stored energy map (Figure 6.15 (d)), it is evident that attacked grain boundaries tend to surround the grains with higher level of stored energy. Due to the limitation of the spatial resolution in SEM micrographs, it is impossible to determine whether the attack across the grain boundary is even into the interior of the neighbouring grains. However, the TEM micrographs display the uneven attack at the active corrosion front area, which will be displayed later. Another evident feature of the stable localized corrosion site is about the widths of attacked grain boundaries. As shown in Figures 6.15 (a)-(b), both narrow and wide attacked grain boundaries are present. Two types of attacked grain boundaries with different widths may indicate two different mechanisms of intergranular corrosion in the 2A97-T4 alloy, which is consistent with previous work [102]. The corroded volume in form of bands, which is termed as banding structure in the present study, is widely existed in the 2A97-T4 alloy, especially in the periphery of attacked grain boundaries at the stable localized corrosion sites. EBSD analysis was employed to obtain the Kikuchi pattern at the corresponding area to correlate the crystallographic orientation of the alloy matrix with the preferred development direction of the corroded bands. The Kikuchi pattern obtained from the intact alloy matrix neighbouring the corrosion banding structure (in the same grain interior) is shown in Figure 6.15 (e) with the corresponding indexed result shown in Figure 6.15 (f). Comparing with the SEM micrograph of banding structure (Figure 6.15 (b)) with the Kikuchi pattern, it is evident that the preferential dissolution direction of the banding structure is parallel with the {001} crystallographic planes in the alloy matrix. More typical examples of banding structure are displayed in Figures 6.16 (a) and (d), respectively. Similarly, the preferred orientation of the corrosion banding structure at 272
273 Chapter 6: Corrosion Behaviour of 2A97 Aluminium Alloy two different localized corrosion sites were determined with the corresponding Kikuchi patterns. It is revealed that the propagation directions of corrosion banding structure are parallel with {001} and {111} crystallographic planes, respectively. Therefore, the corrosion bands in the periphery of attacked grain boundaries developed further into the grain interior in the directions parallel with {111} and {001} oriented planes, suggesting the presence of two different the banding structure development mechanisms. It is worth mentioning that, with large numbers of banding structure analysed, the banding structure following {001} oriented plane is more widespread in the 2A97-T4 alloy than that following {111} oriented plane. The banding structure, which connects the attacked grain boundary with the grain inner region, preferentially occurs in selected grain. It is believed that the development of banding structure facilitates the intragranular corrosion propagation, which provides a diffusion path for aggressive electrolyte into the grain interior. Therefore, the establishment of the connection between the grain boundary and grain interior may be responsible for the initiation of matrix dissolution with prolonged immersion time Corrosion front area In order to further understand the stable localized corrosion propagation mechanism, thin foils with thickness of 15 nm were generated by ultramicrotomy at the stable localized corrosion sites in the 2A97-T4 alloy after 5 hours immersion in a 3.5 wt. % NaCl solution. TEM observation was carried out to investigate the corrosion front area at the stable localized corrosion site. Figure 6.17 (a) displays a bright field TEM micrograph, exhibiting attacked grain boundaries behind corrosion fronts along with the intact grain boundary, which is marked by white arrows. The similar corrosion width between the corrosion crevice and the corrosion front indicates corrosion preferentially develops in the form of intergranular corrosion, indicating the high intergranular corrosion susceptibility in the 2A97-T4 alloy. It is also revealed that the corrosion attack across the grain boundary was not confined within the area immediately adjacent to the grain boundary but unevenly developed into the interior of selective grains, suggesting the corrosion susceptibility difference of individual grains in T4 alloy. The continuous dark band with the dimension around 2-3 nm is evident along the corrosion crevice walls between the alloy matrix and corrosion product layer. In addition, the corrosion crevice caused by the grain boundary attack is shown in Figure 6.17 (b) at increased magnification. It was 273
274 Chapter 6: Corrosion Behaviour of 2A97 Aluminium Alloy noticed that the corrosion wall along the crevice is not smooth, indicating heterogeneous dissolution rates of the alloy matrix. The corrosion crevice wall with the protrusions into the grain interior, as marked with white arrows in Figure 6.17 (b), indicates the relatively high corrosion susceptibility of selective grain interior regions in 2A97-T4 alloy relative to that in T3 alloy. To further understand the nature of the dark band shown in Figures 6.17 (a)-(b), the HAADF micrograph of a typical corrosion front area was obtained. Since atomic number difference contributes to the contrast in HAADF micrographs, the heavy alloying element displays higher brightness while that with smaller atomic number has a darker appearance. As marked in Figure 6.17 (c), a bright band with the thickness around 2 nm is evident beneath the corrosion product layer along the intergranular corrosion crevice wall, suggesting the heavy element enrichment along the interface between the alloy matrix and the corrosion product layer. Besides, uneven attack across the grain boundary into the neighbouring grains is also evident with corrosion developing around 80 nm into the interior of one grain in contrast to 30 nm into the other grain, suggesting the corrosion susceptibility difference of individual grains in the 2A97-T4 alloy. To obtain the compositional information about the fine band beneath the corrosion product layer, EDX line-scanning was carried out along the red line in Figure 6.17 (c), with the EDX lines shown in Figure 6.17 (d). Evidently, the peaks along the copper line correspond to the locations of the fine bands, indicating the relatively high copper content of the band. Therefore, the band with thickness around 2-3 nm beneath the corrosion product layer is copper rich. High resolution TEM micrograph of the copper-enriched layer along the corrosion crevice wall is shown in Figure 6.17 (e), displaying its lattice fringe. The crystallographic structure of the copper-enriched layer is obtained by fast Fourier Transformation (FFT) with the corresponding result inset, indicating that the copperenriched layer is comprised of Al 2 Cu phase. The copper build-up has been widely observed in copper-containing aluminium alloys after chemical and electrochemical processes with the development of a 2-3 nm copper-enriched layer beneath the corrosion product layer [171, 185, 187, 188], which is in good agreement with the finding in the present study. 274
275 Chapter 6: Corrosion Behaviour of 2A97 Aluminium Alloy To explore the electrochemical property of the copper build-up along the corrosion crevice wall, the etched 2A97-T4 alloy was employed since a copper rich layer was developed on the alloy surface after alkaline etching, which was confirmed by the following TEM analysis. A bright field transmission electron micrograph of the etched 2A97-T4 alloy cross section is displayed in Figure 6.18 (a), exhibiting the presence of a dark fine band with the dimension around 2-3 nm at the interface between the alloy matrix and the residual alumina layer. Additionally, the corresponding HAADF micrograph of the fine band was obtained. As shown in Figure 6.18 (b), the fine band beneath the residual alumina film has a bright appearance. Since the contrast in the HAADF micrograph is attributed to the atomic number difference, it is implied that the narrow band is rich in heavy alloying elements, supposedly copper in this situation. Furthermore, a high resolution TEM micrograph of the copper-enriched layer developed on the surface of etched 2A97-T4 alloy was shown in Figure 6.18 (c). The corresponding FFT result of the framed area in Figure 6.18 (c) reveals its crystallographic structure, indicating the copper-enriched layer is comprised of Al 2 Cu phase. Therefore, the copper-enriched layer developed on the alloy surface after alkaline etching and that along the corrosion crevice wall after the immersion testing have the similar dimensions, compositions and crystallographic structures. Therefore, the cathodic polarization of the etched specimen is a reasonable method to investigate the cathodic behaviour of the copper-enriched layer in the corrosion front area. Meanwhile, the cathodic behaviour of as-received alloy also represents that of the alloy matrix due to the limited surface area covered by grain boundaries. Both as-received and etched 2A97-T4 alloys were applied to de-aerated cathodic polarization measurement in a testing solution containing 3.5 wt. % NaCl with HCl to adjust the electrolyte ph to 3. The cathodic polarization curves of both as-received and etched 2A97-T4 alloys are displayed in Figure 6.18 (d), exhibiting the cathodic behaviour difference between the alloy matrix and the copper-enriched layer along the corrosion crevice wall. It is noticed that the general shapes of the polarization curves are similar with each other. However, the corrosion potential of the as-received alloy is more negative than that of the etched alloy whereas the cathodic current density of the as-received specimen is much lower than that of the etched specimen in a wide range of 275
276 Chapter 6: Corrosion Behaviour of 2A97 Aluminium Alloy potentials, which is consistent with the conclusions from the previous study [189]. Therefore, the corrosion crevice wall decorated by the copper rich layer displays different electrochemical properties relative to the alloy matrix, which will significantly affect the localized corrosion behaviour in 2A97-T4 alloy Localized corrosion in artificially aged alloy General observation The corrosion morphology of 2A97-T6 Al-Cu-Li alloy after the immersion testing for various periods is relatively stable with the selective attack of the grain interior as the dominant corrosion morphology. Therefore, the matrix dissolution behaviour in the 2A97-T6 aluminium alloy is the focus of the present study. Due to the similarity of the corrosion morphology of 2A97-T6 aluminium alloy during the immersion testing for various periods, only typical SEM micrographs of the stable localized corrosion sites after 5 hours immersion in a 3.5 wt. % NaCl solution are displayed. The surface plan-view of the typical stable localized corrosion site is shown in Figure 6.19 (a), displaying a semi-circle corrosion product ring surrounding a few corrosion product domes. A shallow cavity of micrometre scale dimension is evident, as marked in Figure 6.19 (a), which is possibly from the removal of the intermetallic particle on the alloy surface. Additionally, corrosion pits with the dimensions ranging from several hundred nanometres to several microns were also detected from the plan-view SEM micrograph (Figure 6.19 (a)), which is the consequence from the selective attack of grain interior. Due to the limited information from the plan-view of the stable localized corrosion site, the cross section along the A-A line (shown in Figure 6.19 (a)) was obtained with ultramicrotomy. Figure 6.19 (b) displays the general view of the cross section, exhibiting the similar corrosion morphology with that on the alloy surface. Corrosion pits, with the dimensions ranging from several hundred nanometres to several microns, are evident on the cross section as a consequence of selective dissolution of the alloy matrix. What s more, the individual corrosion pit on the cross section is supposed to connect with each other since the electrolyte providing necessary chemical condition has to be transported to the sub-surface area via continuous corrosion propagation path 276
277 Chapter 6: Corrosion Behaviour of 2A97 Aluminium Alloy [71, 104]. However, the individual corrosion pits instead of the continuous corrosion propagation path exhibited on the cross section, indicating the corrosion developed in all directions, laterally as well as in depth, which leads to a relatively large corrosion volume beneath the alloy surface. Figure 6.19 (c) exhibits the framed area in Figure 6.19 (b) at increased magnification, displaying the morphology of the corrosion pits. It is evident that corrosion pits in welldefined shapes are surrounded by step-like pit walls and scalloped corrosion fronts, suggesting the crystallographic features of the matrix dissolution process. Additionally, as marked with the red arrow in Figure 6.19 (c), parallel planes were detected, providing solid evidence about the crystallographic features during the matrix dissolution in 2A97-T6 alloy. Therefore, the corrosion pit in the grain interior is the consequence of crystallographic pitting. However, the facets of crystallographic pits in the 2A97-T6 alloy are less well-defined with respect to the sharp crystallographic pit walls in pure aluminium [138, 139]. Comparing with the typical crystallographic pit developed in pure aluminium, the polyhedron-shaped crystallographic pit developed in 2A97-T6 alloy display scalloped pit walls in a finer scale. Another typical cross section of the stable localized corrosion site is shown in Figure 6.19 (d), displaying corroded volume in the form of bands beneath the alloy surface, i.e. banding structure along certain orientation. The banding structure penetrated deep beneath the alloy surface along the orientation, as indicated with the white lines. SEM micrograph of the banding structure is shown in Figure 6.19 (e) at increased magnification, suggesting that the corrosion band along certain orientation is comprised of numerous crystallographic pits. Therefore, the presence of a preferred direction during the crystallographic pitting contributes to the development of corrosion banding structure. Similar with the corrosion morphology displayed in Figure 6.19 (c), crystallographic pits are bounded by step-like corrosion walls and scalloped corrosion fronts, confirming the high susceptibility of crystallographic pitting in 2A97-T6 alloy Grain-stored energy and crystallographic features In order to correlate the localized corrosion mechanism with the local alloy microstructure in the 2A97-T6 alloy, EBSD analysis was carried out in the region containing a typical stable localized corrosion site. What s more, the Kikuchi pattern 277
278 Chapter 6: Corrosion Behaviour of 2A97 Aluminium Alloy was obtained to examine the crystallographic features of the matrix dissolution behaviour. The preferred propagation direction of the banding structure and the crystallographic orientation of the crystallographic pit walls were identified using local Kikuchi pattern. After 5 hours immersion in a 3.5 wt. % NaCl solution, the specimen was gently polished with 1 µm diamond paste to remove the corrosion product following with argon gas plasma cleaning to create a stress-free surface for EBSD analysis. SEM micrograph of the selected stable localized corrosion site after GDOS cleaning is displayed in Figure 6.20 (a), exhibiting the typical corrosion feature, i.e. the selective attack of grain interior, in the region. During the GDOS cleaning, the preferential attack of alloy matrix in the periphery of intermetallic particles undermines the particles, resulting in the removal of intermetallic particles, leaving several small cavities of micrometre scale dimensions on the alloy surface, as marked in Figure 6.20 (a). Due to the low diffraction intensity of the cavities, the localized corrosion site with crystallographic pits along with the cavities related with intermetallic particles was not indexed. Further, the grain boundary was preferentially attacked during the plasma cleaning process, resulting in the narrow bands as marked in Figure 6.20 (a). The grain boundary was non-indexed due to the overlapping of Kikuchi patterns. Close examination of the stable localized corrosion reveals the banding structural morphology along certain orientation as shown in Figure 6.20 (b). Figure 6.20 (c) displays the crystallographic orientation distribution of the region in Euler s colours. The corresponding grain-stored energy map of the same area was also determined using EBSD analysis and displayed as a grey-scale map in Figure 6.20 (d), with brighter appearance representing higher level of stored energy. The location of the stable localized corrosion site is marked with the white arrow in Figure 6.20 (d). It is evident that localized corrosion tends to locate in the grain with relatively high level of stored energy, leaving the grain with lower stored energy intact. The preferential attack in the grain with higher stored energy indicates its higher corrosion susceptibility with respect to that with lower level of stored energy in the 2A97-T6 alloy, correlating the grain-stored energy to the corrosion susceptibility of the individual grain. In the present study of 2A97-T6 alloy, when the orientation difference between two neighbouring pixels is higher than 1, a dislocation is considered to be introduced at the 278
279 Chapter 6: Corrosion Behaviour of 2A97 Aluminium Alloy corresponding location. The distribution of dislocations (i.e. misorientation), as shown in Figure 6.20 (e), exhibits the similar distribution with that of grain-stored energy in the region (Figure 6.20 (d)), correlating the population density of dislocations to the grain-stored energy. Apparently, the grain with brighter appearance in the grain-stored energy map has the higher population density of dislocations, indicating that grainstored energy represents the density of dislocations within the individual grain. The Kikuchi pattern was obtained from the marked location (the red point) as shown in Figure 6.20 (a), with the Kikuchi pattern along with the corresponding indexed result shown in Figures 6.20 (f)-(g). It is revealed that the banding structure developed in the direction parallel with {111} oriented plane. Corrosion banding structure at the stable localized corrosion site is widely existed on the surface of 2A97-T6 aluminium alloy after 5 hours immersion in a 3.5 wt. % NaCl solution. To better maintain the corrosion morphology after the immersion testing, following the gentle polishing with 1 µm diamond paste to remove the corrosion product, OPS chemical polishing instead of plasma cleaning was carried out to remove the near surface deformed layer to create a stress-free surface for EBSD analysis. Figure 6.21 (a) exhibits a typical region containing corroded bands at the localized corrosion site on the alloy surface. The Kikuchi pattern from the marked location shown in Figure 6.21 (a) along with the corresponding indexed result is displayed in Figures 6.21 (c)-(d) to correlate the propagation direction with crystallographic orientations of the alloy matrix. Comparing the SEM micrograph with the corresponding Kikuchi pattern, it is revealed the preferred orientation of the corrosion banding structure is parallel with {111} oriented planes of the alloy matrix. Since the corrosion banding structure is comprised of various crystallographic pits due to the selective dissolution of the alloy matrix, the development of the corrosion banding structure indicates the selective attack of the alloy matrix preferentially develops in the direction parallel with {111} oriented planes at the stable localized corrosion site during the immersion testing. It is evident that the crystallographic pits are bounded by step-like pit walls and scalloped corrosion front. In order to further understand the crystallographic features of the matrix dissolution, the orientation of the pit wall was identified using the corresponding Kikuchi pattern. 279
280 Chapter 6: Corrosion Behaviour of 2A97 Aluminium Alloy Figure 6.21 (b) displays the magnified SEM micrograph of the framed area in Figure 6.21 (a), with the corresponding Kikuchi pattern and the indexed result displayed in Figures 6.21 (c)-(d). Comparing the SEM micrograph and the corresponding Kikuchi pattern, it is revealed that the orientations of step-like corrosion walls are parallel with low index crystal planes of aluminium. Unlike the typical crystallographic pits developed in pure aluminium, the corrosion pit walls in 2A97-T6 alloy could follow {001}, {011} and {111} oriented crystal planes. The combined effect of local composition and the crystallographic feature is responsible for the appearance of all three low index planes as the crystallographic pit walls in 2A97-T6 alloy, which will be elucidated in the discussion section Corrosion front area In order to obtain a better understanding of localized corrosion mechanism, the corrosion front area in 2A97-T6 alloy was investigated with TEM. Thin foils with thickness around 15 nm were generated using ultramicrotomy at the stable localized corrosion site in 2A97-T6 alloy after 5 hours immersion in a 3.5 wt. % NaCl solution. The bright field TEM micrographs in Figures 6.22 (a)-(b) display the typical corrosion morphology in the 2A97-T6 alloy, exhibiting the scalloped corrosion fronts and steplike pit walls of the crystallographic pits. Neighbouring crystallographic pit walls display vertical relationship, as marked with white arrows in Figures 6.22 (a)-(b), suggesting the crystallographic dissolution behaviour in 2A97-T6 alloy. A dark band with the thickness around 2-3 nm is evident along the interface between the alloy matrix and the corrosion product layer, as indicated with the white arrow in Figure 6.22 (b). The presence of dark appearance in the relatively light alloy matrix indicates enhanced electron scattering, suggesting the enrichment of heavy element due to the uniform thickness of ultramicrotomed TEM specimen. HAADF micrographs of typical crystallographic pits are shown in Figures 6.22 (c)-(d). HAADF micrograph is sensitive to the atomic number difference, with the higher brightness representing the higher atomic number. Therefore, the bright appearance of the fine band along the interface between the alloy matrix and the corrosion product layer, as shown in Figures 6.22 (c)-(d), indicates the enrichment of heavy alloying element, supposedly copper in the situation, which is in good agreement with the previous conclusion from the bright field TEM micrographs. 280
281 Chapter 6: Corrosion Behaviour of 2A97 Aluminium Alloy Further, EDX point analysis was performed to investigate the compositional difference between the fine band and the alloy matrix, with the corresponding EDX spectra displayed in Figure 6.22 (e). The increased intensity of copper is shown in the EDX spectrum of point 2 (Figure 6.22 (d)) with respect to that of point 1(Figure 6.22 (d)), indicating higher copper content along the fine band than that of alloy matrix. Therefore, the fine band beneath the corrosion product layer is rich in copper. The compositional difference between the alloy matrix and the band along the corrosion walls at selected area (Figure 6.22 (f)) was further examined using EELS mapping. As the EELS map of copper (Figure 6.22 (g)) displayed, the fine band with higher brightness is evident, indicating its copper rich nature as expected. Surprisingly, the corresponding band also displays high brightness in the Li EELS map as shown in Figure 6.22 (h), suggesting relatively higher content of lithium in the copper-enriched layer. Therefore, during the immersion testing, both lithium and copper enrichment build up along the crystallographic pit walls in 2A97-T6 alloy. The high resolution TEM micrograph of the copper-enriched layer reveals its lattice fringes as shown in Figure 6.22 (i). Fast Fourier transformation (FFT) analysis of the framed area in Figure 6.22 (i) was carried out to obtain the crystallographic structural information of the copper-enriched layer, revealing the copper-enriched layer has the similar structure with Al 2 Cu phase. Therefore, the increased content of Li has limited influence on the crystallographic structure of the copper-enriched layer. The near-surface compositional modification has been extensively studied [170, 171, 187, 188, 199], revealing that after chemical or electrochemical process, a copperenriched layer with the thickness around 2-3 nm could develop along the interface between the residual alumina film and the alloy matrix in the copper-containing aluminium alloys. Due to the high copper content in 2A97-T6 alloys, it is believed that a copper-enriched layer with the dimension around several nanometres occurs on the alloy surface beneath the corrosion product layer after alkaline etching [168]. Detailed TEM and STEM analysis were carried out to examine the etched T6 alloy. A typical bright field TEM micrograph of the cross section of the etched 2A97-T6 alloy is displayed in Figure 6.23 (a), exhibiting the narrow band beneath the residual alumina film after alkaline etching. The narrow band developed during the alkaline etching is also revealed in the HAADF micrograph as shown in Figure 6.23 (b), where the contrast 281
282 Chapter 6: Corrosion Behaviour of 2A97 Aluminium Alloy is from the atomic number difference. As shown in Figure 6.23 (b), the band with the dimension ranging from 2 to 3 nm beneath the residual alumina film displays higher brightness, indicating the increased content of heavy alloying element, supposedly copper in this situation. The EELS mapping was conducted on selected area (Figure 6.23 (c)) of etched 2A97-T6 alloy to explore the distribution of Li. As shown in Figure 6.23 (d), the higher brightness in the Li map is present at the same location of the fine band in Figure 6.23 (c), revealing that the copper-enriched layer on the etched surface is also rich in Li. Further, a high resolution TEM micrograph of the fine band was obtained, displaying the lattice fringe of the copper-enriched layer as shown in Figure 6.23 (e). The FFT result reveals its crystallographic structure, suggesting the copperenriched layer is comprised of Al 2 Cu phase. Therefore, the copper-enriched layer on the etched alloy surface exhibits significant similarity with that along the crystallographic pit walls, which exhibits the similar dimension (2-3 nm), composition (rich in Cu and Li) and crystallographic structure (Al 2 Cu phase structure). Therefore, the etched alloy with copper build-up on the surface has the similar electrochemical properties with the copper-enriched layer beneath the corrosion product layer in the corrosion front area. Additionally, due to the relatively small surface area covered by grain boundaries, the electrochemical properties of the as-received 2A97-T6 alloy are similar with those of the alloy matrix in the corrosion front area. Both as-received and etched 2A97-T6 alloys were applied to cathodic potentiodynamic polarization in a de-aerated testing solution containing 3.5 wt. % NaCl with HCl to adjust the electrolyte ph to 3. The cathodic polarization curves of as-received and etched 2A97-T6 alloys are displayed in Figure 6.23 (f), representing the electrochemical properties of the alloy matrix and the copper-enriched layer in the corrosion front area. The similar shape of the cathodic polarization curves from as-received and etched T6 alloys suggests their similar electrochemical behaviour as the cathode. However, the difference of electrochemical properties between the as-received T6 alloy and etched T6 alloy is evident. The corrosion potential of as-received alloy is more negative than that of etched alloy whereas the cathodic current density of as-received specimen is much lower than that of etched specimen in a wide range of potential. The difference indicates that the copper-enriched layer with a more positive corrosion potential could act as an effective cathode, providing high cathodic current density with respect to the alloy matrix. 282
283 Chapter 6: Corrosion Behaviour of 2A97 Aluminium Alloy Localized corrosion in cold worked and artificially aged alloy General observation As mentioned above, 2A97-T8 alloy has high thermodynamic corrosion susceptibility, displaying selective dissolution of both grain boundary and grain interior during the immersion testing. The corrosion morphology in the 2A97-T8 alloy significantly depends on the immersion time. Therefore, in the present study of 2A97-T8 alloy, the corrosion morphology after 5 hours and 20 hours immersion was investigated. Figure 6.24 displays the SEM micrographs of surface plan-view and the cross sections of a typical stable localized corrosion site in the 2A97-T8 alloy after 5 hours immersion in a 3.5 wt. % NaCl solution at ambient temperature. A corrosion product ring with the diameter around 100 µm is evident at the stable localized corrosion site. Several corrosion pits and corrosion product domes are present within the corrosion product ring as shown in Figure 6.24 (a). Figures 6.24 (b)-(c) display the cross sections of the stable localized corrosion site at the locations indicated by lines A-A and B-B in Figure 6.24 (a). Cross sectional examination at the position A-A line (Figure 6.24 (b)) displays the typical corrosion features of selective matrix dissolution, characterized by corrosion pits with the dimensions ranging from several hundred nanometres to several microns. Corrosion propagated in all directions, laterally as well as in depth, resulting in the penetration depth around 6 µm beneath the alloy surface. Further, as shown in Figure 6.24 (c), the cross section along B-B line displays similar penetration depth with that in the cross section along A-A line. Figure 6.24 (d) displays the framed area 1 in Figure 6.24 (c) at increased magnification, exhibiting attacked grain boundaries together with corrosion pits in the grain interior on the cross section. The extensive attack within the grain interior indicates the high corrosion susceptibility of intragranular corrosion in 2A97-T8 alloy. Attacked grain boundaries are also evident, as indicated by white arrows in Figure 6.24 (d), suggesting the high intergranular corrosion susceptibility in 2A97-T8 alloy. Since the electrolyte has to be transported from the near surface area to sub-surface area via corrosion propagation path to provide the necessary chemical condition for the further development of localized corrosion [71, 104, 181], the various depths of attacked grain interiors and attacked grain boundaries suggest the heterogeneous corrosion susceptibility in 2A97-T8 alloy. Besides, the 283
284 Chapter 6: Corrosion Behaviour of 2A97 Aluminium Alloy individual corrosion pits, rather than the continuous corroded volume, shown on the cross section in Figure 6.24 (d), suggest the corrosion propagated in all direction, resulting in the larger reaction volume beneath the alloy surface. Figures 6.24 (e)-(f) display the framed areas 2 and 3 in Figure 6.24 (c) at increased magnification, exhibiting the presence of corrosion pits of various dimensions as well as attacked intermetallic particles. The intermetallic particles in the framed areas display porous morphology as shown in Figures 6.24 (e)-(f). And the banding structure along certain orientation in the intermetallic particle, as marked in Figure 6.24 (f), is consistent with that shown in Figure 6.3, suggesting the occurrence of the selective dissolution in the intermetallic particle. However, no intermetallic particle is found on most cross sections, suggesting limited influence of intermetallic particles on the development of stable localized corrosion site in 2A97-T8 alloy, which is in good agreement with related literature [175]. Scanning electron microscope (SEM) was also employed to examine the typical stable localized corrosion sites in 2A97-T8 alloy after 20 hours immersion in a 3.5 wt. % NaCl solution at ambient temperature. Typical surface plan-view SEM micrographs of stable localized corrosion sites are shown in Figures 6.25 (a)-(c), exhibiting selective attack of grain interiors and grain boundaries. It is evident that the corroded volume is elongated in the rolling direction, suggesting the corrosion preferentially developed along the rolling direction. Scrutiny of Figures 6.25 (a)-(c) reveals that corrosion pits within grain area are always surrounded by attacked grain/subgrain boundaries, while attacked grain/subgrain boundaries not necessarily resulted in the selective dissolution of the corresponding grain interior, suggesting that the grain boundary has higher corrosion susceptibility than the grain interior. Therefore, the selective attack first occurred along the grain boundary and, subsequently, developed into the grain interior during the immersion testing. Additionally, corrosion banding structure, which developed along certain orientation, was also noticed as shown in Figure 6.25 (b). Close examination of the corroded region on the alloy surface reveals that the corrosion pits within the alloy matrix, which are surrounded by step-like pit walls, exhibit welldefined shapes, as shown in Figure 6.25 (d), suggesting the crystallographic features of the matrix dissolution in the 2A97-T8 alloy. 284
285 Chapter 6: Corrosion Behaviour of 2A97 Aluminium Alloy A typical cross section of the stable localized corrosion site is shown in Figures 6.25 (e)-(f) at different magnifications, displaying attacked grain boundaries and crystallographic pits due to the selective dissolution of grain interior. The elongated grain shape delineated by attacked grain boundaries, which is comparable with that in the as-received 2A97-T8 alloy (Figure 4.32), indicates the plastic deformation induced by the cold working to obtain T8 temper. As mentioned above, since the testing solution transports to the sub-surface area via corrosion propagation path, the area near the alloy surface contacts with the aggressive electrolyte earlier than that further away from the alloy surface. Therefore, the attacked grain interiors in various depths indicate the different corrosion susceptibility of individual grains due to the intrinsic factors. For example, as shown in Figure 6.25 (f), grain A close to the alloy surface remained generally intact, whereas grain B away from the alloy surface area was preferentially attacked. The electrolyte penetrated into the specimen from the surface, resulting in the longer immersion time in the corrosive environment of grain A than that of grain B. However, the selective attack of grain B instead of grain A suggests corrosion susceptibility difference depending on the intrinsic microstructure. Similarly, the attacked grain boundaries at various corrosion depths indicate the intergranular corrosion susceptibility difference, which also depends on the intrinsic factors of grain boundaries Grain-stored energy and crystallographic features In order to further understand the relationship between the corrosion propagation mechanism and local grain structure, especially to correlate the grain-stored energy distribution with the localized corrosion propagation, the 2A97-T8 alloy with high level of plastic deformation was employed with its grain structure displayed in Figure A typical region was selected for EBSD scanning. The crystallographic orientation distribution of the region in Euler s colour is shown in Figure 6.26 (a) with yellow lines and black lines representing the high angle grain boundaries (HAGB, θ>15 ) and low angle grain boundaries (LAGB, 1 <θ<15 ), respectively. The elongated shape of grains as shown in Figure 6.26 (a) indicates the severe plastic deformation introduced to obtain T8 temper. The texture developed during the fabrication process is evident as shown in the corresponding IPFZ map (Figure 6.26 (b)), suggesting the dominant grain orientation on the alloy surface parallel with {011} oriented planes. Additionally, the distribution of grain-stored energy is displayed as shown in Figures 6.26 (c)-(d), with 285
286 Chapter 6: Corrosion Behaviour of 2A97 Aluminium Alloy different brightness representing different levels of stored energy of subgrains (average within the area bounded by LAGB, Figure 6.26 (c)) and grains (average within the area bounded by HAGB, Figure 6.26 (d)), respectively. The evident stored energy difference of individual grains/subgrains, as shown Figures 6.26 (c)-(d), suggests it is a proper specimen to explore the influence of grain-stored energy on localized corrosion behaviour. The localized corrosion behaviour of the alloy was examined with SEM after the immersion testing. After 20 hours immersion time in a 3.5 wt. % NaCl solution at ambient temperature, typical corrosion morphology of stable localized corrosion site, i.e. selective attack of the grain interior and the grain boundary, is evident on the surface of 2A97-T8 alloy, as shown in Figure Similar with that in Figure 6.25, the localized corrosion is elongated along the rolling direction as shown in Figures 6.27 (a)-(b). It is exhibited that the selective elongated grain was attacked, leaving the adjacent matrix intact, which suggests the heterogeneous corrosion susceptibility of grains in 2A97-T8 alloy. Since these grains on the alloy surface were exposed to the same corrosive environment for the same periods, the selective attack of elongated grains is attributed to the intrinsic microstructural difference of individual grains. The corrosion front area, displays similar corrosion features with that shown in Figures , exhibiting attacked grain boundaries and crystallographic pits in the grain interior (Figures 6.27 (c)-(d)). Additionally, the corrosion banding structure along certain orientation is evident as shown in Figure 6.27 (e), which is consistent with that in Figure 6.25 (b). The morphology of crystallographic pits in the corrosion front area is shown in Figure 6.27 (f) at increased magnification, revealing the pits are surrounded by step-like corrosion walls. Most neighbouring pits wall around the crystallographic pits exhibits vertical orientations, corresponding to {001} oriented planes of the alloy matrix, which suggests the crystallographic features during the matrix dissolution in 2A97-T8 alloy. Therefore, comparing the SEM micrographs in Figure 6.27 and those in Figures , it is evident that 2A97-T8 alloys with different levels of cold working displays similar corrosion features, with selective attack of the inner region within the grain and grain boundaries as the dominant corrosion morphologies. After the immersion in a 3.5 wt. % NaCl solution for 20 hours, the specimen was gently polished with 1 µm diamond paste to remove the corrosion product following with argon gas plasma cleaning to create a stress-free surface prior to EBSD analysis. The 286
287 Chapter 6: Corrosion Behaviour of 2A97 Aluminium Alloy SEM micrograph of 2A97-T8 alloy surface after 20 hours immersion in a 3.5 wt. % NaCl solution is displayed in Figure 6.28 (a). The corrosion morphology of the selected localized corrosion site is exhibited in Figure 6.28 (b) at increased magnification, displaying the selective attack of grain boundary and grain interior. Due to the low diffraction intensity from the attacked alloy matrix, the localized corrosion site was not indexed. The crystallographic orientation distribution of the corresponding area is displayed in Figure 6.28 (c) with Euler s colours representing different crystallographic orientations. It is revealed that selectively attacked region belongs to an individual grain bound by HAGBs. The grain-stored energy distribution of the corresponding area was also determined by EBSD analysis, which was displayed as a grey-scale map in Figure 6.28 (d), with brighter appearance representing higher level of grain-stored energy. The location of the stable localized corrosion site is marked with arrows in Figures 6.28 (c)-(d), respectively. It is evident localized corrosion tends to locate in the grain with higher level of stored energy, leaving the grain with lower stored energy intact, which correlate high stored energy to high corrosion susceptibility. Furthermore, the crystallographic dissolution behaviour in 2A97-T8 alloy was also analysed using the local Kikuchi pattern. Figure 6.29 (a) displays the corrosion banding structure along well-defined orientation at the stable localized corrosion site on the alloy surface after 20 hours immersion in a 3.5 wt. % NaCl solution. The Kikuchi pattern was obtained from the intact alloy matrix in the periphery of the stable localized corrosion site, which is displayed in Figures 6.29 (b)-(c) along with its corresponding indexed result. Comparing the SEM micrograph in Figure 6.29 (a) and the indexed result (Figure 6.29 (c)), it is evident that the corrosion banding structure developed in the direction parallel with {001} oriented plane. It is worth mentioning that even though the corrosion banding structure exists in 2A97-T8 aluminium alloy, it is much less widely existed with respect to that in 2A97-T4 and 2A97-T6 alloys, which will be explained in the discussion section. Figures 6.29 (d)-(e) displays the corrosion pits at the typical stable localized corrosion site shown in Figure 6.29 (a) at increased magnifications. It is exhibited that corrosion pits are in well-defined polyhedral shapes, bounded by scalloped corrosion fronts and step-like pit walls along certain orientations. It is also evident that the neighbouring pit walls exhibit vertical orientation relationship, corresponding to the orientation 287
288 Chapter 6: Corrosion Behaviour of 2A97 Aluminium Alloy relationship between two {001} planes in the alloy matrix. Therefore, the corrosion morphology suggests the crystallographic features of the selective dissolution of the alloy matrix in 2A97-T8 alloy. Comparing the corrosion morphology of crystallographic pits with the Kikuchi pattern obtained from the surrounding intact alloy matrix within the same grain, it is revealed that most step-like pit walls follow {001} oriented planes, resulting in the vertical orientation relationship between neighbouring pit walls. In addition, the pit walls along {011} and {111} oriented planes were also detected with relatively low population densities. It is believed that the combined effect of crystallographic dissolution behaviour and local composition is responsible for the crystallographic pitting in the 2A97-T8 alloy Corrosion front area In order to further understand the corrosion propagation mechanism, TEM was employed to investigate the corrosion front area at the stable localized corrosion site. Thin foils with the dimensions of 15 nm were generated with ultramicrotomy at the stable localized corrosion site of 2A97-T8 alloy after the immersion in a 3.5 wt. % NaCl solution for 5 hours. Bright field TEM micrographs of crystallographic pits are displayed in Figures 6.30 (a)- (b) at different magnifications. Heterogeneous attack of the grain interior is evident, with the preferential attack of grain A rather than grain B as shown in Figure 6.30 (a). Figure 6.30 (b) displays the crystallographic pit in grain B at increased magnification, exhibiting its step-like morphology. Scrutiny of Figure 6.30 (b) reveals a fine dark band with the thickness around 2-3 nm along the crystallographic pit walls between the alloy matrix and the corrosion product layer. As mentioned above, the dark band is likely to be a copper-enriched layer, which is confirmed by the EDX point analysis. Two EDX spectra obtained from the alloy matrix (point 1 in Figure 6.30 (b)) and the dark band (point 2 in Figure 6.30 (b)) along the pit wall are displayed in Figure 6.30 (c), exhibiting the increased intensity of copper at the dark band with respect to that of alloy matrix. Therefore, the dark band along the pit walls beneath the corrosion product layer is rich in copper. Further, Figure 6.30 (d) displays a bright field transmission electron micrograph of the attacked grain boundary in 2A97-T8 aluminium alloy. As shown in Figure 6.30 (d), 288
289 Chapter 6: Corrosion Behaviour of 2A97 Aluminium Alloy corrosion was not confined within the area immediately adjacent to the grain boundary, but unevenly developed into grain interior of neighbouring grains with preferential development into grain C instead of grain D. The heterogeneous attack is attributed to the different corrosion susceptibility, which is likely to be linked to the grain-stored energy difference. As expected, the dark band with similar thickness around 2-3 nm was observed along the corrosion crevice wall. The HAADF micrograph of the corresponding localized corrosion site in Figure 6.30 (d) is displayed in Figure 6.30 (e), where the contrast difference represents the difference of atomic numbers. As shown in Figure 6.30 (e), a bright band with the dimension around 2-3 nm is evident, confirming the enrichment of heavy alloying elements at the interface beneath the corrosion product layer in 2A97-T8 alloy. EDX point analysis was performed at the marked points in Figure 6.30 (e) with the corresponding EDX spectra displayed in Figure 6.30 (f), revealing the increased yield of copper at the dark band and, consequently, confirming the existence of a copper-enriched layer beneath the corrosion product layer along the corrosion crevice wall. In addition, EELS mapping was also performed on a region containing localized corrosion in 2A97-T8 alloy. The Bright field TEM micrograph shown in Figure 6.30 (g) displays the area for EELS analysis, with the corresponding EELS Li map shown in Figure 6.30 (h). The Li map exhibits the bright band of the similar dimension with that of the copper-enriched layer along the interface between the alloy matrix and corrosion product layer. Therefore, the copper-enriched layer along the corrosion pit walls is also lithium rich in 2A97-T8 alloy. The lattice fringe of the copper-enriched layer is displayed in the high resolution TEM micrograph as shown in Figure 6.30 (i). With the FFT analysis (inset Figure 6.30 (i)), the crystallographic parameters of the copper-enriched layer were obtained, suggesting the copper-enriched layer has the similar crystallographic structure with Al 2 Cu phase, Therefore, Li atoms have no evident influence on the crystallographic structure of the copper-enriched layer even though high Li content was detected in the copper-enriched layer. The copper-enriched layer of nanometre scale dimension has been widely reported in the copper-containing aluminium alloy after chemical and electrochemical process [171, 183, 185, 187, 188]. Therefore, after alkaline etching, a copper-enriched layer with the 289
290 Chapter 6: Corrosion Behaviour of 2A97 Aluminium Alloy dimension around several nanometres is expected on the surface of 2A97-T8 alloy due to its high content of copper. Figure 6.31 (a) shows a bright field TEM micrograph of the etched 2A97-T8 alloy cross section, displaying a dark band with the thickness around 2 nm between the alloy matrix and residual alumina film, indicating the existence of a copper rich layer. Therefore, it is believed that the etched 2A97-T8 with a copper-enriched layer on its surface has similar electrochemical properties with the copper build-up in the corrosion front area a. Meanwhile, as-received 2A97-T8 alloy is supposed to have similar electrochemical properties with the alloy matrix due to the limited surface area covered by grain boundaries. Both as-received and etched 2A97-T8 alloys were applied to de-aerated cathodic potentiodynamic polarization in a testing solution containing 3.5 wt. % NaCl with HCl to adjust the electrolyte ph to 3. The cathodic polarization curves are displayed in Figure 6.31 (b), displaying the cathodic behaviour difference between the alloy matrix and the copper-enriched layer in the corrosion front area. The corrosion potential of the as-received alloy is more negative than that of the etched alloy whereas the current density of as-received specimen is much lower than that of etched specimen. Therefore, the copper-enriched layer significantly alters the electrochemical behaviour of the alloy, resulting in a positive shift of its corrosion potential along with the increased cathodic current density. 6.3 Discussion The influence of thermomechanical history on localized corrosion It is believed that various thermomechanical treatments result in different degrees of precipitation in the alloys, which may subsequently affect the corrosion behaviour. As revealed in the microstructural characterization, the thermomechanical history significantly affects the development of T 1 phase precipitates in the 2A97 Al-Cu-Li alloys. Further, previous work suggested the distribution of T 1 phase precipitates has a significant impact on the corrosion behaviour of Al-Cu-Li alloys [122, 163, 200]. Therefore, the corrosion behaviour of the 2A97 Al-Cu-Li alloys is sensitive to thermomechanical treatments. 290
291 Chapter 6: Corrosion Behaviour of 2A97 Aluminium Alloy Corrosion potential Figure 6.32 displays the schematic diagrams of the distributions of T 1 phase precipitates as a function of the thermomechanical conditions. In the diagrams, the needle-shaped symbol represents T 1 phase precipitates and the grey level indicates the copper content in the alloy matrix. The brightness in the diagram is proportional to the copper content in the alloy matrix, with the darkest appearance representing the lowest copper content. As suggested in related literature [122, 201], the alloy can be considered as a composition material comprised of the alloy matrix and grain boundary network. Due to the negligible surface area where the grain boundaries intersect the alloy surface, the corrosion potential of the alloy is mainly dependent on the corrosion potential of the alloy matrix. Since copper has a more positive electrochemical potential relative to aluminium, the decreased copper content in the alloy matrix results in the negative shift of corrosion potential of the alloy, which is consistent with what has been observed in related work [1, 122, 202]. Further, due to the high Li content in T 1 phase, the T 1 phase precipitate has a more negative corrosion potential (around mv vs SCE [120]) with respect to the aluminium (around -750 mv vs SCE [83]). Therefore, the formation of matrix T 1 phase precipitates results in a negative shift of the potential of the alloy matrix, which, consequently, lowers the corrosion potential of the alloy. Meanwhile, the formation of T 1 phase precipitates consumes copper. Thus, the T 1 phase precipitation results in the decreased copper content in the alloy matrix, leading to the further negative shift of the corrosion potential of the alloy. As a result, the combined effect of the presence of T 1 phase precipitates in the alloy matrix and the copper depletion due to the T 1 phase precipitation results in the negative shift of corrosion potential of the alloy. Therefore, with high population density of T 1 phase precipitates developed during the thermomechanical process, a negative shift of corrosion potential of the 2A97 Al-Cu-Li alloy is expected. As revealed in Figure 6.32, both 2A97-T3 and 2A97-T4 alloys display little evidence of T 1 phase precipitates in the alloy matrix. As a consequence of extra cold working to obtain T3 temper, extra driving force for the precipitation in the alloy is provided [46]. As a result, the increased population density of copper-containing precipitates, including T 1 phase precipitates, θ phase precipitates and possibly GP zones, developed 291
292 Chapter 6: Corrosion Behaviour of 2A97 Aluminium Alloy along the grain boundary network due to the higher dislocation density in the grain boundary area than average level of the grain interior. Consequently, the copper content in the matrix of T3 alloy is lower than that of T4 alloy. The copper content difference in the alloy matrix contributes to the more negative corrosion potential of the 2A97-T3 alloy than that of 2A97-T4 alloy, which is consistent with the electrochemical measurement result as shown in Figure 6.8. To the 2A97-T6 and 2A97-T8 aluminium alloys, since artificial ageing significantly promotes the precipitation of T 1 phase, alloys in both tempers display much higher population density of T 1 phase precipitates, resulting in a more negative corrosion potential of alloys in T6 and T8 conditions than that in T3 and T4 conditions. However, to achieve T8 temper, the alloy experiences extra cold working prior to artificial ageing, which further promotes the nucleation of matrix T 1 phase precipitation by providing high population density of dislocations in the alloy matrix [44, 45, 47, 203]. With the increased amount of matrix T 1 phase precipitates developed, the corrosion potential of T8 alloy is further lower, leading to the difference of the corrosion potential between the T6 and the T8 alloys as shown in Figure 6.8. The difference of corrosion potentials in the 2A97 alloys of various tempers indicates the different corrosion susceptibility (Figure 6.8). Therefore, thermodynamically, the localized corrosion susceptibility of 2A97 Al-Cu-Li alloys follows the increasing order: T4<T3<T6<T Corrosion morphology The corrosion morphology developed during the immersion testing is closely associated with the distribution of T 1 phase precipitates in the Al-Cu-Li alloys [122, 124, ]. For the alloys in T3 condition, without artificial ageing, the formation of T 1 phase precipitates is significantly retarded. T 1 phase precipitates mainly distribute along selective grain boundary due to its less order in atomic arrangement, which results in higher population density of dislocations in grain boundary area with respect to that of grain interior. Thus, T 1 phase precipitates along the grain boundary are evident in the 2A97-T3 alloy with the absence of T 1 phase precipitates in the alloy matrix. During the immersion testing in a 3.5 wt. % NaCl solution up to 20 hours, corrosion developed in the form of intergranular corrosion with selected grain boundaries attacked 292
293 Chapter 6: Corrosion Behaviour of 2A97 Aluminium Alloy as shown in Figure 6.9. Further, the width of corrosion crevice introduced by intergranular attack is similar with that of the corrosion front area (Figure 6.11), indicating the absence of grain interior attack in the 2A97-T3 alloy. Due to the more negative corrosion potential of T 1 phase precipitates comparing with the alloy matrix, the grain boundary decorated with T 1 phase precipitates acts as the anode when coupling with grain interior, resulting in the development of intergranular corrosion in T3 alloy. Since little evidence of T 1 phase precipitates is revealed in the matrix of T3 alloy, the corrosion susceptibility of grain boundary is much higher than that of alloy matrix, leading to the selective attack of grain boundary with no grain interior attack. Additionally, the development of copper-enriched layer along the corrosion crevice contributes to relatively low intragranular corrosion susceptibility in T3 alloy. With the cathodic reduction of protons at the copper-enriched layer, the concentration of proton drops leading to the increase of ph of the local chemical environment, thereby preventing further significant attack into the grain interior. Heterogeneous distribution of T 1 phase precipitates is evident in the 2A97-T4 alloy. As a consequence of natural ageing without pre-ageing cold working, most T 1 phase precipitates distribute along selective grain boundaries. Meanwhile, selective grain interiors are decorated with T 1 phase precipitates of relatively low population densities with the typical examples shown in Figure After the immersion in a 3.5 wt. % NaCl solution for 5 hours, the corrosion attack in the 2A97-T4 alloy was confined to the grain boundary areas, leaving the grain interior almost intact (Figure 6.13). Selective attack of grain interior developed with prolonged immersion time to 20 hours (Figure 6.14). Therefore, the 2A97-T4 alloy has a relatively higher corrosion susceptibility of grain boundary than that of grain interior. The similar T 1 phase precipitate distribution between T3 and T4 alloys, i.e. most T 1 phase precipitates distributing along grain boundary network, leads to the similar corrosion morphology, with the attacked grain boundary as the dominant corrosion morphology. The difference in corrosion morphology between the 2A97-T3 and the 2A97-T4 alloys is related to the selective attack of grain interior. Little evidence of T 1 phase precipitates in the alloy matrix was detected in 2A97-T3 alloy, in contrast to the heterogeneous distribution of T 1 phase precipitates in the matrix of 2A97-T4 alloy. The 293
294 Chapter 6: Corrosion Behaviour of 2A97 Aluminium Alloy T 1 phase precipitates in the matrix of T4 alloy facilitates the selective attack of grain interior, contributing to its high intragranular corrosion susceptibility. For the 2A97 alloy in T6 condition, due to the artificial ageing, high population density of T 1 phase precipitates are evident within the alloy matrix, resulting in the relatively high corrosion susceptibility of the alloy matrix. On the contrary, precipitate free zones widely existed in the 2A97-T6 alloy with coarse second phase particles decorating the grain boundaries, leading to the low population density of T 1 phase precipitates in the grain boundary area. Previous literature indicates the development of precipitate free zone is responsible for the high intergranular corrosion susceptibility in Al-Cu-Li alloys due to the microcoupling between the precipitate free zone and the grain boundary [52, 112, 114, 165]. However, different corrosion morphology is displayed in 2A97-T6 alloy, with no attacked grain boundary detected after the immersion in a 3.5 wt. % NaCl solution up to 20 hours (Figure 6.19). In contrast to the absence of attacked grain boundaries, selective dissolution of grain interior is evident in the 2A97-T6 alloy. The absence of T 1 phase precipitates along the grain boundary area results in its more positive corrosion potential with respect to that of alloy matrix, which is decorated with high population density of T 1 phase precipitates. During the immersion testing, the coupling between the grain boundary area and the grain interior in 2A97-T6 alloy results in the preferential dissolution of the more anodic part, namely the grain interior, leading to selective attack of grain interior and leaving the grain boundary intact. Therefore, the dominant corrosion features are crystallographic pits induced by the matrix dissolution with little evidence of intergranular corrosion in 2A97-T6 alloy, suggesting the relatively high intragranular corrosion susceptibility of T6 alloy. With extra cold working prior to artificial ageing to obtain T8 temper, both grain interior and grain boundary are decorated with high population density of T 1 phase precipitates in 2A97-T8 alloy. Therefore, the coupling between grain boundary area and inner region of the grain is not the dominant factor. Instead, the micro-coupling between the T 1 phase precipitates and the alloy matrix in the periphery significantly affects the localized corrosion behaviour and the resultant corrosion morphology developed in 2A97-T8 Al-Cu-Li alloy during the immersion testing. Due to the negative corrosion potential of T 1 phase precipitates, selective attack of both grain boundary and grain 294
295 Chapter 6: Corrosion Behaviour of 2A97 Aluminium Alloy interior in 2A97-T8 alloy is evident after the immersion in a 3.5 wt. % NaCl solution as shown in Figures Therefore, both grain boundary and grain interior are highly susceptible to localized corrosion in 2A97-T8 alloy Crystallographic dissolution behaviour Except 2A97-T3 aluminium alloy with low intragranular corrosion susceptibility, the selective dissolution of the alloy matrix is present in 2A97 alloys of T4, T6 and T8 tempers during the immersion testing in a 3.5 wt. % NaCl solution. Generally, in the 2A97 Al-Cu-Li alloys, following the initiation of matrix dissolution, the corrosion within the grain interior develops in form of crystallographic pits. Crystallographic pits in the grain interior display well-defined shapes, which are bounded by step-like pit walls along certain orientation (Figure 6.14 (f), Figure 6.19 (c) and Figure 6.25 (d)). However, typical polyhedron-shaped crystallographic pits of nanometre scale dimensions are not like the typical crystallographic pits developed in high purity aluminium. It is believed that the crystallographic pitting in Al-Cu-Li alloys is attributed to the combined effect of crystallographic structure and local chemical composition due to the high alloying element contents. In the 2A97-T4 aluminium alloy, in contrast to the absence of crystallographic pits within the grain interior after 5 hours immersion in a 3.5 wt. % NaCl solution (Figure 6.13), selective dissolution of grain interior is evident after 20 hours immersion (Figure 6.14)), indicating the selective dissolution of grain interior is a relatively late stage corrosion activity developed following selective grain boundary attack. Besides, the crystallographic pits in 2A97-T4 alloy display less sharp facets comparing to T6 and T8 alloys, indicating the limited influence of crystallographic features on the intragranular corrosion development. In the 2A97-T6 aluminium alloy, crystallographic pits bounded by step-like pit walls were widely detected. The well-defined facets following certain orientation within the crystallographic pit are displayed in Figure 6.19, indicating the crystallographic dissolution of grain interior. Furthermore, the local Kikuchi pattern reveals the orientations of pit walls are generally parallel with {001}, {011} and {111} oriented planes of aluminium, as shown in Figure 6.21, indicating the pit walls preferentially developed in the directions parallel with low index planes of aluminium. Additionally, TEM observation of the crystallographic pit at the stable localized corrosion site reveals 295
296 Chapter 6: Corrosion Behaviour of 2A97 Aluminium Alloy its crystallographic features with the scalloped corrosion fronts and step-like pit walls. The orientation relationship of the pit walls corresponds to that between {001} planes (Figures 6.22 (a)-(b)), further confirming the crystallographic dissolution behaviour in T6 alloy. However, the morphology of the crystallographic pits at the stable localized corrosion site is significantly different from that of the typical crystallographic corrosion in high purity aluminium, which is characterized with crystallographic pits bounded by sharp and well-defined pit walls in a much larger dimension [138, 139, 141]. With a significant number of pit walls investigated, it was found that pit walls following {111} and {001} oriented planes are more popular than those following {011} oriented planes in 2A97-T6 aluminium alloy. The preferential attack associated with matrix T 1 phase precipitates along {111} planes and θ phase (Al 2 Cu) precipitates along {001} planes may contribute to the relatively high population density of {111} and {001} oriented planes as the pit walls in 2A97-T6 aluminium alloy. Similarly, in the 2A97-T8 aluminium alloy, the localized corrosion could develop into selective grain interior due to high population density of T 1 phase precipitates in the alloy matrix. The stable localized corrosion after the immersion in a 3.5 wt. % NaCl testing solution displays high population density of corrosion pits. As shown in Figures 6.29 (d)-(e), the pits display well-defined shapes surrounded by scalloped corrosion fronts and step-like pit walls along certain orientations, indicating crystallographic features of matrix dissolution. Further, scrutiny of the corrosion morphology of crystallographic pits reveals the neighbouring pit walls are generally oriented around 90 to each other, corresponding to the orientation relationship between two {001} planes, which suggests the dominant role of {001} oriented planes as the crystallographic pit walls. What s more, the crystallographic features of the selective attack of grain interior in 2A97-T8 alloy were disclosed with the local Kikuchi pattern as shown in Figure 6.29, confirming that the pit walls are generally parallel with {001} oriented planes. Therefore, the influence of crystallographic features on the corrosion propagation in 2A97-T8 alloy is evident, with {001} oriented planes as the dominant pit walls around crystallographic pits. Thermodynamically, the stability of {001} oriented plane is higher than other planes due to its lower atomic population density. As a result, pit walls preferentially reach {001} oriented planes to achieve high stability during the crystallographic dissolution of high purity aluminium. However, the presence of the scalloped corrosion fronts along 296
297 Chapter 6: Corrosion Behaviour of 2A97 Aluminium Alloy with the pit walls following {011} and {111} oriented planes surrounding the crystallographic pits in the Al-Cu-Li alloys indicate its less typical crystallographic corrosion behaviour with respect to that in pure aluminium. It is the result of the combined effect of crystallographic structure and local compositions. Similar with AA2024 alloy as discussed in section 5.2.3, it is believed that the copper-enriched layer, which developed along the pit walls in 2A97 Al-Cu-Li alloys, disrupts the typical crystallographic corrosion process. Especially, when there is a high angle between the current planes and {001} oriented plane, the atom removal fails to be in a high order of directionality [142]. The detailed investigation on the corrosion behaviour of pure aluminium reveals the high population density of well-defined facets and steps along {001} planes and <001> directions in the typical crystallographic pits due to the preferential dissolution occurring at kinks and steps on the aluminium surface. Additionally, the dependence of pitting potential on the crystallographic orientation is determined by single aluminium crystals, revealing that the pitting potential of low index oriented planes follows the order: {001}> {011}> {111} [138, 139, 204]. However, with the addition of Cu leading to the positive shift of pitting potential, similar pitting potential values of single aluminium with different orientations are displayed, which, consequently, leads to the modification of the pit morphology. At the matrix dissolution site, the preferential dissolution of aluminium along the kinks and steps results in the build-up of copper atoms, which retards the further dissolution of aluminium in the areas. As a result, a higher over-potential, which represents larger thermodynamic driving force, is expected to initiate the anodic dissolution of aluminium on the terrace, which is considered as a less favourable site with respect to the preferential sites, such as kinks and steps. When the copper content is high enough, the over-potential difference could be much larger than the difference of pitting potentials for individual planes along various orientations, which leads to the similar thermodynamic stability of different facets. As mentioned in the related literature [141], when the content of copper increases to 4 wt.% in the Al-Cu binary alloy, the pitting potential of the polycrystalline is indistinguishable from that of {001} single crystal, indicating the similar pitting corrosion behaviour for aluminium single crystals along various orientations with copper build-up on the surface [141]. Therefore, with the copper-enriched layer between the alloy matrix and the corrosion product layer, the 297
298 Chapter 6: Corrosion Behaviour of 2A97 Aluminium Alloy planes following {001}, {011} and {111} orientations have similar thermodynamic stability. As a result, in 2A97 Al-Cu-Li alloys, the crystallographic pit walls follow various orientations, including {001}, {011} and {111} planes. Meanwhile, the random dissolution on the terrace interrupts the development of welldefined crystallographic facets, and thereby leads to the relatively randomly oriented scalloped pit walls. As a result, the crystallographic pits bounded by scalloped corrosion fronts and step-like corrosion walls result from the combined effect of crystallographic dissolution as well as the local chemical condition. The corrosion morphology of 2A97-T8 alloy is more similar with that of pure aluminium than 2A97 alloys in other tempers, displaying step-like pit walls following {001} planes around the crystallographic pits. And 2A97-T6 aluminium alloy displays polyhedron- shaped crystallographic pits surrounded by pit walls generally aligned with crystal planes along low index orientations. In contrast, the limited crystallographic feature was displayed during the stable localized corrosion in the 2A97-T4 Al-Cu-Li alloy. As shown in Figure 6.32, due to the high population density of T 1 phase precipitates, the copper content in the matrix of 2A97-T6 and T8 alloys is much lower than that in T4 alloy. With extra cold working to obtain T8 temper, the copper content as solid solution in the matrix of 2A97-T8 alloy is relatively lower than that in 2A97-T6 alloy due to the preferential precipitation of copper-containing phase (i.e. T 1 and θ phases) in T8 alloy. Therefore, during the selective attack of the alloy matrix, with equivalent amount of aluminium atoms dissolved, the lowest level of copper build-up is developed along the pit walls in T8 alloy followed by the second lowest level of copper build-up along the pit walls in T6 alloy, in contrast to the relatively high level of copper enrichment along the pit wall in the alloy under T4 temper. As mentioned above, the copper build-up significantly affects the development of crystallographic pits during the corrosion propagation. Therefore, alloys in T6 and T8 conditions exhibit more typical crystallographic features at the stable localized corrosion site, while the corrosion pits from the selective dissolution of grain interior in 2A97-T4 alloy shows limited crystallographic features Corrosion propagation 298
299 Chapter 6: Corrosion Behaviour of 2A97 Aluminium Alloy Stable localized corrosion is associated with continuous corrosion development after the corrosion front propagates away from the initiation site and its influence zone. In the present work, the corrosion front area was extensively studied in order to understand the stable localized corrosion propagation mechanism in the 2A97 Al-Cu-Li alloys Necessary chemical condition In the active corrosion front area, the oxidation of aluminium produces high concentration of aluminium ions. The rapid hydrolysis of aluminium ions results in the acidification of the electrolyte in the corrosion front area. To maintain the balance of charge, chloride ions are also enriched in the electrolyte in the corrosion front area. Therefore, the electrolyte at the active corrosion front is acidified and rich in chloride, which is the necessary chemical condition to maintain active localized corrosion since the chemical condition avoids the re-passivation of the corrosion front [71, 205]. The stable localized corrosion sites in the 2A97 Al-Cu-Li alloys display a relatively large reaction volume beneath the alloy surface with a small area of connection on the alloy surface to the bulk solution, i.e. a 3.5 wt. % NaCl solution. It is believed that the special geometry of the stable localized corrosion site contributes to the maintenance of the necessary electrolyte condition in the corrosion front area. At the stable localized corrosion sites of 2A97-T3 (Figure 6.9) and 2A97-T4 aluminium alloys (Figures ) with the attacked grain boundary as the dominant corrosion feature, the area of connection between the bulk solution and the electrolyte in the corrosion front area is small due to the limited intersection between the attacked grain boundaries and the alloy surface. In both alloys, corrosion develops in all directions, laterally as well as in depth, which provides a sufficiently long corrosion propagation path for the establishment of the concentration gradient between the bulk solution and the electrolyte in the corrosion front area. Similarly, the selective dissolution of grain interior in 2A97-T6 aluminium alloy results in the continuous corrosion propagation path consisted of crystallographic pits with the dimensions ranging from hundreds of nanometres to several microns instead of large open pits with much larger dimensions (Figure 6.19). The crystallographic pits of relatively small dimensions on the alloy surface along with the large reaction volumes beneath the alloy surface contribute to the concentration gradient from the active 299
300 Chapter 6: Corrosion Behaviour of 2A97 Aluminium Alloy corrosion fronts to the alloy surface, resulting in the diffusion restriction between bulk solution and the electrolyte in the corrosion front area. Finally, in 2A97-T8 aluminium alloy, the localized corrosion propagates into subsurface areas of the alloy via continuous corrosion propagation path (Figures ), which contributes to the establishment of a long diffusion path that supports a concentration gradient from the corrosion front to the alloy surface. In addition, the restricted solution exchange between the bulk solution and the electrolyte in the corrosion front area is also generated since the dimensions of attacked grain boundaries and crystallographic pits on the alloy surface are much smaller with respect to that of the reaction volume beneath the alloy surface. In summary, the stable localized corrosion sites in 2A97 alloys display the similar geometrical structures, i.e. a large reaction volume beneath the alloy surface and a small area of connection on the alloy surface. The geometrical structure contributes to the restricted diffusion on the alloy surface and the development of concentration gradient between the bulk solution and the electrolyte in the corrosion front area, resulting in the stable electrolyte condition in the corrosion front area. Therefore, in the corrosion front area, the necessary chemical condition (low ph and chloride rich) is established due to the rapid hydrolysis of aluminium ions, and maintained due to the geometry of the stable localized corrosion sites, contributing to the continuous development of localized corrosion in the 2A97 Al-Cu-Li alloys Copper-enriched layer As shown in Figure 6.11, Figure 6.17, Figure 6.22 and Figure 6.30, a copper-enriched layer, with the thickness around 2-3 nm, was developed on the interface between the alloy matrix and corrosion product layer along the pit walls / corrosion crevices walls at the stable localized corrosion sites in the 2A97 alloys of various tempers, as a consequence of the less negative Gibbs free energy per equivalent for the formation of copper oxidation comparing with that of alumina[171, 187, 188]. A copper-rich layer with the thickness around 2 nm was also developed on the etched alloy surfaces as shown in Figure 6.12, Figure 6.18, Figure 6.23 and Figure 6.31, which has the similar crystallographic structure and composition with the copper-enriched layer in the corrosion front area (Figures 6.17 and 6.18 for T4 alloy, Figures 6.22 and 300
301 Chapter 6: Corrosion Behaviour of 2A97 Aluminium Alloy 6.23 for T6 alloy). Therefore, it is believed that the electrochemical property of the etched alloy surface with copper build-up is similar with that of the copper-enriched layer in the corrosion front area. In addition, the alloy can be considered as a composition material comprised with the alloy matrix and grain boundaries. Due to the limited surface area where grain boundaries intersect the alloy surface, the similar electrochemical property between the as-received alloy and the alloy matrix is also expected. As mentioned above, the necessary chemical condition (low ph and chloride rich) can be maintained in the corrosion front area. Therefore, a 3.5 wt. % NaCl solution was acidified to ph=3 with HCl to simulate the low ph and chloride-enriched chemical condition in the active corrosion front area, which was applied for the cathodic polarization measurement. Therefore, the cathodic polarization of the etched alloys is conducted in the acidified NaCl solution to reveal the electrochemical property of the copper-enriched layer in the corrosion front area. As expected, the etched alloy exhibits a positive shift around 0.08 V of the corrosion potential with respect to that of as-received 2A97 Al-Cu-Li alloy as a consequence of the copper build-up on the etched alloy surface (Figure 6.12, Figure 6.18, Figure 6.23 and Figure 6.31). The result indicates the cathodic property of the copper-enriched layer in the corrosion front area, which is in good agreement with previous work [189]. Additionally, the higher current density of the etched alloy over a wide range of potential is evident in the cathodic polarization curves (Figure 6.12, Figure 6.18, Figure 6.23 and Figure 6.31). Thus, the increased cathodic current density of the copperenriched layer could provide high cathodic current to support the corrosion propagation at the active corrosion front. It has been claimed that due to the high current density provided by anodic dissolution, the corrosion of aluminium and its alloys is always limited by the cathodic current [80, 84]. Previous work suggested that the continuous anodic dissolution of aluminium in the corrosion front area was supported by the cathodic intermetallic particles on the alloy surface, resulting in the preferential distribution of stable localized corrosion sites around the cathodic intermetallic particles [206]. However, with prolonged immersion time, the stable localized corrosion penetrates deep beneath the alloy surface, which significantly weakens the coupling between the alloy matrix at the corrosion front and 301
302 Chapter 6: Corrosion Behaviour of 2A97 Aluminium Alloy the cathodic intermetallic particles on the alloy surface due to the increased ohm resistance in the circuit. The similar phenomenon was observed in Chapter 5, displaying that the active cathode does not exist on the alloy surface after 40 minutes immersion in a 3.5 wt. % NaCl solution (Figure 5.22). Therefore, after the localized corrosion develops away from the initiation site, the copper-enriched layer instead of cathodic intermetallic particles could act as the effective cathode, providing sufficiently high cathodic current to support the continuous development of localized corrosion. The corrosion development mechanism in the corrosion front area is similar with that in AA2024-T351 aluminium alloy as shown in the schematic diagram Figure In summary, in the corrosion front area with the necessary chemical condition (low ph and chloride enriched), the copper-enriched layer acts as an effective internal cathode, resulting in the selective dissolution of the anodic part, i.e. the alloy matrix at the active corrosion front with no/less copper build-up. Therefore, it is believed that the self-supported corrosion reaction at the active corrosion front area contributes to the continuous development of the localized corrosion, leading to stable localized corrosion in the 2A97 Al-Cu-Li alloys The role of second phase precipitate The propagation of stable localized corrosion follows the corrosion front with the selective dissolution of more anodic part. Besides the alloy matrix, the corrosion front will also encounter the second phase precipitates during the localized corrosion propagation in 2A97 Al-Cu-Li alloys. With the necessary chemical condition provided in the corrosion front area, further corrosion development could occur to the second phase precipitates at the corrosion front. When the active corrosion front encounters precipitates with a more positive electrode potential relative to that of the alloy matrix (such as θ phase precipitates), selective dissolution of the alloy matrix at the adjacent of the precipitate occurs in the corrosion front area. The local electrolyte in the corrosion front area provides the necessary chemical condition. And in the corrosion front area, the θ phase precipitate, the copper-enriched layer and the alloy matrix at the corrosion front consist of a multi-coupling system. As a result, the trenching could be developed in the periphery of the θ phase precipitate, which possibly leads to the detachment of the cathodic precipitate, thereby enabling the further development of stable localized corrosion. 302
303 Chapter 6: Corrosion Behaviour of 2A97 Aluminium Alloy When anodic precipitates, such as T 1 phase precipitates, with a more negative corrosion potential relative to that of the alloy matrix locate at the corrosion front, there exists a competition between the micro-coupling between the copper-enriched layer and the precipitates and the selective dissolution of the anodic precipitates. Specifically to T 1 phase precipitates in the corrosion front area, selective dissolution of Li first occurs in the T 1 phase precipitate, resulting in a copper-rich T 1 phase remnant with a more positive potential comparing with that of alloy matrix [ ]. The subsequent process is similar with that when the corrosion front encounters cathodic precipitates. The cathodic T 1 phase remnant is removed or bypassed as a consequence of preferential dissolution of the alloy matrix in its periphery. After the detachment / bypassing of second phase precipitates, the stable localized corrosion propagation continues following the corrosion front with selective dissolution of the more anodic part The development of banding structure During the immersion testing, the development of corrosion banding structure along certain crystallographic orientation was also noticed (Figure 6.16, Figure 6.21 and Figure 6.29). As mentioned above, the ageing precipitates in Al-Cu-Li alloys have a significant impact on the corrosion propagation mechanism and, hereafter, affect the development orientation of banding structure. The region A and B in the schematic diagram, as shown in Figure 6.33, illustrates the formation mechanism of banding structure associated with two types of ageing precipitates. The active corrosion front could encounter a dense precipitates band, which is comprised of high population density of precipitates along the same orientation, with the typical example shown in Figures 4.38 (c)-(d). Since the extra driving force provided by the micro-coupling between the precipitate and the alloy matrix/ copperenriched layer, the corroded banding structure along the same orientation of the dense precipitates band is developed. When the active corrosion front encounters a dense T 1 phase precipitates band, which follows{111} planes in the alloy matrix, the corrosion banding structure along the same orientation could be generated following the propagation path of corrosion front. Further, the relatively cathodic nature of the θ phase precipitate could promote the dissolution of the alloy matrix at its adjacent, which leads to the high corrosion susceptibility of the region containing dense θ phase 303
304 Chapter 6: Corrosion Behaviour of 2A97 Aluminium Alloy precipitates. Therefore, when corrosion front reaches a dense θ phase precipitate band, corrosion propagates in the form of corrosion banding structure following {001} plane, which is the habit plane for θ phase precipitates. Besides the compositional difference, the non-uniform plastic deformation also contributes to the banding structure development. The related process is illustrated in region C as shown in Figure In the alloy matrix, dense dislocation bands preferentially develop in the direction parallel with {111} oriented plane since the {111} oriented plane is the slip plane in face centred cubic structure. It is believed that the dense dislocation bands facilitate the development of high population density of T 1 phase precipitates in the corresponding regions [44, 45, 47]. Due to the active nature of T 1 phase precipitates, the dense dislocation band has higher corrosion susceptibility relative to the alloy matrix in the periphery and, consequently, results in the development of corrosion banding structure following {111} planes. Similar phenomenon has been reported in related literature [207, 208]. It was found that two sets of corroded bands are oriented around to the rolling direction and 70 to each other, suggesting the propagation directions parallel with {111} oriented planes, which correspond to the orientation of the slip planes in the aluminium alloy. The development of banding structure along certain crystallographic orientation was detected in 2A97-T4, T6 and T8 aluminium alloys, which is attributed to the distribution of the second phase precipitates, especially the presence of a dense precipitates band in the 2A97 aluminium alloys. In 2A97-T4 aluminium alloy, banding structures in the directions parallel with {111} and {001} planes were observed next to the attacked grain boundary (Figure 6.16), corresponding to T 1 and θ phase precipitates bands following {111} and {001} planes. Following the corrosion propagation along the grain boundary network, further corrosion could develop into the grain interior by the selective attack of dense precipitate bands. As a result, the banding structure along certain orientation developed at the adjacent of grain boundary into the grain interior. The corrosion banding structure linking the attacked grain boundary and the grain interior is likely to be an alternative method for the initiation of the grain interior attack since it provides the diffusion path for aggressive electrolyte into selective grain interior, leading to further matrix dissolution in the 2A97-T4 alloy. 304
305 Chapter 6: Corrosion Behaviour of 2A97 Aluminium Alloy As mention in related literature [46], with no plastic deformation prior to the natural ageing, the nucleation of θ phase precipitates on {001} planes is dominant, resulting in the preferential development of dense θ phase precipitates bands in T4 alloy. Thus, more dense bands following {001} planes developed with respect to those following {111} planes, which corresponds to dense bands consisting of T 1 phase precipitates. Therefore, the corrosion banding structure following {001} plane is more widely existed in the periphery of attacked grain boundaries than that parallel with {111} plane in the 2A97-T4 alloy. In the 2A97-T6 alloy, high population density of T 1 phase precipitates is evident in the alloy matrix. Stable localized corrosion sites, which are decorated with banding structures following {111} planes, are also shown in Figure 6.21 after 5 hours immersion in a 3.5 wt. % NaCl solution. Little evidence indicates the existence of {001} oriented corrosion banding structure in the 2A96-T6 alloy as a consequence of low population density of θ phase precipitates. Similarly, the active corrosion front could encounter the dense precipitate band consisted of θ phase precipitates in 2A97-T8 aluminium alloy, which provides necessary chemical condition for the further corrosion development. In the corrosion front area, the selective dissolution of the alloy matrix in the periphery of θ phase precipitates contributes to the development of the corrosion banding structure following {001} plane. However, no banding structure in the direction parallel with {111} plane was detected in 2A97-T8 alloy. The possible explanation for the phenomenon is the presence of a high population density of T 1 phase precipitates in the alloy matrix, resulting in continuous precipitates area instead of continuous precipitates path, which, consequently, retards the development of banding structure. Even though the banding structure initiated, the high corrosion susceptibility of grain interior transformed the banding structure rapidly into typical areas of crystallographic pits, resulting in the low population density of banding structures in 2A97-T8 Al-Cu-Li alloy The influence of grain-stored energy on localized corrosion The cold working process and/or sheet formation process, namely coil process, introduce plastic deformation to the 2A97 Al-Cu-Li alloys, resulting in the heterogeneous distribution of dislocations in the alloys. In the present study, the grainstored energy, representing the population density of crystallographic defects, was 305
306 Chapter 6: Corrosion Behaviour of 2A97 Aluminium Alloy investigated to correlate the local grain structure with selective corrosion behaviour in 2A97 Al-Cu-Li alloys The nature and origin of grain-stored energy As mentioned in section 5.2.4, the density of misorientations within a grain reflects the density of dislocations in that grain. It is known that the energy associated with misorientation above a selected threshold value (1 ) can be calculated using the Read- Shockley equation: γ = γ 0 θ (A-In θ), where θ is the misorientation angle, γ 0 and A are constants. The stored energy of an individual grain is determined by averaging the sum of the mean energies of pixels over the grain area, which reflects the average population density of dislocations in the individual grain. The spatial distribution of the grain-stored energy is represented as a grey-scale map. The grain with high population density of crystallographic defects has bright appearance, indicating its high level of stored energy in contrast to the grain with low density of crystallographic defects, which has a dark appearance in the grain-stored energy map. Similarly, the subgrain-stored energy map generates a more local distribution of stored energy, with different brightness representing the average population density of crystallographic defects within individual subgrains (the subgrain in the present study is defined as the area surrounded by LAGBs). It is believed that the thermomechanical history is the main contributor to the heterogeneous distribution of crystallographic defects (i.e. dislocations and subgrain boundaries), which determines the grain-stored energy distribution in the alloys. The plastic deformation during the fabrication process introduces crystallographic defects in the alloys, contributing to the stored energy of individual grains [102, 103, 135]. It is also worth mentioning that subgrain boundary, which is from the re-arrangement of dislocations during the recrystallization process, also contributes to the stored energy of the individual grain (defined as an area bounded by HAGB). To 2A97-T3 and 2A97-T8 alloys, cold working prior to ageing process is applied to as-cast alloy, introducing different levels of plastic deformation to grains with various orientations. Alloys in T4 and T6 tempers generally just involve solution heat treatment and ageing following to a 306
307 Chapter 6: Corrosion Behaviour of 2A97 Aluminium Alloy substantially stable condition. However, the material is supplied as a thin sheet due to the coil process, which introduces extra plastic deformation to 2A97-T4 and 2A97-T6 alloys. The number of active slip systems in a grain is determined by the orientation relationship between its crystallographic orientation and the fabrication direction. Therefore, the introduction of plastic deformation in the alloy is grain-orientation dependent during the fabrication process as a consequence of the different numbers of available slip systems within grains of different crystallographic orientations [174]. As a result, higher population density of dislocations could be introduced to the grains with more active slip systems, leading to the difference of dislocation densities of individual grains, and, consequently, resulting in the heterogeneous distribution of grain-stored energy Heterogeneous corrosion susceptibility In the 2A97-T3 alloy, selective attack of grain boundary/ subgrain boundary is evident after the immersion testing in a 3.5 wt. % NaCl solution (Figures ). The localized distribution of attacked grain boundaries/ subgrain boundaries on the alloy surface reveals selected grain boundary is more susceptible to localized corrosion. The cross section of stable localized corrosion site in 2A97-T3 aluminium alloy is shown in Figure 6.9. The attacked grain boundaries at various depths on the cross section also reveal the heterogeneous intrinsic corrosion susceptibility of grain boundaries. It is also noticed that the near surface area suffers less plastics deformation, displaying the pancake-shaped grains, in contrast to the elongated grains in the area further away from the alloy surface, indicating high level of plastic deformation. The selective attack of grain boundary is evident at the stable localized corrosion site. Several grain boundaries near the alloy surface exposed to aggressive environment for longer time remain intact whereas most grain boundaries further away from the surface area with limited immersion time are preferentially attacked. The selective attack of grain boundary around the grain with high level of plastic deformation suggests the influence of plastic deformation on corrosion susceptibility of individual grain boundaries. As mentioned above, the higher plastic deformation in the region indicates the increased stored energy. Therefore, the selective attack is closely associated with the distribution of grain-stored energy. 307
308 Chapter 6: Corrosion Behaviour of 2A97 Aluminium Alloy EBSD analysis indicates that the attacked subgrain boundaries are preferentially distributed in the grain with higher brightness in the grain-stored energy map, indicating the higher corrosion susceptibility of the grain with higher level of grain-stored energy. What s more, grain boundaries around the grain with higher stored energy are preferentially attacked instead of those around the grains with low stored energy, correlating the high intergranular corrosion susceptibility to the high stored energy. Additionally, it is also evident that stored energy varies in different subgrains, indicating the different corrosion susceptibility of various subgrains. TEM observation of corrosion crevice induced by selective attack of grain boundary indicates the corrosion was not confined to the immediately adjacent area along the grain boundary but unevenly developed into neighbouring grains, indicating the different corrosion susceptibility of individual grains in the 2A97-T3 alloy (Figure 6.11). On the surface of 2A97-T4 aluminium alloy, the distribution of attacked grain boundaries is localized, revealing the different corrosion susceptibility of grain boundaries (Figures ). Similarly, various corrosion depths of attacked grain boundaries on the cross section of the stable localized corrosion site after the immersion testing further confirm the heterogeneous corrosion susceptibility of grain boundaries in 2A97-T4 alloy. With prolonged immersion time, grain interior attack is evident with the presence of crystallographic pits in selective grains, suggesting the corrosion susceptibility difference of individual grains. The absence of grain interior attack after 5 hours immersion indicates the relatively higher corrosion susceptibility of the grain boundary network than that of the grain interior in 2A97-T4 alloy (Figure 6.14). Comparing the SEM micrograph of the stable localized corrosion site and the corresponding grain-stored energy distribution, it is clearly revealed that the grain boundaries tend to locate around the grain with high level of stored energy (Figure 6.15), correlating the intergranular corrosion susceptibility with the stored energy of the corresponding grain. Further, in the TEM micrographs of the corrosion crevice introduced by intergranular corrosion in 2A97-T4 alloy, it is evident that corrosion along the grain boundary is uneven with the interior of the grain with high corrosion susceptibility being preferentially attacked (Figure 6.17). 308
309 Chapter 6: Corrosion Behaviour of 2A97 Aluminium Alloy Heterogeneous corrosion susceptibility is evident in 2A97-T6 alloy since grain interior attack occurs in selected grains after the immersion testing (Figure 6.20 (a)). As shown in Figure 6.20 (d), it is evident that grain with higher brightness is preferentially attacked, leaving other grains with darker appearance intact, indicating the higher corrosion susceptibility of grains with higher stored energy. Therefore, higher corrosion susceptibility of individual grains is associated with high level of stored energy in 2A97-T6 aluminium alloy Selective attack of grain boundary and grain interior is evident on the alloy surface and the cross section at the stable localized corrosion site in the 2A97-T8 alloy after the immersion testing. As shown in Figures , the localized distribution of attacked grain boundaries/ grain interiors on the alloy surface and attacked grain boundaries/grain interiors at various corrosion depths reveal the heterogeneous corrosion susceptibility of individual grain interior/ grain boundary in the 2A97-T8 alloy. At the stable localized corrosion site in 2A97-T8 alloy, selective attack of grain interior is always bounded by the attacked grain boundaries while the selective attack of grain boundaries is not necessarily associated with the corresponding attack of grain interior (Figures 6.25 (a) and (c)), suggesting the relatively higher corrosion susceptibility of grain boundary than that of grain interior. TEM observation further confirms the heterogeneous corrosion susceptibility in 2A97- T8 alloy. As shown in Figure 6.30, the non-uniform development into the grain interior of neighbouring grains is evident along the attacked grain boundary. The selective attack of grain interior is also noticed, suggesting the corrosion susceptibility difference of individual grains in 2A97-T8 aluminium alloy. Stable localized corrosion preferentially locates in grains with high stored energy as shown Figure 6.28, correlating the high stored energy to the high corrosion susceptibility of individual grains in 2A97-T8 alloy. Store energy also varies in subgrains, suggesting heterogeneous corrosion susceptibility of subgrains. Therefore, the heterogeneous distribution of stored energy contributes to the selective corrosion behaviour in 2A97-T8 alloy. 309
310 Chapter 6: Corrosion Behaviour of 2A97 Aluminium Alloy The explanation for the influence of grain-stored energy Three factors might contribute to higher corrosion susceptibility of the grain interior/ grain boundary in the area with high level of stored energy. First, higher population density of crystallographic defects could result in the higher level of thermodynamic instability of individual grain and the surrounding grain boundaries. The thermodynamic instability leads to higher corrosion susceptibility, resulting in the preferential attack around the grain with high level of grain-stored energy during the immersion testing. Second, the crystallographic defects, including dislocations and subgrain boundaries, provide the preferential nucleation sites for T 1 phase precipitation, especially along the grain boundary due to its less order in atomic arrangement along the grain boundary than the average level of the grain interior. The distribution of T 1 phase precipitates significantly affects the corrosion susceptibility of individual grains due to the more negative corrosion potential of T 1 phase precipitates with respect to that of alloy matrix. Therefore, during the immersion testing, the stable localized corrosion preferentially occurred in the grains with high level of stored energy, which are supposed to be decorated with high population density of T 1 phase precipitates. Third, the dislocation and subgrain boundary are also considered as an important method of diffusion within the grain, which may lead to the segregation at certain grain boundary or grain area, resulting in higher corrosion susceptibility. The influence of segregation on corrosion susceptibility has been reported in 6000 series aluminium alloys [116, 117]. The further work is necessary to better understand the exact reason for the influence of grain-stored energy on the localized corrosion susceptibility in Al-Cu-Li alloys. 310
311 Chapter 6: Corrosion Behaviour of 2A97 Aluminium Alloy 6.4 Conclusions The corrosion behaviour of intermetallic particles in the 2A97 Al-Cu-Li alloys of different tempers is similar. The micro-coupling between the intermetallic particle and the alloy matrix leads to the preferential dissolution of the alloy matrix in its periphery, resulting in the development of trenching around the intermetallic particle. Additionally, the selective dissolution also occurred in selected intermetallic particles during the immersion testing, leading to the development of copper rich porous banding structure along certain orientation. The thermomechanical process of the Al-Cu-Li alloy significantly affects the distribution and the amount of T 1 phase precipitates, which, consequently, affects the localized corrosion behaviour of the alloy. In the 2A97-T3 Al-Cu-Li alloy, due to the relatively high population density of T 1 phase precipitates along selective grain boundaries, the alloy is susceptible to intergranular corrosion, resulting in the development of attacked grain boundaries during the immersion testing. At the corrosion front, the necessary chemical condition (low ph and chloride rich) can be provided due to the restricted electrolyte exchange between the bulk solution and the electrolyte in the corrosion front area. Further, the copper-enriched layer along the walls of the crevice behind corrosion front can act as an internal cathode, providing high cathodic current to support the anodic dissolution at the corrosion front. Therefore, the self-supported dissolution at the active corrosion front results in the continuous development of localized corrosion. It was also revealed that the intergranular corrosion propagation path is closely associated with the distribution of grain-stored energy, with intergranular attack preferentially occurring around the grain with high level of stored energy. In the 2A97-T4 Al-Cu-Li alloy, localized corrosion first occurs along the grain boundary network and then develops into selected grain interior with prolonged immersion time, which is consistent with the T 1 phase precipitates distribution in the alloy. Similar with that in T3 alloy, the self-supported reaction at the corrosion front contributes to the localized corrosion development in T4 alloy. The propagation path of the intergranular corrosion is significantly affected by the distribution of grain-stored energy, with attacked grain boundaries preferentially locating around the grain with high level of stored energy. With prolonged immersion time, both the grain boundary 311
312 Chapter 6: Corrosion Behaviour of 2A97 Aluminium Alloy and the grain interior were selectively attacked. The selective attack of grain interior in the 2A97-T4 alloy exhibits relatively limited crystallographic features relative to that in the 2A97-T6 and T8 alloys. In addition, corrosion banding structure following {001} and {111} planes also developed during the immersion testing, corresponding to the dense precipitates bands in the alloy matrix (Figure 4.38). In the 2A97-T6 Al-Cu-Li alloy, due to the high population density of T 1 phase precipitates in the alloy matrix, crystallographic pits in the grain interior were evident after the immersion testing with no attacked grain boundaries observed. As mentioned above, with the necessary chemical condition provided, the copper-enriched layer along the crystallographic pit walls provides high cathodic current to support the anodic dissolution at the corrosion front, resulting in the continuous corrosion development. The selective attack of grain interior results in the development of polyhedron-shaped crystallographic pits, which are bounded by step-like pit walls. It was also revealed that crystallographic dissolution of the grain interior preferentially occurs in the grain with high level of stored energy, correlating localized corrosion susceptibility with grainstored energy. Additionally, corrosion banding structure following {111} plane was also observed, which may be attributed to the preferential dissolution of the dense T 1 phase precipitates band in the alloy matrix (Figure 4.39). In the 2A97-T8 Al-Cu-Li alloy, after the immersion testing, the selective attack of grain boundary and grain interior is evident, corresponding to the high population density of T 1 phase precipitates along the grain boundary network and in the alloy matrix. Most pit walls surrounding crystallographic pits in the grain interior follow {001} planes, exhibiting evident crystallographic features. The continuous localized corrosion development in the 2A97-T8 alloy is attributed to the self-support anodic dissolution at the corrosion front. In the corrosion front area, necessary chemical condition could be generated (hydrolysis of aluminium ions) and maintained (restricted diffusion due to the geometrical structure of localized corrosion sites). Meanwhile, a copper-enriched layer could act as an effective cathode, providing high cathodic current to support the anodic dissolution at the corrosion front. Further, it was revealed that higher grain-stored energy is associated with higher corrosion susceptibility, leading to the selective attack behaviour in the 2A97-T8 Al-Cu-Li alloy. In addition, corrosion banding structures following {001} plane were also observed, which is likely to be related to the dense θ phase precipitates bands. 312
 (b)")


 2A97-T4, (c)")
313 Chapter 6: Corrosion Behaviour of 2A97 Aluminium Alloy (a) (b) (c) (d) Figure 6.1: Scanning electron micrographs of alloy surfaces after the immersion in a 3.5 wt. % NaCl solution for 5 hours (a) 2A97-T3, (b) 2A97-T4, (c) 2A97-T6, (d) 2A97-T8 Al-Cu-Li alloys. 313


 Backscattered")
")
314 Chapter 6: Corrosion Behaviour of 2A97 Aluminium Alloy (a) (b) Figure 6.2: Typical intermetallic particle after 5 hours immersion in a 3.5 wt. % NaCl solution (a) Backscattered electron micrograph, (b) EDX maps, in the sequence of Al, Cu, Fe, Mn, Mg, Zn and O. 314
 Figure 6.")
 BSE micrograph of")
 at increased magnification, (c)-(d) BSE and SE")
 EDX maps of the intermetallic")
315 Chapter 6: Corrosion Behaviour of 2A97 Aluminium Alloy (a) (b) (c) (d) Figure 6.3: Typical intermetallic particles with banding structure along certain orientation after 5 hours immersion (a) BSE micrograph of the intermetallic particle on the alloy surface, (b) The framed area in (a) at increased magnification, (c)-(d) BSE and SE micrographs of the intermetallic particle on the cross section beneath the alloy surface, (e) EDX maps of the intermetallic particle shown in (a), in the sequence of Al, Cu, Fe, Mg, O, Mn and Zn. 315


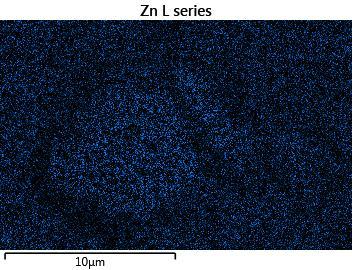
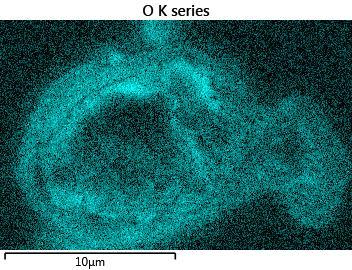
316 Chapter 6: Corrosion Behaviour of 2A97 Aluminium Alloy (e) Figure 6.3: Continued. 316
 (b)")


 2A97-T6 and (d)")
317 Chapter 6: Corrosion Behaviour of 2A97 Aluminium Alloy (a) (b) (c) (d) Figure 6.4: Scanning electron micrographs of alloy surfaces after 20 hours immersion in a 3.5 wt. % NaCl solution (a) 2A97-T3, (b) 2A97-T4, (c) 2A97-T6 and (d) 2A97-T8 Al- Cu-Li alloys. 317

 (c) Figure 6.")


")
")


, in the sequence")
318 Chapter 6: Corrosion Behaviour of 2A97 Aluminium Alloy (a) (b) (c) Figure 6.5: Scanning electron micrographs of the alloy surface after 20 hours immersion in a 3.5 wt. % NaCl solution (a) Secondary electron micrograph, (b) Backscattered electron micrograph, (c) EDX maps of the intermetallic particle shown in (b), in the sequence of Al, Cu, Fe, Mn, Mg, Zn and O. 318

 Figure 6.")


 at increased")


319 Chapter 6: Corrosion Behaviour of 2A97 Aluminium Alloy (a) (b) (c) Figure 6.6: Typical intermetallic particle after 20 hours immersion in a 3.5 wt. % NaCl solution (a) SEM micrograph of a typical intermetallic particle, (b) Framed area in (a) at increased magnification, (c) EDX maps of the intermetallic particle shown in (a), in the sequence of Al, Cu, Zn, Mn, Fe and O. 319

 (c) Figure 6.")


 EDX maps of the")
, in the sequence")
320 Chapter 6: Corrosion Behaviour of 2A97 Aluminium Alloy (a) (b) (c) Figure 6.7: Typical intermetallic particles after 20 hours immersion in a 3.5 wt. % NaCl solution, with copper re-distribution (a)-(b) BSE micrographs of typical intermetallic particles, (c) EDX maps of the intermetallic particle shown in (a), in the sequence of Al, Cu, Fe, Mn, Mg, Zn and O. 320
321 Chapter 6: Corrosion Behaviour of 2A97 Aluminium Alloy Figure 6.8: Potentiodynamic polarization curves of 2A97 aluminium alloys in various tempers. 321

 Figure 6.")


322 Chapter 6: Corrosion Behaviour of 2A97 Aluminium Alloy (a) (b) (c) (d) (e) (f) Figure 6.9: Scanning electron micrographs of typical stable localized corrosion sites in 2A97-T3 Al-Cu-Li alloy (a)-(b) Plan-view at different magnifications, (c) Typical cross section after 5 hours immersion, (d)-(f) Typical cross section after 20 hours immersion. 322
 (b) B A (c) (d) (e) (a) (b) B A D C (f) (g)")


, revealing the distribution of")
323 Chapter 6: Corrosion Behaviour of 2A97 Aluminium Alloy (a) (b) B A (c) (d) (e) (a) (b) B A D C (f) (g) (h) D C Figure 6.10: EBSD analysis of typical stable localized corrosion sites in 2A97-T3 Al- Cu-Li alloy (a)-(b) Scanning electron micrographs of localized corrosion sites, (c)-(e) EBSD reconstruction maps of the area containing the localized corrosion sites shown in (a)-(b), revealing the distribution of grain orientation in Euler s colour, grain-stored energy and subgrain-stored energy in grey scale, (f) Scanning electron micrograph of another localized corrosion site, (g)-(h) EBSD reconstruction maps of the area shown in (f), revealing the distribution of grain orientation in Euler's colour and grain-stored energy in grey scale. 323


 Point 1 C")

324 Chapter 6: Corrosion Behaviour of 2A97 Aluminium Alloy (a) (b) A B (c) Point 1 C (d) Point 2 D Figure 6.11: To be continued. 324
-(c)")
, (f) High resolution TEM micrograph with the FFT result of")
325 Chapter 6: Corrosion Behaviour of 2A97 Aluminium Alloy (e) (f) Figure 6.11: TEM analysis of typical stable localized corrosion sites in 2A97-T3 Al-Cu- Li alloy (a)-(c) Bright field TEM micrographs at different magnifications, (d) HAADF micrograph, (e) EDX point spectra from points 1 and 2 in (d), (f) High resolution TEM micrograph with the FFT result of the framed area inset. 325
 Cathodic polarization curves of as-received and etched 2A97-T3 aluminium alloys, (b) Bright field TEM micrograph of a typical cross section of")
326 Chapter 6: Corrosion Behaviour of 2A97 Aluminium Alloy (a) (b) (c) Figure 6.12: (a) Cathodic polarization curves of as-received and etched 2A97-T3 aluminium alloys, (b) Bright field TEM micrograph of a typical cross section of etched 2A97-T3 aluminium alloy, (c) EDX line-scan result along the red line in (b). 326
 (b) A A (c) (d) (e) (f) Figure 6.")

 Plan-view,")
-(f) Another")

327 Chapter 6: Corrosion Behaviour of 2A97 Aluminium Alloy (a) (b) A A (c) (d) (e) (f) Figure 6.13: Scanning electron micrographs of typical stable localized corrosion sites in 2A97-T4 Al-Cu-Li alloy after the immersion in a 3.5 wt. % NaCl solution for 5 hours (a) Plan-view, (b)-(c) Cross section along A-A in (a) at different magnifications, (d)-(f) Another typical cross section at the stable localized corrosion site developed in 2A97- T4 Al-Cu-Li alloy at different magnifications. 327
 (b) B A B")


 at")
 at")
328 Chapter 6: Corrosion Behaviour of 2A97 Aluminium Alloy (a) (b) B A B A (c) (d) (e) (f) Figure 6.14: Scanning electron micrographs of a typical stable localized corrosion site in 2A97-T4 Al-Cu-Li alloy after the immersion in a 3.5 wt. % NaCl solution for 20 hours (a) Plan-view, (b)-(c) Cross section along A-A in (a) at different magnifications, (d)-(f) Cross section along B-B in (a) at different magnifications. 328
 (c) (d) (e) (f) Figure 6.")
 Scanning electron")
-(d) Grain orientation distribution in")
, (e)-(f) Kikuchi pattern")
329 Chapter 6: Corrosion Behaviour of 2A97 Aluminium Alloy (a) (b) (c) (d) (e) (f) Figure 6.15: EBSD analysis of a typical stable localized corrosion site in 2A97-T4 Al- Cu-Li alloy (a) Scanning electron micrograph, (b) Framed area in (a) at increased magnification, (c)-(d) Grain orientation distribution in Euler s colours and grain-stored energy distribution in grey-scale of the area shown in (a), (e)-(f) Kikuchi pattern and the corresponding indexed result from the area shown in (b). 329
 (b) (c) (d) (e) (f) Figure 6.")


330 Chapter 6: Corrosion Behaviour of 2A97 Aluminium Alloy (a) (b) (c) (d) (e) (f) Figure 6.16: SEM micrographs of typical stable localized corrosion sites along with the corresponding Kikuchi patterns and indexed results (a)-(c) One site with banding structure in the direction parallel with {001} oriented planes, (d)-(f) Another site with banding structure in the direction parallel with {111} oriented planes. 330
 (b) (c)")

-(b)")
 EDX line-scan")
 High resolution TEM micrograph")
331 Chapter 6: Corrosion Behaviour of 2A97 Aluminium Alloy (a) (b) (c) (d) (e) Figure 6.17: TEM analysis of stable localized corrosion sites in 2A97-T4 Al-Cu-Li alloy (a)-(b) Bright field TEM micrographs, (c) HAADF micrograph, (d) EDX line-scan result along the red line in (c), (e) High resolution TEM micrograph with the FFT result of the framed area inset. 331
 Bright field TEM micrograph of the cross section of etched 2A97-T4 alloy, (b) HAADF")
 Cathodic polarization curves of as-received and")
332 Chapter 6: Corrosion Behaviour of 2A97 Aluminium Alloy (a) (b) (c) (d) Figure 6.18: (a) Bright field TEM micrograph of the cross section of etched 2A97-T4 alloy, (b) HAADF micrograph of the cross section of etched 2A97-T4 alloy, (c) High resolution TEM micrograph along with FFT result of the framed area inset, (d) Cathodic polarization curves of as-received and etched 2A97-T4 aluminium alloys. 332
 (b) A A (c)")

")
 at different")

333 Chapter 6: Corrosion Behaviour of 2A97 Aluminium Alloy (a) (b) A A (c) Crystallographic planes (d) (e) Figure 6.19: Scanning electron micrographs of typical stable localized corrosion sites in 2A97-T6 Al-Cu-Li alloy (a) Plan-view, (b)-(c) Cross section along A-A in (a) at different magnifications, (d)-(e) Typical cross section with banding structure at different magnifications. 333
 (b) (c) (d) (e) (f)")

-(b) Scanning electron")


, (f)-(g) Kikuchi")
334 Chapter 6: Corrosion Behaviour of 2A97 Aluminium Alloy (a) (b) (c) (d) (e) (f) (g) Figure 6.20: EBSD analysis of a typical stable localized corrosion site in 2A97-T6 Al- Cu-Li alloy (a)-(b) Scanning electron micrographs of a typical stable localized corrosion site at different magnifications, (c) Grain orientation distribution in Euler's colour of the area shown in (a), (d) Grain-stored energy distribution in grey scale of the area shown in (a), (e) Dislocation distribution of the area shown in (a), (f)-(g) Kikuchi pattern along with the corresponding indexed result of the area shown in (b). 334
 (b) (c) (d) Figure 6.")

 Framed area in (a) at")

335 Chapter 6: Corrosion Behaviour of 2A97 Aluminium Alloy (a) (b) (c) (d) Figure 6.21: SEM micrographs and the corresponding Kikuchi pattern of a typical localized corrosion with the banding structure (a) General view (b) Framed area in (a) at increased magnification, (c)-(d) Kikuchi pattern with the indexed result obtained from the marked point shown in (a). 335


")

 Figure 6.")
336 Chapter 6: Corrosion Behaviour of 2A97 Aluminium Alloy (a) (b) (c) (d) Point 2 Point 1 (e) (f) Figure 6.22: To be continued. 336

, (f) Bright field TEM micrograph of the area for")

337 Chapter 6: Corrosion Behaviour of 2A97 Aluminium Alloy (g) (h) (i) Figure 6.22: TEM analysis of stable localized corrosion sites in 2A97-T6 Al-Cu-Li alloy (a)-(b) Bright field TEM micrographs, (c)-(d) HAADF micrographs, (e) EDX spectra of points 1 and 2 shown in (d), (f) Bright field TEM micrograph of the area for EELS analysis, (g)-(h) EELS mapping results of copper and lithium, (i) High resolution TEM micrograph with the corresponding FFT result of the framed area inset. 337
 (c) (d) (e) (f) Figure 6.")
 HAADF")
 High")
 Cathodic polarization curves of")
338 Chapter 6: Corrosion Behaviour of 2A97 Aluminium Alloy (a) (b) (c) (d) (e) (f) Figure 6.23: (a) Bright field TEM micrograph of the cross section of the etched 2A97- T6 aluminium alloy, (b) HAADF micrograph, (c)-(d) Bright field TEM micrograph of the selected area and the corresponding EELS Li map, (e) High resolution TEM micrograph with the FFT result of the framed area inset, (f) Cathodic polarization curves of as-received and etched 2A97-T6 aluminium alloys. 338
 (b) (c) (d)")


 Plan-view, (b)")
-(f) Cross section along B-B in")
339 Chapter 6: Corrosion Behaviour of 2A97 Aluminium Alloy (a) (b) (c) (d) (e) (f) Figure 6.24: Scanning electron micrographs of a typical stable localized corrosion site in 2A97-T8 Al-Cu-Li alloy after 5 hours immersion in a 3.5 wt. % NaCl solution (a) Plan-view, (b) Cross section along A-A in (a), (c)-(f) Cross section along B-B in (a) at different magnifications. 339
 Rolling direction (b)")
 Rolling direction (f)")


")
-(f) Cross sections of")
340 Chapter 6: Corrosion Behaviour of 2A97 Aluminium Alloy (a) Rolling direction (b) Rolling direction (c) Rolling direction (d) Rolling direction (e) Rolling direction (f) Rolling direction A B Figure 6.25: Scanning electron micrographs of typical stable localized corrosion sites in 2A97-T8 Al-Cu-Li alloy after 20 hours immersion in a 3.5 wt. % NaCl solution (a)-(c) Plan-view of typical stable localized corrosion sites, (d) Typical crystallographic pits at increased magnification, (e)-(f) Cross sections of typical stable localized corrosion sites. 340
 (b) (c) (d) Figure 6.")

")
-(d) Stored energy distribution of the")
341 Chapter 6: Corrosion Behaviour of 2A97 Aluminium Alloy (a) (b) (c) (d) Figure 6.26: EBSD analysis of the 2A97-T8 Al-Cu-Li alloy applied for grain-stored energy study (a) Crystallographic orientation distribution map in Euler s colour, (b) IPFZ map of the corresponding area, (c)-(d) Stored energy distribution of the corresponding area. 341

 (f) Figure 6.")


342 Rolling direction Rolling direction Rolling direction Rolling direction Rolling direction Rolling direction Chapter 6: Corrosion Behaviour of 2A97 Aluminium Alloy (a) (b) (c) (d) (e) (f) Figure 6.27: Scanning electron micrographs of typical stable localized corrosion sites developed in the 2A97-T8 Al-Cu-Li alloy applied for grain-stored energy study after 20 hours immersion in a 3.5 wt. % NaCl solution at various magnifications. 342
 Rolling direction (c) Rolling direction")

 General view, (b) The")

343 Chapter 6: Corrosion Behaviour of 2A97 Aluminium Alloy (a) Rolling direction (b) Rolling direction (c) Rolling direction (d) Rolling direction Figure 6.28: Scanning electron micrographs and EBSD analysis of a typical stable localized corrosion in the 2A97-T8 Al-Cu-Li alloy for grain-stored energy study (a) General view, (b) The stable localized corrosion site at increased magnification, (c) Crystallographic orientation distribution in Euler s colour, (d) Grain-stored energy distribution in grey scale. 343
 Rolling direction (b) (c) (d) Rolling")


-(c) Kikuchi")
, (d)-(e) Typical crystallographic")
344 Chapter 6: Corrosion Behaviour of 2A97 Aluminium Alloy (a) Rolling direction (b) (c) (d) Rolling direction (e) Rolling direction Figure 6.29: Scanning electron micrographs and the corresponding Kikuchi pattern on the surface of 2A97-T8 alloy after the immersion in a 3.5 wt. % NaCl solution for 20 hours (a) A typical localized corrosion site on the surface, (b)-(c) Kikuchi pattern and the corresponding indexed result of the area shown in (a), (d)-(e) Typical crystallographic pits in (a) at increased magnifications. 344

 (b) Point")
")

345 Chapter 6: Corrosion Behaviour of 2A97 Aluminium Alloy (a) (b) Point 2 Point 1 (c) (d) Grain C Grain D (e) (f) Point 3 Point 4 Figure 6.30: To be continued. 345

-(b) Bright field TEM micrographs of crystallographic pits at")

 EELS Li map of the area shown in (g), (i)")
346 Chapter 6: Corrosion Behaviour of 2A97 Aluminium Alloy (g) (h) (i) Figure 6.30: TEM analysis of typical stable localized corrosion sites developed in 2A97-T8 Al-Cu-Li alloy after the immersion in a 3.5 wt. % NaCl solution (a)-(b) Bright field TEM micrographs of crystallographic pits at different magnifications, (c) EDX spectra of points 1 and 2 as shown in (b), (d)-(e) Bright field TEM micrograph and HAADF micrograph of a typical localized corrosion site, (f) EDX spectra of points 3 and 4 as shown in (e), (g) Bright field TEM micrograph of the corrosion front area, (h) EELS Li map of the area shown in (g), (i) High resolution TEM micrograph with FFT result of the framed area inset. 346
 Bright field TEM micrograph of an ultramicrotomed cross section of etched 2A97-T8 aluminium alloy, (b) Cathodic polarization")
347 Chapter 6: Corrosion Behaviour of 2A97 Aluminium Alloy (a) (b) Figure 6.31: (a) Bright field TEM micrograph of an ultramicrotomed cross section of etched 2A97-T8 aluminium alloy, (b) Cathodic polarization curves of as-received and etched 2A97-T8 aluminium alloys. 347

348 Chapter 6: Corrosion Behaviour of 2A97 Aluminium Alloy (a) (b) (c) (d) Figure 6.32: Schematic diagrams displaying the microstructure of 2A97 Al-Cu-Li alloys under various thermomechanical conditions, with the needle-shaped symbol and grey level representing T 1 phase precipitate and copper content level in the alloy matrix, respectively (a) T3, (b) T4, (c) T6, (d) T8. 348


349 Chapter 6: Corrosion Behaviour of 2A97 Aluminium Alloy Figure 6.33: Schematic diagram illustrating the corrosion mechanism of the development of the banding structure in 2A97 Al-Cu-Li alloys. 349