REPORT DOCUMENTATION PAGE Form Approved OMB No
|
|
|
- Melissa Morrison
- 5 years ago
- Views:
Transcription
1 REPORT DOCUMENTATION PAGE Form Approved OMB No Public reporting burden for this collection of information is estimated to average 1 hour per response, including the time for reviewing instructions, searching existing data sources, gathering and maintaining the data needed, and completing and reviewing the collection of information. Send comments regarding this burden estimate or any other aspect of this collection of information, including suggestions for reducing the burden, to Department of Defense, Washington Headquarters Services, Directorate for Information Operations and Reports ( ), 1215 Jefferson Davis Highway, Suite 1204, Arlington, VA Respondents should be aware that notwithstanding any other provision of law, no person shall be subject to any penalty for failing to comply with a collection of information if it does not display a currently valid OMB control number. PLEASE DO NOT RETURN YOUR FORM TO THE ABOVE ADDRESS. 2. REPORT TYPE 1. REPORT DATE (DD-MM-YYYY) TITLE AND SUBTITLE Deformation Microstructures In Β-Titanium After Deformation At Low Temperatures Final Report 3. DATES COVERED (From To) 1 October Jun-06 5a. CONTRACT NUMBER FA b. GRANT NUMBER 5c. PROGRAM ELEMENT NUMBER 6. AUTHOR(S) Professor Frederick J Humphreys 5d. PROJECT NUMBER 5d. TASK NUMBER 5e. WORK UNIT NUMBER 7. PERFORMING ORGANIZATION NAME(S) AND ADDRESS(ES) University of Manchester (UMIST) Grosvenor Street Manchester M1 7HS United Kingdom 8. PERFORMING ORGANIZATION REPORT NUMBER N/A 9. SPONSORING/MONITORING AGENCY NAME(S) AND ADDRESS(ES) EOARD PSC 821 BOX 14 FPO SPONSOR/MONITOR S ACRONYM(S) 11. SPONSOR/MONITOR S REPORT NUMBER(S) Grant DISTRIBUTION/AVAILABILITY STATEMENT Approved for public release; distribution is unlimited. 13. SUPPLEMENTARY NOTES 14. ABSTRACT This report results from a contract tasking University of Manchester (UMIST) as follows: The contractor shall investigate cell boundary misorientations, alignments, and stored energies in a beta titanium alloy subjected to cold work. The contractor shall use a beta Ti alloy that is stable and single-phase at room temperature. The contractor shall evaluate the microstructure of the material after deformation at room temperature and at temperatures up to ~400C. Both channel die compression and rolling will be used to deform the material. Both optical as well as scanning electron microscopy will be used to characterize the resulting microstructures. Electron Backscatter Diffraction will be used to measure the grain and cell misorientations. 15. SUBJECT TERMS EOARD, Deformation analysis, Metals & alloys, Titanium, Materials Process Design 16. SECURITY CLASSIFICATION OF: 17. LIMITATION OF 18, NUMBER 19a. NAME OF RESPONSIBLE PERSON ABSTRACT OF PAGES JOAN FULLER a. REPORT b. ABSTRACT c. THIS PAGE UL UNCLAS UNCLAS UNCLAS 44 19b. TELEPHONE NUMBER (Include area code) +44 (0) Standard Form 298 (Rev. 8/98) Prescribed by ANSI Std. Z39-18
2 Deformation microstructures in β-titanium after deformation at low temperatures F.J. Humphreys, P.S. Bate and I. Brough The University of Manchester, Materials Science Centre Manchester M1 7HS, England EOARD Award FA June
3 1. Introduction There are a number of β titanium alloys which give very high strengths and have ductilities sufficient for cold forming. The commercial β alloys are usually metastable and can be heat treated to give decomposition of the metastable β. There has been substantial research work on the development of microstructure during high temperature processing of the α and α+β alloys, but relatively little on the deformation substructure of β alloys at low temperatures. In the wider context, little work has been done on the deformation substructure of highly alloyed BCC metals of which the β titanium alloys form an important subset. The aim of the project was to carry out a short investigation to evaluate the microstructure of a supersaturated metastable β-ti alloy after deformation at low temperatures. In particular, it was proposed to investigate the application of Electron Backscatter Diffraction (EBSD) to the material. 2. Materials The material chosen for the investigation was Timet β-titanium 21S, and two versions of the material were provided by Dr S.L. Semiatin of AFRL: a hot-worked plate, and a cast billet. The plate had been homogenised and produced a reasonably small grain structure on solution treatment (see below). The cast billet had a very large grain size, and as this material would require a very long homogenisation treatment which might introduce contamination, it was decided not to use this material for the preliminary investigation carried out under this contract. It is hoped to use this material for further investigations which will be carried out when the preliminary work has been analysed. β-21s has a nominal composition of 15Mo-2.6Nb-3Al-2Si. It is a metastable alloys with a transus temperature of ~805 o C, and was originally developed as a cold rollable sheet alloy for foils and strip. It is typically aged at o C to precipitate fine acicular alpha. 3. Background information on β-21s and similar alloys A comprehensive overview of β-ti alloys is given by Weiss and Semiatin (1998). Stability and precipitation The TTT curves of metastable β-ti alloys typically show two C curves, the upper is due to precipitation at grain boundaries and the lower to homogeneous precipitation. Figure 1 is a TTT curve for Ti-15V-3Cr (known as Ti-15-3) (Furuhara et al. 2001). The supersaturated alloys precipitate Ω phase on ageing at o C, and alpha phase may nucleate on the omega (Huang et al 1994, Banerjee & Naik, 1996, Ankem & Greene 1999). 2
4 Figure 1. Precipitation in solution treated and aged Ti (Furuhara et al 2001) Room temperature mechanical properties Metastable β-ti alloys are well known to have a low work hardening rate at room temperature (Reshad et al 1996, Ankem & Greene 1999, Doraiswamy & Ankem, 2003), resulting in low uniform elongation and poor formability. The main deformation mode is slip, which may be wavy or straight. However, some stress induced plates (SIP) may be formed, particularly in the less stable alloys, and these are thought to be twins or martensite. During warm deformation in the range o C, serrated flow may occur, and this is believed to be associated with omega precipitation. Deformation or shear bands at higher temperatures are associated with soft channels due to precipitate shearing (Banerjee & Naik, 1996). 4. Experimental Methods Heat treatment The wrought alloy was solution treated at 850 o C for 20 minutes in an argon atmosphere and quenched. Microstructural examination showed the material to have an equiaxed grain structure of mean linear intercept of 125µm (figure 2a). EBSD showed that there was a high proportion of medium angle (5-15 o ) boundaries in the microstructure, and this is shown in the misorientation distribution of figure 2b. The mean linear intercept for high angle boundaries alone was 214µm. Such a microstructure shows that some coarse remnants of the hot working substructure remained after solution treatment, indicating that the material had not recrystallized after the initial hot working. TEM investigation showed no significant secondphases to be present. Examination of the crystallographic texture of the starting material using EBSD indicated it to be close to random. Deformation Slices of the plate ~12 mm thick were cold rolled to true strains of 0.2 and 0.5 using reductions of 0.5mm/pass for t>5.5mm) and 0.25mm/pass for t<5.5mm. The rolling direction was reversed between passes. 3
5 Microstructural examination Samples were cut from the centre of the rolled material parallel to the ND-RD plane and examined by optical microscopy, scanning electron microscopy (backscattered electron imaging) and EBSD. SEM and EBSD were carried out in an FEI Sirion FEGSEM operating at 15keV for backscattered imaging and 10keV for EBSD. EBSD data were acquired with an HKL Channel5 system with a Nordlys2 detector. The pattern solution rate was typically 90-95% for the 20% rolled material and 75-85% for the material cold rolled to a strain of 0.5. The EBSD results were analysed using software developed in house. To aid interpretation of the EBSD data, a limited amount of TEM was carried out on a Philips CM20 microscope operating at 200keV. The SEM images and EBSD maps are all presented with RD vertical and ND horizontal. In some figures, pole figures obtained from EBSD are presented. In situations where the absolute grain orientation is of interest, e.g. cube-oriented grains in figures 5,6 and 12, standard pole figures are presented. However, in cases where the alignment of the substructure with the crystallography is of interest, e.g. figures 7-10, 13-15, the pole figures are plotted so that directions in both map and pole figure coincide.. Note that all the figures reference the source number of the micrograph or EBSD map from which they were obtained. This is to enable further analysis to be carried out on the data if required. Material cold rolled 20% SEM Backscattered imaging 5. Results Samples sectioned parallel to the RD-ND plane were examined, and in all micrographs the rolling direction is vertical. Figure 3a shows the grain structure and coarse deformation markings in the 20% cold rolled material. Figure 3b, at higher magnification, shows fairly regular parallel banding in several directions in each grain, and there is some indication of changes in the deformation patterns adjacent to the grain boundaries. Figure 3c confirms this, and also shows a few micron-scale second-phase particles at the horizontal grain boundary. TEM A small amount of transmission electron microscopy was carried out on the deformed samples. This was primarily to reveal the nature of the dislocation structures in the material which would aid the interpretation of the EBSD results. Figure 4 shows that the 20% deformed material has a very high dislocation density. The main features are parallel bands of tangled dislocation superimposed on a more uniform distribution of dislocations. The bands were typically ~100nm wide, and spaced ~200nm. There were regions, such as seen in figures 4b and c, where the bands were interrupted by intersecting 4
6 regions of lower dislocation density. In general, only one set of bands was observed per grain. There was no evidence of a cell structure nor of any sharp boundaries or platelike structures. This may be compared with the TEM investigations on the cold deformation of several β-ti alloys by Karasevskaya et al (2002) who reported dislocation cell structures in Timetal-LCB and Ti-15-3 and no cell structures, but martensite plates in VT22 and TC6. EBSD Overview of the deformation microstructure Samples sectioned parallel to the RD-ND plane were examined, and in all EBSD maps the rolling direction is vertical. Some 30 EBSD maps, typically of 400x400 points were obtained with a variety of pixel step sizes. In most cases, the orientation noise, which is typically ~1 o, was reduced by using the Kuwahara filter method of Humphreys et al (2001). Figure 5 is an example of a low magnification map, showing several grains. Figure 5a shows the boundaries detected in the map by examining adjacent pixels. Thick black lines represent high angle boundaries (>15 o ) and thin lines represent low angle boundaries (1-15 o ). The 100 pole figure of figure 5b shows that many of the grains are close to a cube orientation. Figure 5c is a pattern quality map. Dark regions represent areas where the diffraction pattern quality is low, and this is typically at boundaries. The pre-existing grain boundaries are clearly revealed. Within many of the grains there is little evidence of low angle deformation boundaries, but within some, irregular, often widely-spaced dark lines are seen. Such markings are typical of deformation bands in deformed alloys. It is notable that these are particularly associated with the grain boundaries and with triple junctions. A linescan across a grain containing deformation bands is shown in figure 5d. The data are presented as the cumulative misorientation with respect to point A of the scan. The linescan shows a number of large misorientations (10-15 o ) at positions corresponding to the dark lines on the map. The deformation bands are seen to be relatively narrow regions which are highly misoriented to the matrix on either side. Figure 6 is a similar type of map, but of a different area, which again is seen (figure 6b) to contain a significant amount of cube-oriented material. The pattern quality map of figure 6c again shows evidence of deformation bands, and a linescan AB within a grain which appears to have little internal deformation structure is shown in figure 6d. This shows a cumulative orientation change of only ~5 o in ~150µm, and no sharp low angle boundaries. In figure 6e, the boundary character is analysed. Boundaries >15 o are denoted by thick black lines and those of medium angle (5-15 o ) as green lines and the results superimposed on the pattern quality map. Although some of the medium angle boundaries, such as those at C are deformation induced, many of them, such at the ones at D are clearly pre-existing boundaries, confirming that the solution treated microstructure before deformation contained a large number of such boundaries, indicating that the solution treatment resulted in recovery rather than recrystallization (c.f. figure 2). Figures 7 to 10 are examples of higher magnification maps with step sizes of 0.08µm. The area of figure 7 contains no significant deformation bands as shown by the linescan, whereas figure 8 includes an area of deformation banding in which larger misorientation increases are found. Figure 9 is of an area where there is little orientation change as shown by the linescan of figure 9d. In such a case, very small orientation changes may be revealed by plotting the 5
7 pixels in relative Euler contrast (Humphreys et al 2001). In this method, which emphasises small changes in orientation, the RGB colour of a pixel is determined by the difference between its Euler angles and those of a reference pixel. The advantages of this method may be seen by comparison of figure 9c, in which misorientations larger than 0.3 o are superimposed on the relative Euler plot, with figures 9a and b. A similar plot is shown in figure 10b. The axis of misorientation 110 pole figures corresponding to the areas within the EBSD maps of figures 7-10 show that although there may be no significant local misorientations, there is often a significant orientation spread within the region analysed. The pole figure indicate that this orientation spread is close to the transverse direction, and this can be confirmed by analysing the data, determining the extremes of orientation, and thus defining an axis of misorientation. In figure 8e, the axis of misorientation is plotted and seen to be close to TD, which is consistent with the expectations of crystal plasticity theory. The boundaries revealed by EBSD EBSD is commonly used to analyse deformed microstructures which contain well defined condensed boundaries, and the use of orientation averaging allows boundaries as low as ~0.3 o to be detected (e.g. Humphreys 2001). However, it is clear that in this material, the boundaries are not condensed, as is shown by the TEM micrographs. Figures such as 9c and 10b and the associated linescans show that although orientation changes of up to ~1 o occur, the standard method of analysing boundaries by comparing the orientations of adjacent pixels, is not entirely appropriate, because the misorientations are gradual, and many are not detected by the conventional analysis. The boundaries detected in figures 9c and 10b are fragmented and broader than true boundaries. The real microstructures are probably better represented by the linescans, and described in terms of wavelengths and peak heights. Boundary alignment The higher magnification maps of figure 7-10 show strong alignment of the fine scale microstructure. In aluminium, there is an ongoing discussion as to whether the substructure alignment is primarily crystallographic, on {111} planes, as claimed by the Risø group (e.g. Winther 2003 ), or non-crystallographic, occurring on planes determined by the deformation mode (Hurley et al. 2003). Visual inspection of the microstructures and comparison with the positions of the 110 poles shows no obvious alignment of the bands with {110} planes. This suggests either that the bands are aligned with planes other than {110}, which is likely if pencil glide occurs, or that they are aligned with respect to the deformation geometry, e.g. along planes of high shear stress. Hurley et al (2003) measured alignments in aluminium from automated image analysis of the boundaries of EBSD maps, and, for material rolled to a strain of 0.2, found a mean angle of 36 o between the boundaries and the rolling direction. This method has been used here, but is not very satisfactory because sharp boundaries are not formed. An example of such an analysis is shown in figure 10c, where a broad alignment peak at ~45 o to RD is seen. Similar analyses have been attempted for other maps, and the mean value of the angle to RD is 40±2 o. However, because of the difficulty in defining the bands, there is a broad spread and we suggest that the method requires a better representation of the substructure before it can be reliably used. 6
8 Material cold rolled to ε=0.5 SEM Backscattered imaging Figure 11 presents examples of the microstructures of the 0.5 cold rolled material. In all micrographs the rolling direction is vertical. Compared with the 0.2 deformed material, the grains are elongated in RD, but more significantly, they contain much more complex deformation structures at a variety of scales. The low magnification micrographs of figure 11a and b show the coarser deformation banding, and figures 11c and d reveal more detail within the grains. Although some parallel banding is revealed in these micrographs, it appears to be more complex than at the lower strain, and the bands are much broader and less well aligned. Within this preliminary investigation it was no possible to determine the nature of the alignment of the bands. TEM The microstructures observed in the TEM for this material were rather more complicated than for the lower deformation. The dislocation density was estimated to be rather larger, and although the same type of diffuse parallel bands of high dislocation density were seen, as shown in figure 12a and b, these bands were broader than at the lower strain, and less clearly defined. In many places, bands running in several directions could be observed (figure 12c), and in other areas (figure 12d), the banding was less distinct and a fairly uniform dislocation structure was evident. EBSD Some typical EBSD maps of the material cold rolled to a strain of 0.5 are presented in figures Many of the features are similar to the 0.2 material. A low magnification map is shown in figure 13. The pattern quality map shows many similarities to the 20% deformed material of figures 5 and 6, which is strongly cube-oriented. However, more boundaries are revealed in figure 13b. Again, there are some grains with little apparent substructure and this is shown in the linescan AB. The deformation bands in an adjacent grain are shown in the scan CD. Higher magnification maps with a step size of 0.08µm are shown in figures Figure 14 is from a region where the pattern quality map (figure 14a) indicates deformation inhomogeneities. The boundaries shown in figure 14b are very broad, and the linescan of figure 14d shows the local misorientations to be small. Many of the maps show bands aligned in more than one direction (e.g. figure15) and the bands tend to be broader and less well aligned than at the lower strain, (e.g. figure 16). Because presentation of the deformation microstructures in terms of boundaries was not ideal, and the cumulative misorientation scans appear to give better information, we have examined the potential of using 3-D representation of misorientation surfaces, and examples of this are given in figures 14e and 16f. Such plots clearly reveal the gradual orientation changes across the bands. 7
9 6. Discussion The starting material It is known that it may be difficult to remove the deformation substructure in hot worked Ti21S, even by solution treatment (Semiatin 2004). Our treatment at 850 o C resulted in a retention of some coarse substructure with a resultant grain/subgrain size of ~100µm. A coarse deformation substructure with a large proportion of medium angle boundaries is expected to be more stable against recrystallization than one with low angle boundaries for theoretical reasons (Humphreys 1997) and this appears to be an interesting example of this phenomenon which may be worthy of further investigation. Large-scale deformation inhomogeneities EBSD revealed the formation of deformation bands within some grains. These were particularly evident at grain boundaries and triple junctions, and there was little difference in their nature and frequency at the different strains. They appear rather similar to those formed in many metals during low temperature deformation. It would be desirable to correlate the number and type of the large scale deformation bands with grain orientations, although this was outside the scope of the present investigation. Fine-scale deformation microstructures TEM showed that the 20% deformed material had a high dislocation density and contained parallel bands of even higher dislocation density, which were ~100nm wide and spaced ~200nm apart. We were unable to resolve these fine bands with EBSD, but could detect parallel bands of misoriented material of spacing nm e.g. figures The spatial resolution of FEGSEM EBSD is ~20nm, which should not be a limiting factor. The difficulties arise from the fact that the misorientation gradients are very small, e.g. 0.5 o µm -1, and therefore for the small step sizes (e.g. 80nm required to detect features separated by ~200nm), the point-to-point misorientations are very small, i.e. ~0.1 o. The angular resolution of EBSD is o, and therefore we are unable to separate the real misorientations from the noise. This is shown in figure 17a which is a scan from the map of figure 9, using the raw data. This shows structure at a spacing of ~100nm, but we cannot differentiate between the noise and real data. If the data is filtered to remove the orientation noise, as in figure 17b, which is exactly the same scan as figure 17a, but using EBSD data after orientation averaging, we lose the fine scale structure, because orientation averaging degrades the spatial resolution, whilst removing the orientation noise. With EBSD we can therefore detect some of the deformation microstructures, but are missing the fine detail revealed by TEM because it is associated with very small misorientations. In order to improve on the EBSD results we would need to substantially reduce the orientation noise. An alternative strategy would be to determine misorientations not between adjacent pixels, but perpendicular to the bands, maintaining the spatial resolution perpendicular to the bands, but relaxing it along the bands so as to reduce the orientation noise. However, the current EBSD results do provide useful information about the alignment of the bands, which appears to be determined by the deformation geometry rather than the crystallography, the misorientation axes, which are close to TD, and the local textures. Considerable further work will be necessary to determine the nature of the boundary alignments and to ascertain how the microstructures depend on the grain orientations. 8
10 The effect of strain Comparison of the materials cold rolled to strains of 0.2 and 0.5 shows that similar features are formed at both strains, but at the higher strains the misoriented bands of high dislocation density are broader, less well aligned, and that several sets of fine bands are often present in each grain. 7. Summary Hot worked Ti-21S retains a coarse (100µm) substructure including many boundaries of 5-15 o misorientation, on solution treatment at 850 o C. The quenched alloy contains few second-phase particles. On cold rolling to a strain of 0.2, a microstructure of coarse deformation bands and finer parallel bands is formed. EBSD shows that the deformation features are not condensed dislocation boundaries, but are associated with gradual misorientations, and this has been confirmed by TEM. With EBSD we have been able to study the coarse deformation bands and find them to be similar to those formed in many ductile polycrystalline metals. We have been able to analyse many aspects of the finer bands. However, the small pointto-point misorientations associated with these bands makes it impossible to resolve the details of the bands to the level seen in the TEM. The conventional methods of analysing EBSD maps by defining boundaries in terms of the relative orientation of adjacent pixels are not readily applicable to these microstructures, and new methods of analysing microstructures where the orientation changes are gradual, will need to be developed. The parallel bands are aligned at ~40 o to the rolling direction at ε=0.2 and do not appear to be related to the crystallography. At larger strains the alignment is more complex and has not been analysed. After cold rolling to a strain of 0.5, the microstructures are rather similar. However, the dislocation densities are higher, and the fine bands are broader and less well aligned. This preliminary investigation has shown that EBSD and Backscattered electron imaging are useful tools to investigate the microstructures and microtextures of beta titanium after room temperature deformation. Although dislocation structures cannot be directly resolved, various scales of linear deformation features can be detected and characterised. Further work should enable these linear features to be characterised in more detail and their nature and frequency related to grain orientations and strain. Such characterisation may help in the development of macroscopic deformation models of deformation. 9
11 Acknowledgements This work was supported through EOARD Award FA , and by the UK Engineering and Physical Sciences Research Council. We are grateful to Dr S.L. Semiatin for his help and advice and the provision of the material. References S. Ankem & C.A. Greene. Materials Science & Engineering. (1999), A263, 127. S. Banerjee & U.M. Naik. (1996), Acta Mater. 44, D. Doraiswamy & S. Ankem, (2003). Acta Mater. 51, T. Furuhara, T. Maki and T. Makinoto. (2001), J. Mats Proc. Tech. 117, 318. X. Huang. J. Cuddy, N. Goel and N.L. Richards. (1994). J. Mats Eng. And Performance. 3, 560. F.J. Humphreys. (1997). Acta Mater, F.J. Humphreys. (2001). J. Mats. Sci. 36, ,. F.J. Humphreys, P.Bate and P.J. Hurley. (2001). J. Microscopy, 201, P.J. Hurley, P.S. Bate and F.J. Humphreys. (2003). Acta Mater. 51, O.P. Karasevskaya, O.M. Ivasishin, S.L.Semiatin, and Y.V. Matviychuk. (2002). Mats. Sci. & Eng. A354, 121. J. Reshad, I. Weiss, R. Srinivasan, T.F. Broderick and S.L. Semiatin. (1996). Advances in Science & Tech. of Ti alloy Processing. Anaheim, Ca, 259. S.L. Semiatin (2004). Private communication. I. Weiss and S.L. Semiatin, (1998). Mats. Sci & Eng. A243, 46. G. Winther. (2003). Acta Mater. 51,
 EBSD map of solution treated material.")

12 (a) Frequency Misorientation ( o ) (b) Figure 2. a) EBSD map of solution treated material. High angle boundaries (>15 o ) are shown as black and low angle boundaries as white. b) Misorientation distribution in the material. (Map Ti21S_ST_030505) 11


13 (a) (b) 12

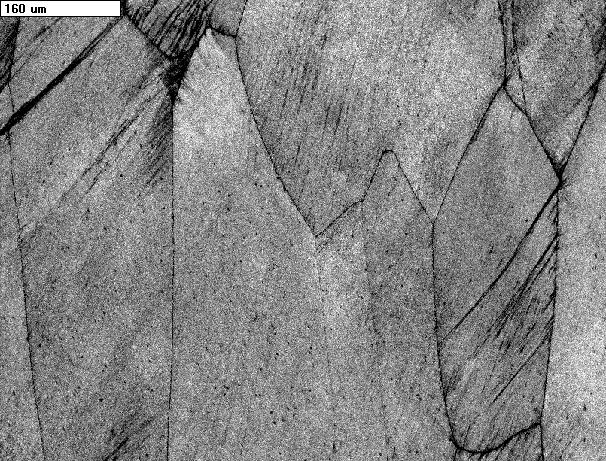
14 (c) Figure 3. SEM backscattered electron micrographs of 20% cold rolled material. (files 11, 12, 13) 13


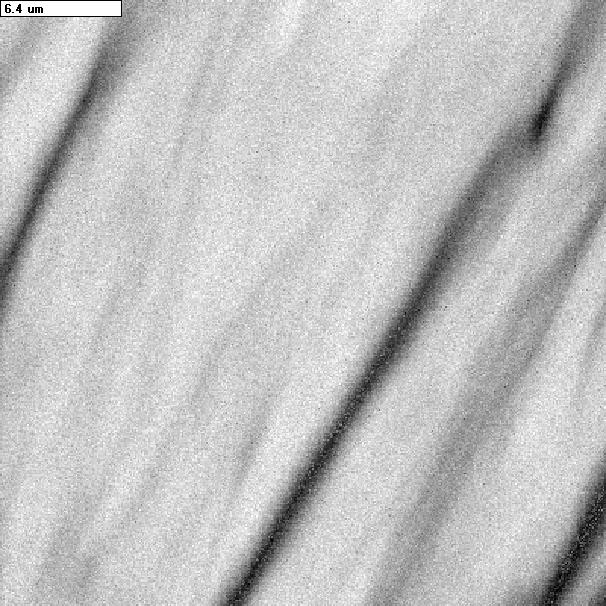
15 500nm (a) (b) (c) Figure 4. Transmission electron micrographs of 20% cold rolled material. (files 407, 417, 424) 14
16 (a) (b) 15
 are thick lines and low angle (1-15 o ) are thin lines.")
17 (c) A B (d) Figure 5. Low magnification EBSD map with 3µm steps, of 20% rolled material. The rolling direction is vertical in all EBSD maps. (Map T121S_FSTR20_1) a) The detected boundaries. High angle boundaries (>15 o ) are thick lines and low angle (1-15 o ) are thin lines. b) Standard 100 pole figure showing strong cube texture c) Pattern quality map d) Cumulative misorientation along the line AB which crosses several deformation bands. 16
18 (a) (b) 17
19 A B (c) 6 Cumulative misorientation (deg) Distance (um) (d) 18
 are thick lines and low angle (1-15 o ) are thin lines.")
20 C D (e) Figure 6. Low magnification EBSD map with 3µm steps, of 20% rolled material. (Map T121S_FSTR20_5) a) The detected boundaries. High angle boundaries (>15 o ) are thick lines and low angle (1-15 o ) are thin lines. b) Standard 100 pole figure showing strong cube texture c) Pattern quality map d) Cumulative misorientation along the line AB. e) Pattern quality map with medium angle (5-10 o ) coloured green and higher angle boundaries black. Medium angle boundaries such as at C are deformation induced, but those such as at D are pre-existing. 19
 20")

21 A (a) B (b) 20
22 (c) Figure 7. EBSD map with 0.25µm steps, of 20% rolled material. (Map T121S_FSTR20_4) a) Pattern quality map b) Detected boundaries >0.5 o. c) Cumulative misorientation along the line AB d) 110 pole figure, in which the data are plotted with respect to the plane of the sample (d) 21
 22")

23 A B (a) (b) 22
24 (c) (d) (e) Figure 8. EBSD map with 0.25µm steps, of 20% rolled material. (Map T121S_FSTR20_10) a) Pattern quality map b) Detected boundaries >0.5 o. c) Cumulative misorientation along the line AB d) 110 pole figure e) Axis of misorientation 23

25 (a) (b) 24
 25")
26 A B (c) (d) 25
27 (e) Figure 9. EBSD map with 0.08µm steps, of 20% rolled material. (Map T121S_FSTR20_030205_6) a) Pattern quality map b) Detected boundaries >0.3 o. c) Relative Euler colour map with boundaries superimposed d) Cumulative misorientation along the line AB. The there is a spread of orientation of ±1.6 o about the mean in the map. e) 110 pole figure 26


28 (a) (b) 27
29 (c) (d) Figure 10. EBSD map with 0.08µm steps, of 20% rolled material. (Map T121S_FSTR20_260105e) a) Pattern quality map b) Relative Euler colour map with boundaries >0.4 o superimposed c) Alignment of the bands relative to the rolling direction. d) 110 pole figure 28


30 (a) (b) 29


31 (c) (d) Figure 11. SEM backscattered electron micrographs of material cold rolled to a strain of 0.5. (files K,M,D,N) 30
 (c) (d) Figure 12 a-d.")


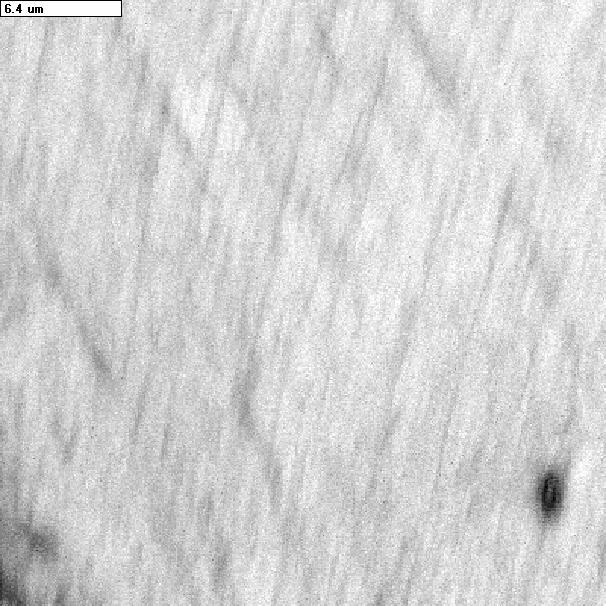
32 (a) (b) 500nm (a) (b) (c) (d) (c) (d) Figure 12 a-d. Transmission electron micrographs of material cold rolled to a strain of 0.5 (files 407, 409, 413, 408) 31
 32")
33 (a) A C B D (b) 32
34 (c) (d) 33
35 (e) Figure 13. Low magnification EBSD map with 1µm steps, of material cold rolled to a strain of 0.5. (Map T121S_FSTR50_160305) a) Pattern quality map b) The detected boundaries. high angle boundaries (>15 o ) are thick lines and low angle (1-15 o ) are thin lines. c) Cumulative misorientation along the line AB in a grain with little orientation spread d) Cumulative misorientation along the line CD in a grain containing deformation bands e) 100 pole figure 34
 35")
36 A (a) B (b) 35
37 (c) (d) 36
 a) Pattern quality map b) The detected boundaries >0.5 o.")
38 (e) Figure 14. EBSD map with 0.08µm steps, of material cold rolled to a strain of 0.5. (Map T121S_FSTR50_090205a) a) Pattern quality map b) The detected boundaries >0.5 o. c) Cumulative misorientation along the line AB d)110 pole figure e) 3-D representation the cumulative misorientations in the map 37
 38")
39 A (a) B (b) 38

40 (c) (d) 39
41 (e) Figure 15. EBSD map with 0.08µm steps, of material cold rolled to a strain of 0.5. (Map T121S_FSTR50_090205d) a) Pattern quality map b) The detected boundaries >0.5 o. c) Relative Euler colour map with boundaries superimposed. d) Cumulative misorientation along line AB e) 110 pole figure 40
 41")

42 A B (a) (b) 41
43 (c) (d) (e) 42

44 (f) Figure 16. EBSD map with 0.08µm steps, of material cold rolled to a strain of 0.5. (Map T121S_FSTR50_090205h) a) Pattern quality map b) Relative Euler colour map with boundaries>0.5 o superimposed. c) Cumulative misorientation along the line AB d)110 pole figure e) Axis of the misorientation within the map f) 3-D representation the cumulative misorientations in the map 43
45 1.2 Cumulative misorientation (o) Distance (um) (a) 1.4 Cumulative misorientation (o) Distance (um) (b) Figure 17 The effect of orientation averaging on the misorientations detected in Map T121S_FSTR20_030205_6, which was used for figure 9. a) Scan using raw data b) Scan of the same line of data after orientation averaging. 44