Schematic representation of the development of microstructure. during the equilibrium solidification of a 35 wt% Ni-65 wt% Cu alloy
|
|
|
- Theodora Arnold
- 5 years ago
- Views:
Transcription
1 Schematic representation of the development of microstructure during the equilibrium solidification of a 35 wt% Ni-65 wt% Cu alloy
2 At 1300 ºC (point a) the alloy is in the liquid condition This continues until the solidification path (vertical line) crosses the liquidus at about ~ 1260 ºC (point b) where solid α starts to precipitate within the liquid with composition of 46% Ni.
3 Continuous cooling through point c (around ~ 1250 ºC) the amount of α has grown within the liquid while the compositions of both α and the liquid change following the solidus and liquidus lines, respectively. As cooling continues α continues to grow with its composition following the solidus line at the expense of the liquid.
4 Just below point d (intersect with the solidus line) solidification is complete and the structure is composed entirely of solid α with overall composition as the original alloy. further cooling to point e will not change the composition of α
5 Exercise determination of microstructural developments under non-equilibrium conditions. Requirements: Explain the microstructural developments under equilibrium and non equilibrium conditions as shown below.
6
7 Binary Eutectic Systems In this system the two metals which are completely soluble in the liquid state become only partially soluble in the solid state
8 The copper-silver phase diagram
9 In addition to the points noted for the binary isomorphous system a few points can be added to the binary eutectic system which also are applicable for other types of binary system:
10 The line of solubility limit (line separating a single solid solution phase field from a two solid solution phase field) is termed Solvus. On the liquidus line there exist a point which intersects the solidus line and is has a symbol of E indicating the point at which the Eutectic reaction takes place
11 This point is the only point that three phases can co-exist and is termed the invariant point. Alloys of the eutectic composition will have the lowest melting point. The general principles of determining phase composition and phase amount still apply.
12 The lead (Pb)-Tin (Sn) phase diagram, will be used to explain the Eutectic binary system as follows:
13
14 At around 300 C the alloy is in the liquid state having the original composition of the alloy (40 % Sn) α phase starts to precipitate within the liquid upon crossing the liquidus line (point k)
15 Just above the eutectic temperature (point l) α phase and liquids co-exist with compositions around 18.3 and 61.9 Sn, respectively. As the temperature drops just below the eutectic temperature, solidification proceeds by a eutectic reaction forming alternate layers of α and β.
16 The eutectic reaction is one in which one liquid phase results in two solid phases: L α + β This reaction takes place at a constant temperature (the eutectic temperature)
17 α-phase which precipitated before the final solidification through the eutectic reaction is termed primary α. The final microstructure would be composed of a mixture of primary α and the eutectic structure.
18
19 An alloy of the eutectic composition will solidify at a constant temperature (the eutectic temperature) and the microstructure will be completely composed of the eutectic structure (layers of α and β)
20
21
22 Alloys with eutectic composition are termed eutectic alloys Alloys with composition lower than the eutectic composition are termed hypoeutectic alloys Alloys with composition higher than the eutectic composition are termed hypereutectic alloys
23 Exercise Determine the phases present, phase composition and the amounts of phases in an alloy containing 40% Sn at 150 ºC Explain the microstructure development under non-equilibrium conditions in
24
25 The eutectoid reaction If the original phase resulting in the two new phases is a solid phase the reaction is termed a Eutectoid reaction.
26
27 In this example the eutectoid reaction is: β α + α As in the case of eutectic alloys: Alloys with eutectoid composition are termed eutectoid alloys Alloys with composition lower than the eutectoid composition are termed hypoeutectoid alloys Alloys with composition higher than the eutectoid composition are termed hypereutectoid alloys
28 Binary systems in which a peritectic transformation is involved Sometimes in an alloy system two phases which are already present interact at a fixed temperature to produce an entirely new phase.
29 If one of the interacting phases is a liquid the transformation is termed peritectic transformation. L + α β If both interacting phases are solid the transformation is termed peritectoid transformation. α + β γ
30
31 The Platinum-Silver phase diagram will be used to explain the peritectic reaction. In this system peritectic reactions will take place in alloys containing between 12 % and 69 % silver.
32 Considering an alloy with original composition of 25% silver and 75% platinum Above 1600 ºC the alloy is in the liquid state At about between 1600 ºC and 1185 ºC the, solidification proceeds by precipitating solid α with its composition moving along the solidus line (SP) while the composition of the liquid moving along the liquidus line (SR).
33 Just above 1185 ºC the structure is composed of solid α with composition (12% silver and the remaining liquid with composition 69% silver with wt. % as follows: W α = x 1 R RP x W L 1 = P RP
34 At 1185 ºC (the peritectic temperature) the peritectic reaction takes place where the solid α starts to interact with the liquid and producing the new phase δ, i.e., L +α δ
35 The solid solution δ contains 45 % silver. At this point all the liquid was used up during the transformation and the final structure will be composed of a mixture of δ and α.
36 At 1185 ºC wt. % will be as follows: W α = x 1 Q PQ W δ = x 1 P PQ
37 It should be noted that in an alloy originally containing more than 45% silver the solid phase α will be used up before the liquid and the final structure will be composed of a single solid phase δ.
38 Systems containing one or more intermediate phases
39 An example of this binary system is the Magnesium-Tin phase diagram Intermediate phases do not have a singlephase field but appear in a two-phase filed as in this example. In fact, due to the fixed composition the actual phase field is a straight vertical line (having a width of zero).
40 It should also be noted that the intermediate phase (in this case an intermetallic compound) has the highest melting point due to the additional chemical effects on the bonding between the alloying elements. Apart from these points the previous discussion applies to this binary system.
41 Exercise: Follow the solidification path of an alloy of original composition of 40 % Mg.
42 The Iron-Carbon Binary System Perhaps the most important binary system is that of the iron-carbon, as this represents the phase diagram of all plain carbon steels and cast irons. For steels, the useful part of this system is actually the iron-iron carbide (Fe-Fe3C) phase diagram
43
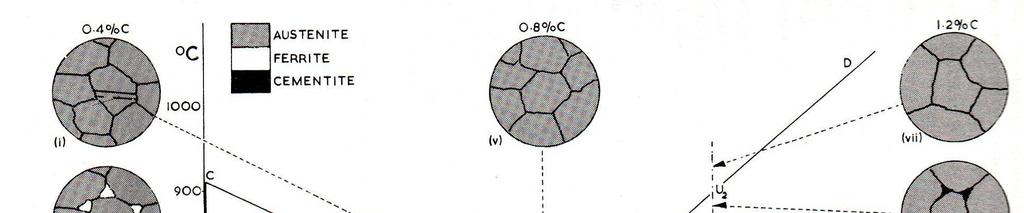
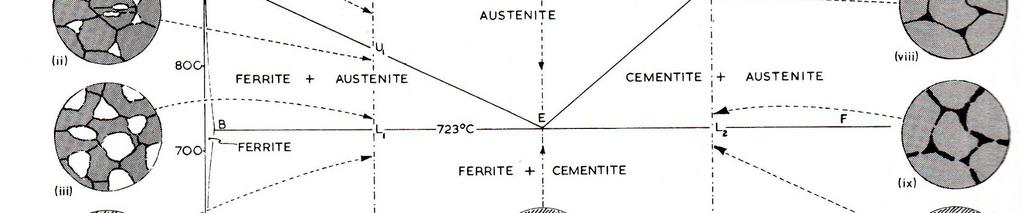
44 Ignoring the upper left corner of the diagram, the important phases present are: γ phase or Austenite. This phase has an FCC lattice structure with a maximum solubility of carbon of about 2% at around1150 ºC.
45 α phase or Ferrite. This is a soft phase (nearly pure iron) with a BCC lattice structure and a maximum solubility of carbon of about 0.02 % at around 727 ºC (in some texts 723 ºC). Fe3C (iron carbide) or Cementite. This is a hard phase with a constant carbon content of 6.67 %.
46 The practical portion of this phase diagram pertinent to plain carbon steels (i.e. with carbon content up to 2%)
47
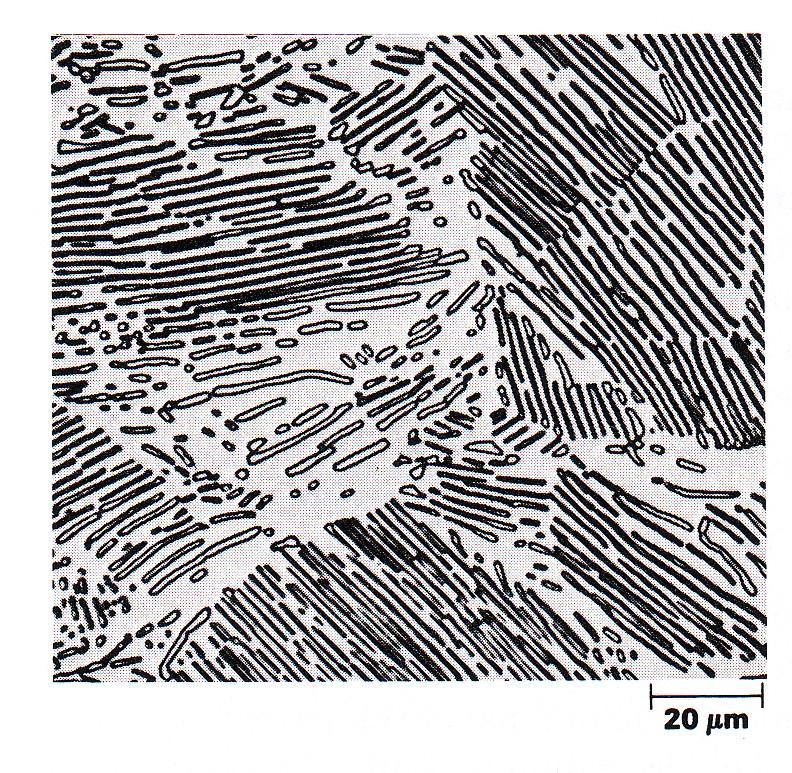
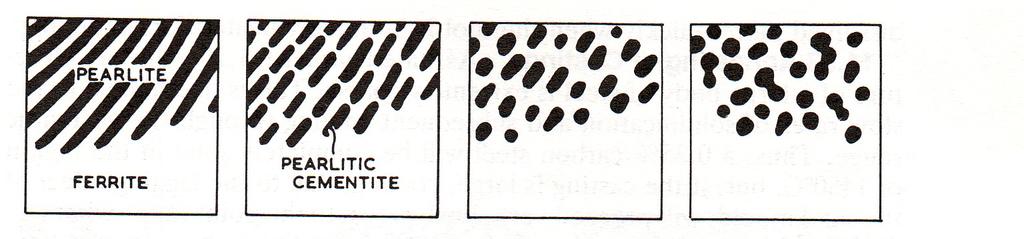
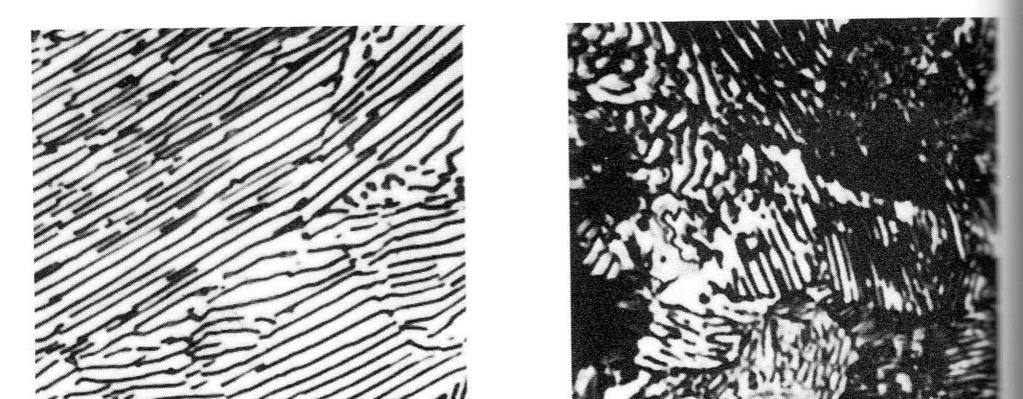
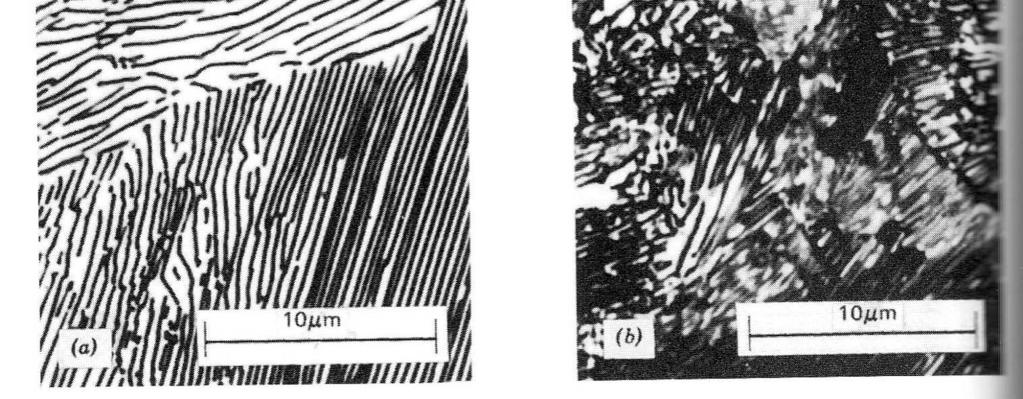
48 The following can be noted: Upon cooling a steel of 0.8 % carbon content from the austenite region, the final structure will be a result of a eutectoid reaction (γ α+ Fe3C) and the structure will be composed of alternate layers of ferrite and cementite. This type of structure is called Pearlite. The thickness of these layers will depend on the cooling rate (slow cooling will promote course layers). This type of steel is termed Eutectoid Steel
49
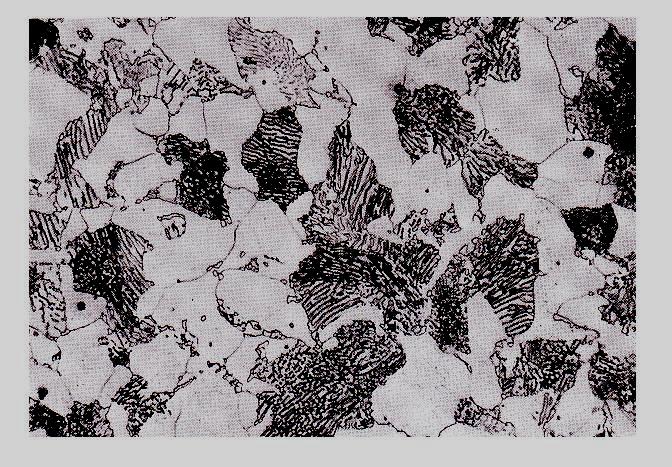
50 Upon cooling a steel containing less than 0.8 % carbon content from the austenite region, the final structure will be composed of primary ferrite and eutectoid structure (pearlite). This type of steel is termed Hypoutectoid Steel
51
52 Upon cooling a steel containing more than 0.8 % carbon content from the austenite region, the final structure will be composed of primary cementite and eutectoid structure (pearlite). This type of steel is termed Hyperutectoid Steel
53
54 The temperature below which austenite does not exist is termed the lower critical temperature this is a fixed temperature and is equal to the eutectoid temperature. The temperature above which ferrite (or cementite for hypereutectoid steels) does not exist is termed the upper critical temperature.
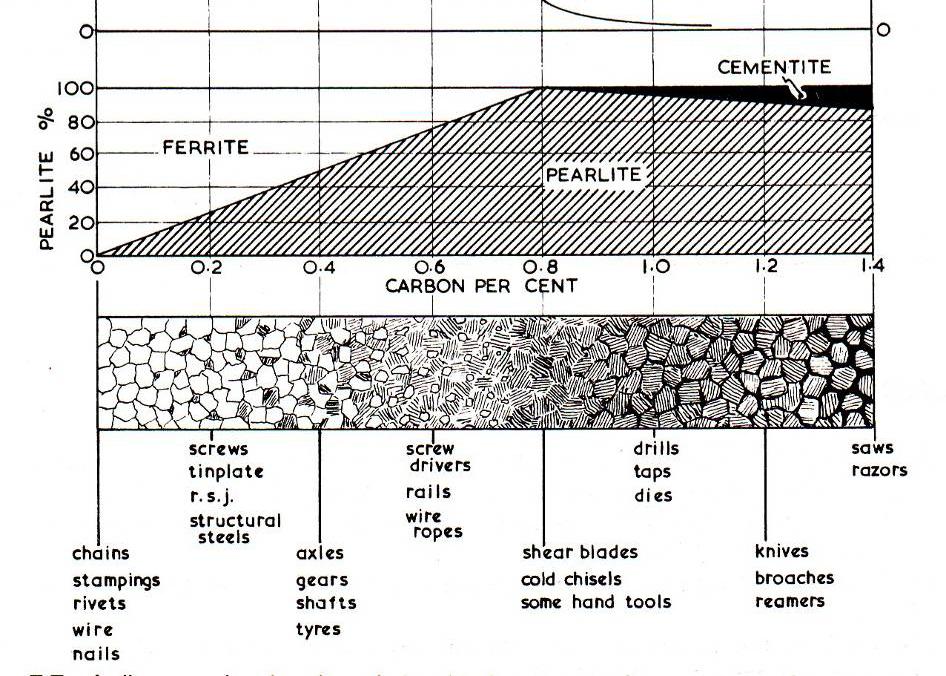
55 The relationship between carbon content and some mechanical properties of plain carbon steels
56
57 It can be noted that: Percent elongation decreases with increasing carbon content Hardness increases with increasing carbon content. Strength seems to increase with increasing carbon content reaching a maximum with a 100% pearlitic steel and then start to decrease.
58 Chapter Four Heat Treatment of Plain Carbon Steels
59 Heat treatments can be applied to steels for various purposes such as improving strength, stress relieving, increasing hardness, toughness, ductility, etc. The various heat-treatment processes can be classified as follows:
60 Annealing Normalizing Hardening Tempering Treatments involving isothermal transformations (or continuous cooling) Case hardening
61 In all these processes the steel is heated quite slowly to a predetermined temperature and then cooled. The rate of cooling is the factor that determines the resulting microstructure and the associated mechanical properties. This may vary from a drastic water quench to a slow cooling in a furnace.
62 The various processes will be explained as follows: Annealing The term annealing describes a number of different heat treatment processes applied to metals and alloys and can be classified as follows:
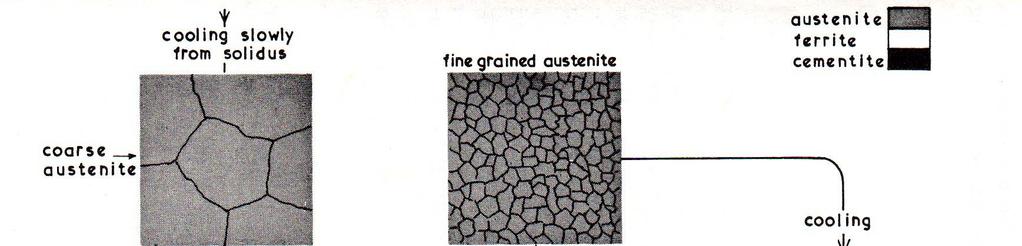
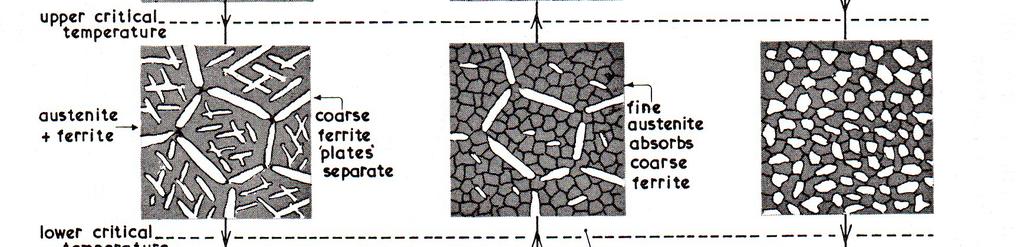
63 Stress-relief annealing This type of annealing is normally carried out below the lower critical temperature and is applied to cold worked parts in order to relieve stresses set up by mechanical working (cold forming). The process is quite simple and involves heating the steel to above its recrystallization temperature (500 C) normally to 650 C and then allow slow cooling.
64 It should be noted that although ductility is increased, prolonged annealing may result in deterioration of properties resulting from the balling up of cementite layers within the pearlite resulting in a structure known as deteriorated pearlite
65
66 Spherodising anneals Spherodising annealing is carried out by heating the steel to a temperature just below the lower critical temperature (between 650 and 700 C ). This, as expected, would result in globular cementite within the pearlite. This is used to improve machinability of steels for subsequent hardening.
67
68 Annealing of large castings
69
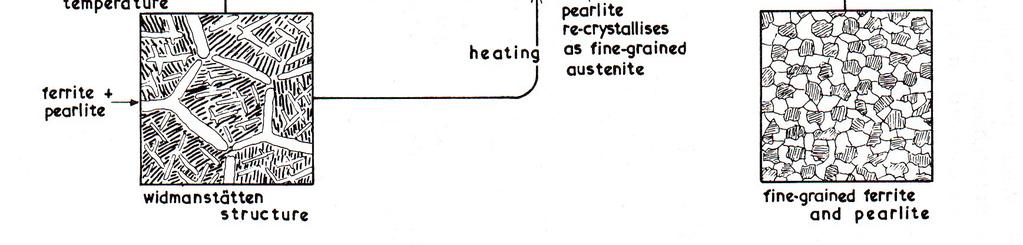
70 This process will be explained as follows: As large casting cool slowly through the austenite region (above the upper critical temperature), the grain size tends to increase dramatically driven by the high temperatures.
71 As the temperature passes the upper critical temperature, ferrite starts to precipitate along austenite grain boundaries and as cooling continues within the grains along certain crystallographic directions. As temperature falls to the lower critical temperature, the remaining austenite transform to pearlite.
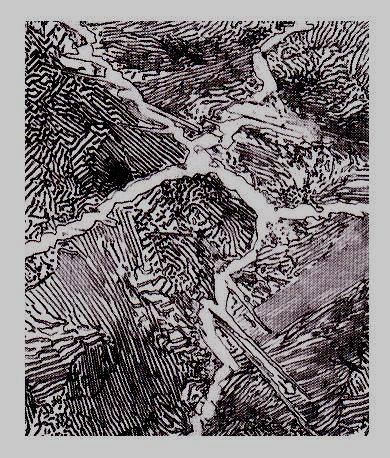
72 This result in islands of strong pearlite separated (or held) by a weak network of soft ferrite. This structure is termed Widmanstatten structure characterized by brittleness and weakness. This structure is heated to a temperature 30 to 40 C above its upper critical temperature and is held long enough just to allow the part to attain uniform temperature.
73 This would result in transformation to austenite, but this time the grain size is small, as the temperature is not too high. Upon cooling the final structure will be composed of fine ferrite and pearlite a structure with enhanced strength, ductility and toughness.
74 Normalizing Normalizing is used to provide enhanced strength and toughness. The process is basically the same as that of annealing of casting except that after heating cooling is promoted by allowing the part to cool in air. This would result in a finer structure and higher strength levels than those attained in an annealed part.
75
76 Hardening When plain carbon steel is quenched from its austenitic range the normal transformation to pearlite is not possible due to the low temperature and small time allowed for transformation. It is not also possible to freeze the austenitic structure due to the fast transformation rates involved in steels.
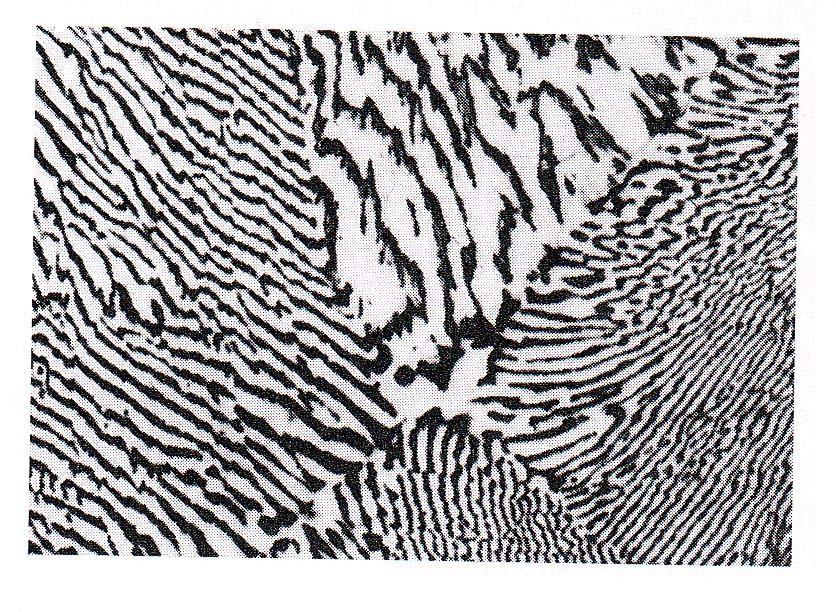
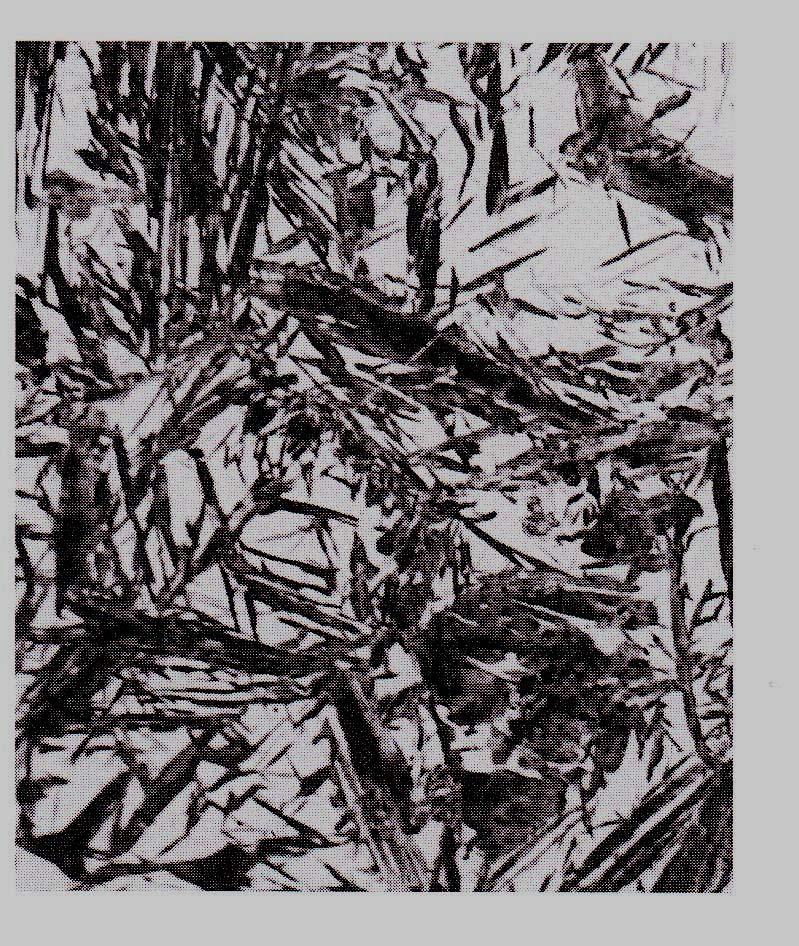
77 Water quenching of a steel containing sufficient carbon produces an extremely hard structure called martensite. Martensite appears under the microscope as a mass of uniform needle shaped crystals,
78
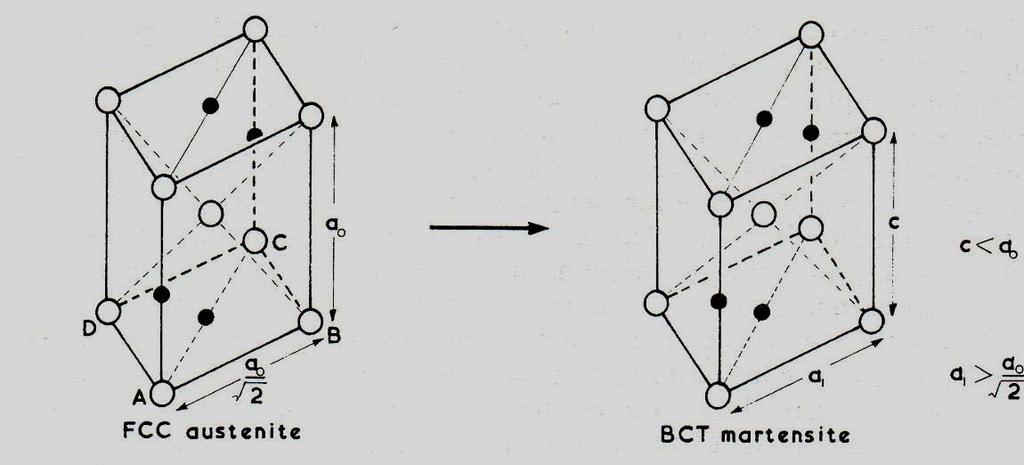
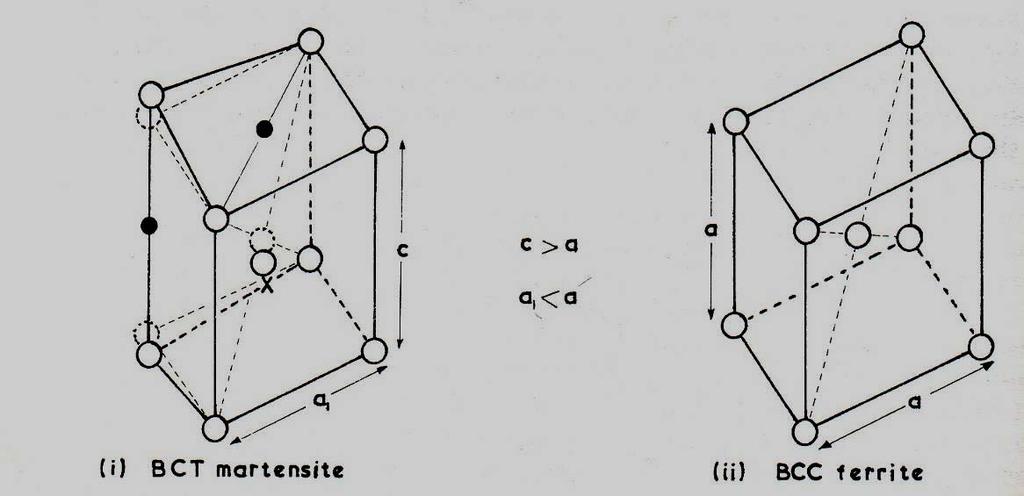
79 The lattice changes from that of FCC to one approaching the BCC. The BCC however can accommodate no more than 0.06 % carbon at room temperature. This is expected to cause considerable distortion.
80 In fact martensite has a distorted bodycentered-tetragonal (BCT) one which is between the FCC and BCC. This distortion is perhaps one reason for this increased hardness.
81
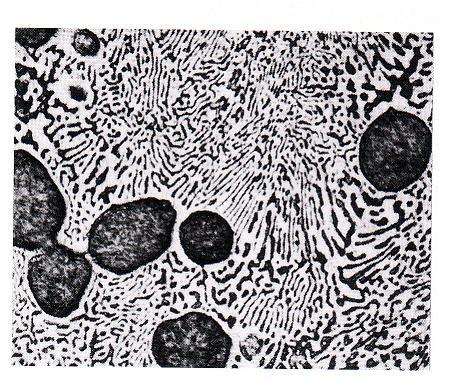
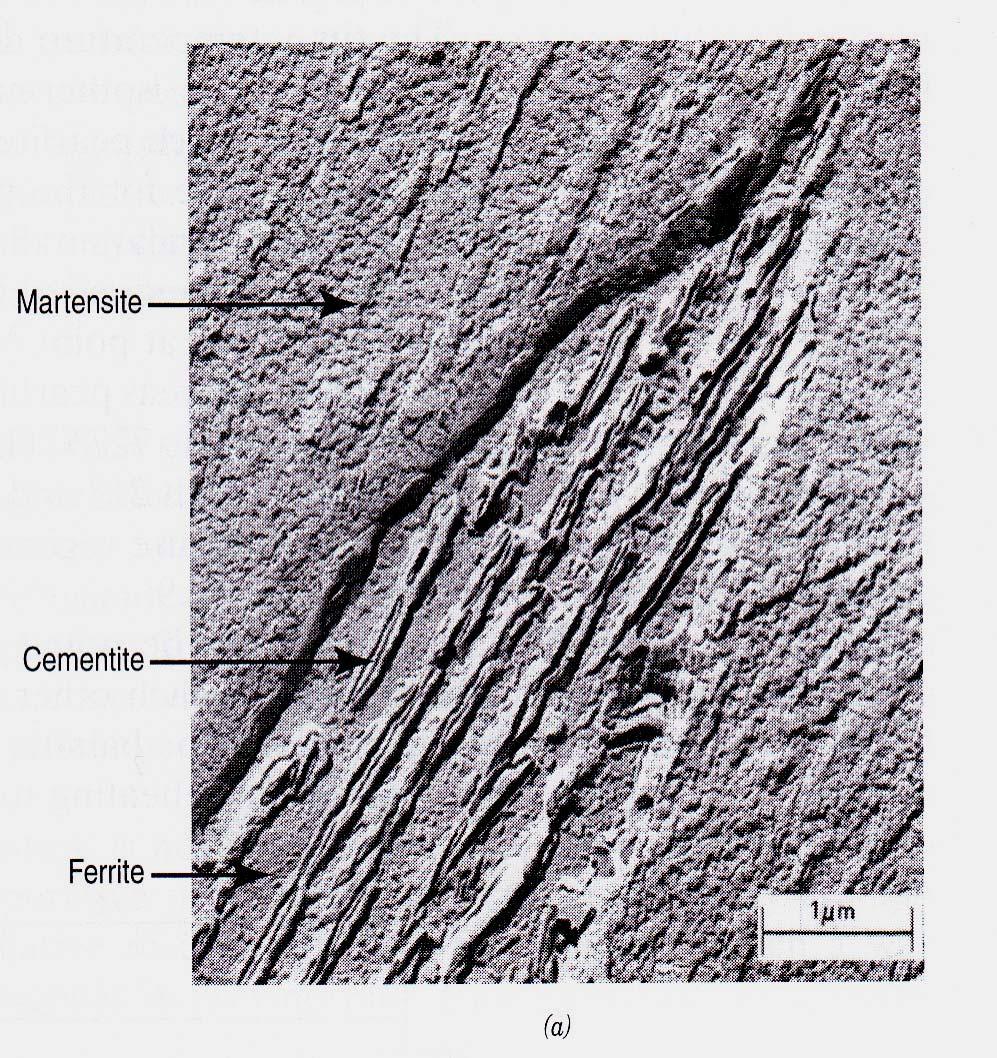
82 Less severe quenching produces a structure known as Bainite. This phase appears under the microscope of magnifications around X 100 as black patches, but at higher magnifications of X 1000 appears as laminated structure something like pearlite.
83 The growth of Bainite differs from that of pearlite in that ferrite nucleates first followed by carbide, whereas in pearlite the carbide nucleates first.
84
85
86 Quenching media The quenching medium is chosen according to the desired cooling rate. The following list is arranged in order of quenching speeds (high to low): 5 % caustic soda 5 20 % Brine Cold water Warm water Mineral oil Animal oil Vegetable oil
87 Tempering Tempering is referred to re-heating of quenched steel parts in order to relieve stresses set up by quenching and reduce brittleness introduced by the extreme hardness values
88 It is always carried out below the lower critical temperature Properties attained depend on the highest temperature reached. Thus the temperature to which a part should be heated must be chosen according to the required properties.

89
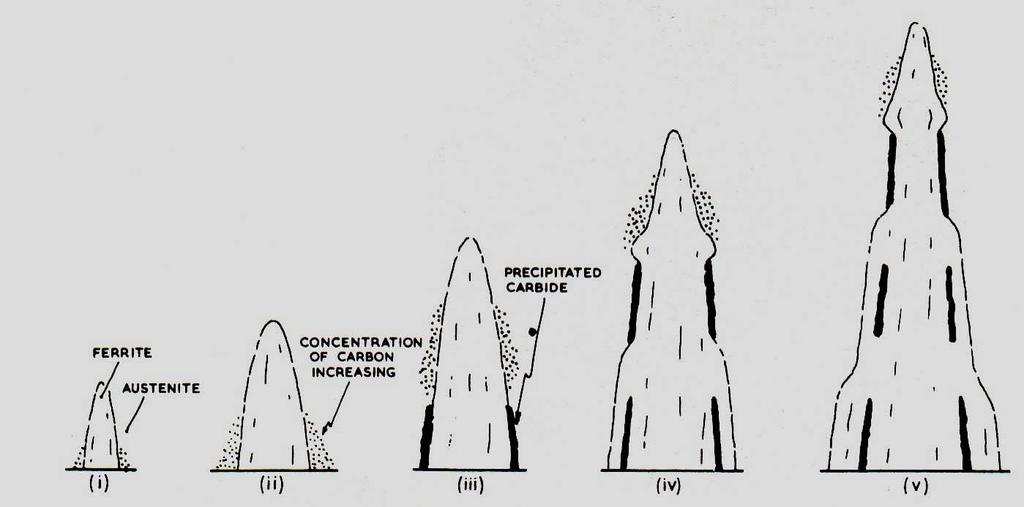
90 Structural changes during tempering The structural changes which occur during the tempering of martensite containing more than 0.3 % carbon takes place in three stages:
91 First stage: At about 100 ºC the existing martensite transform to another type of martensite containing only 0.25 % carbon. This is accompanied with the precipitation of very fine particles of ε-type carbide (Fe 5 C 2 ).
92 At this stage slight increase in strength and hardness may occur due to the dispersion of fine but hard carbides but brittleness is significantly lowered as quenching stresses disappear in consequence of transformation. The rate of transformation is speeded up around 200 ºC
93 Second stage begins at about 250 ºC Any retained austenite begins to transform to Bainite. A further increase in hardness may result due to the replacement of austenite by the much harder Bainite.
94 Third stage At about 350 ºC ε-carbide starts to transform to ordinary cementite and this continues as the temperature rises. In the meantime the remainder of the carbon begins to precipitate from the martensite also as cementite- and in consequence (of freeing carbon) martensite reverts back to its equilibrium form of BCC ferrite.
Chapter 9 Heat treatment (This chapter covers selective sections in Callister Chap. 9, 10 &11)
") Chapter 9 Heat treatment (This chapter covers selective sections in Callister Chap. 9, 10 &11) Study theme outcomes: After studying this chapter, students should or should be able to: - know and understand
Chapter 9 Heat treatment (This chapter covers selective sections in Callister Chap. 9, 10 &11) Study theme outcomes: After studying this chapter, students should or should be able to: - know and understand
Chapter 9 Phase Diagrams. Dr. Feras Fraige
 Chapter 9 Phase Diagrams Dr. Feras Fraige Chapter Outline Definitions and basic concepts Phases and microstructure Binary isomorphous systems (complete solid solubility) Binary eutectic systems (limited
Cu/Ag Eutectic System
 Eutectic Systems The simplest kind of system with two solid phases is called a eutectic system. A eutectic system contains two solid phases at low temperature. These phases may have different crystal structures,
PHASE DIAGRAMS. IE-114 Materials Science and General Chemistry Lecture-10
 PHASE DIAGRAMS IE-114 Materials Science and General Chemistry Lecture-10 Importance of Phase Diagrams There is a strong correlation between microstructure and mechanical properties. Phase diagrams provides
In their simplest form, steels are alloys of Iron (Fe) and Carbon (C).
 and Carbon (C).") Iron-Carbon Phase Diagram Its defined as:- A map of the temperature at which different phase changes occur on very slow heating and cooling in relation to Carbon content. is Isothermal and continuous cooling
Iron-Carbon Phase Diagram Its defined as:- A map of the temperature at which different phase changes occur on very slow heating and cooling in relation to Carbon content. is Isothermal and continuous cooling
CHAPTER 9: PHASE DIAGRAMS
 CHAPTER 9: PHASE DIAGRAMS ISSUES TO ADDRESS... When we combine two elements... what equilibrium state do we get? In particular, if we specify... --a composition (e.g., wt%cu - wt%ni), and --a temperature
Introduction to Heat Treatment. Introduction
 MME444 Heat Treatment Sessional Week 01 Introduction to Heat Treatment Prof. A.K.M.B. Rashid Department of MME BUET, Dhaka Introduction Can you control the microstructure that formed during cooling of
Engineering Materials
 Engineering Materials Heat Treatments of Ferrous Alloys Annealing Processes The term annealing refers to a heat treatment in which a material is exposed to an elevated temperature for an extended time
In their simplest form, steels are alloys of Iron (Fe) and Carbon (C). The Fe-C phase diagram is a fairly complex one, but we will only consider the
 and Carbon (C). The Fe-C phase diagram is a fairly complex one, but we will only consider the") In their simplest form, steels are alloys of Iron (Fe) and Carbon (C). The Fe-C phase diagram is a fairly complex one, but we will only consider the steel part of the diagram, up to around 7% Carbon. Fe-Carbon
In their simplest form, steels are alloys of Iron (Fe) and Carbon (C). The Fe-C phase diagram is a fairly complex one, but we will only consider the steel part of the diagram, up to around 7% Carbon. Fe-Carbon
Phase Diagrams. Phases
 Phase Diagrams Reading: Callister Ch. 10 What is a phase? What is the equilibrium i state t when different elements are mixed? What phase diagrams tell us. How phases evolve with temperature and composition
Material Properties and Phase Diagrams
 PY2M20 Material Properties and Phase Diagrams Lecture 6 P. Stamenov, PhD School of Physics, TCD PY2M20-6 Microstructures in Eutectic ti Systems: I C o < 2 wt% Sn Result: - at extreme ends - polycrystal
Chapter 10. Phase Diagrams
 Chapter 10 Phase Diagrams Chapter 10 Terminology and Unary System Phase Diagrams Issues to Address... When we combine two elements... what equilibrium state do we get? In particular, if we specify... --a
Phase Diagrams of Pure Substances Predicts the stable phase as a function of P total and T. Example: water can exist in solid, liquid and vapor
 PHASE DIAGRAMS Phase a chemically and structurally homogenous region of a material. Region of uniform physical and chemical characteristics. Phase boundaries separate two distinct phases. A single phase
Heat Treatment of Steels
 Heat Treatment of Steels Heat Treating is the process of heating and cooling a steel to obtain desired properties. Various types of heat treatment processes are used to change the following properties
Heat Treating Basics-Steels
 Heat Treating Basics-Steels Semih Genculu, P.E. Steel is the most important engineering material as it combines strength, ease of fabrication, and a wide range of properties along with relatively low cost.
Fe-Fe 3 C phase diagram is given on the last page of the exam. Multiple choices (2.5 points each):
:") Materials Science and Engineering Department MSE 200, Exam #3 ID number First letter of your last name: Name: No notes, books, or information stored in calculator memories may be used. Cheating will be
Materials Science and Engineering Department MSE 200, Exam #3 ID number First letter of your last name: Name: No notes, books, or information stored in calculator memories may be used. Cheating will be
The Iron Iron Carbide (Fe Fe 3 C) Phase Diagram
 Phase Diagram") The Iron Iron Carbide (Fe Fe 3 C) Phase Diagram Steels: alloys of Iron (Fe) and Carbon (C). Fe-C phase diagram is complex. Will only consider the steel part of the diagram, up to around 7% Carbon. University
The Iron Iron Carbide (Fe Fe 3 C) Phase Diagram Steels: alloys of Iron (Fe) and Carbon (C). Fe-C phase diagram is complex. Will only consider the steel part of the diagram, up to around 7% Carbon. University
Heat Treatment of Steels
 Heat Treatment of Steels Heat Treating is the process of heating and cooling a steel to obtain desired properties. Various types of heat treatment processes are used to change the following properties
Metallic Materials-Phase Diagrams
 Engineering Alloys Metals and alloys have many useful engineering properties and so have wide spread application in engineering designs. Iron and its alloys (principally steel) account for about 90 percent
Phase change processes for material property manipulation BY PROF.A.CHANDRASHEKHAR
 Phase change processes for material property manipulation BY PROF.A.CHANDRASHEKHAR Introduction The phase of a material is defined as a chemically and structurally homogeneous state of material. Any material
J = D C A C B x A x B + D C A C. = x A kg /m 2
 1. (a) Compare interstitial and vacancy atomic mechanisms for diffusion. (b) Cite two reasons why interstitial diffusion is normally more rapid than vacancy diffusion. (a) With vacancy diffusion, atomic
Phase Transformations in Metals Tuesday, December 24, 2013 Dr. Mohammad Suliman Abuhaiba, PE 1
 Ferrite - BCC Martensite - BCT Fe 3 C (cementite)- orthorhombic Austenite - FCC Chapter 10 Phase Transformations in Metals Tuesday, December 24, 2013 Dr. Mohammad Suliman Abuhaiba, PE 1 Why do we study
PHASE EQUILIBRIUM P + F = C + 2
 PHASE EQUILIBRIUM Component: is either pure metal and/or compound of which an alloy is composed. They refer to the independent chemical species that comprise the system. Solid Solution: It consists of
Copyright The McGraw-Hill Companies, Inc. Permission required for reproduction or display. Phase Diagram
 SE104 Structural Materials Phase Diagram Dr. Yu Qiao Department of Structural Engineering, UCSD Introduction Phase: A region in a material that differs in structure and function from other regions. Phase
CHAPTER9. Phase Diagrams Equilibrium Microstructural Development
 CHAPTER9 Phase Diagrams Equilibrium Microstructural Development The microstructure of a slowly cooled eutectic soft solder ( 38 wt%pb wt % Sn) consists of a lamellar structure of tin-rich solid solution
12/3/ :12 PM. Chapter 9. Phase Diagrams. Dr. Mohammad Abuhaiba, PE
 Chapter 9 Phase Diagrams 1 2 Learning Objectives 1. Isomorphous and eutectic phase diagrams: a. label various phase regions b. Label liquidus, solidus, and solvus lines 2. Given a binary phase diagram
Binary Phase Diagrams - II
 Binary Phase Diagrams - II Note the alternating one phase / two phase pattern at any given temperature Binary Phase Diagrams - Cu-Al Can you spot the eutectoids? The peritectic points? How many eutectic
Alloys & Their Phase Diagrams. مرجع علمى مهندسى مواد
 Alloys & Their Phase Diagrams Objectives of the class Gibbs phase rule Introduction to phase diagram Practice phase diagram Lever rule Important Observation: One question in the midterm Gibbs phase rule
ENGINEERING COUNCIL CERTIFICATE LEVEL ENGINEERING MATERIALS C102 TUTORIAL 3 THERMAL EQUILIBRIUM (PHASE) DIAGRAMS
 DIAGRAMS") ENGINEERING COUNCIL CERTIFICATE LEVEL ENGINEERING MATERIALS C102 TUTORIAL 3 THERMAL EQUILIBRIUM (PHASE) DIAGRAMS UNIT OUTCOMES On successful completion of the unit the candidate will be able to: 1. Recognise
ENGINEERING COUNCIL CERTIFICATE LEVEL ENGINEERING MATERIALS C102 TUTORIAL 3 THERMAL EQUILIBRIUM (PHASE) DIAGRAMS UNIT OUTCOMES On successful completion of the unit the candidate will be able to: 1. Recognise
Chapter 9: Phase Diagrams
 Chapter 9: Phase Diagrams When we combine two elements... what equilibrium state do we get? In particular, if we specify... --a composition (e.g., wt% Cu - wt% Ni), and --a temperature (T ) then... How
Metallurgy in Production
 In the Name of Allah University of Hormozgan Metallurgy in Production First semester 95-96 Mohammad Ali Mirzai 1 Chapter 6 : the iron carbon phase diagram 2 The Iron-Carbon Alloy Classification 3 The Iron-Carbon
Cu-Ag phase diagram Brazil s map
 Phase Diagrams [9] Cu-Ag phase diagram Brazil s map 1> Some important definitions Component - chemically recognizable species (Fe and C in carbon steel, H2O and NaCl in salted water). A binary alloy contains
EXPERIMENT 6 HEAT TREATMENT OF STEEL
 EXPERIMENT 6 HEAT TREATMENT OF STEEL Purpose The purposes of this experiment are to: Investigate the processes of heat treating of steel Study hardness testing and its limits Examine microstructures of
Iron Carbon Equilibrium Diagrams
 Allotropic Iron, when cooling from a high temperature, displays two special points known as arrest points or critical points. These change points occur at 1390 o C and 910 o C. Above 1390 o C Iron exists
Heat Treatment of Steels : Metallurgical Principle
 Heat Treatment of Steels : Metallurgical Principle Outlines: Fe ad Fe-Fe 3 C system Phases and Microstructure Fe-Fe 3 C Phase Diaram General Physical and Mechanical Properties of each Microstructure Usanee
Phase diagrams (cont.) and the Fe-C system
 and the Fe-C system") Phase diagrams (cont.) and the Fe-C system Solidification: Pro-eutectic vs Eutectic Pro-eutectic solidification Ideal liquid, uniform distribution Solid Pb(Sn) () nucleates Solubility limit leads to Sn
Phase diagrams (cont.) and the Fe-C system Solidification: Pro-eutectic vs Eutectic Pro-eutectic solidification Ideal liquid, uniform distribution Solid Pb(Sn) () nucleates Solubility limit leads to Sn
CHAPTER 9 PHASE DIAGRAMS PROBLEM SOLUTIONS
 CHAPTER 9 PHASE DIAGRAMS PROBLEM SOLUTIONS 9.17 A 90 wt% Ag-10 wt% Cu alloy is heated to a temperature within the β + liquid phase region. If the composition of the liquid phase is 85 wt% Ag, determine:
Chapter 11: Phase Diagrams
 Chapter 11: Phase Diagrams ISSUES TO ADDRESS... When we combine two elements... what is the resulting equilibrium state? In particular, if we specify... -- the composition (e.g., wt% Cu - wt% Ni), and
MSE-226 Engineering Materials
 MSE-226 Engineering Materials Lecture-2 IRON-IRON CARBIDE PHASE DIAGRAM Classification of Metal Alloys Metal Alloys Ferrous Nonferrous Steels
Chapter 10: Phase Transformations
 Chapter 10: Phase Transformations ISSUES TO ADDRESS... Transforming one phase into another takes time. Fe C FCC (Austenite) Eutectoid transformation Fe 3 C (cementite) + (ferrite) (BCC) How does the rate
Phase Diagrams, Solid Solutions, Phase Strengthening, Phase Transformations
 Phase Diagrams, Solid Solutions, Phase Strengthening, Phase Transformations Components and Phases Components: The elements or compounds that are mixed initially (Al and Cu). Phases: A phase is a homogenous,
Kinetics - Heat Treatment
 Kinetics - Heat Treatment Nonequilibrium Cooling All of the discussion up till now has been for slow cooling Many times, this is TOO slow, and unnecessary Nonequilibrium effects Phase changes at T other
Chapter 10: Phase Transformations
 Chapter 10: Phase Transformations ISSUES TO ADDRESS... Transforming one phase into another takes time. Fe (Austenite) Eutectoid transformation Fe 3 C (cementite) + C FCC (ferrite) (BCC) How does the rate
MSE 513 Homework #1 Due Jan. 21, 2013
 Reading: My class notes, pgs. 22-27. http://www1.asminternational.org/asmenterprise/apd/help/help.aspx Introduction to Phase diagrams, particularly: o Common terms o Binary diagrams o Features of phase
APPLICATIONS OF Fe-C PHASE DIAGRAM
 APPLICATIONS OF Fe-C PHASE DIAGRAM KEY POINTS OF Fe-C Diagram Phases: Liquid Fe-Tmin=1148C @ 4.3%C 1394 C
FUNDAMENTALS OF METAL ALLOYS, EQUILIBRIUM DIAGRAMS
 FUNDAMENTALS OF METAL ALLOYS, EQUILIBRIUM DIAGRAMS Chapter 5 5.2 What is a Phase? Phase is a form of material having characteristic structure and properties. More precisely: form of material with identifiable
Why do cocktail ice served in expensive restaurants are clear whereas the ice formed in your refrigerator is cloudy?
 Phase Diagrams Why do cocktail ice served in expensive restaurants are clear whereas the ice formed in your refrigerator is cloudy? What is a solder alloy? What is the best composition for solder? How
Chapter 11: Phase Diagrams. Phase Equilibria: Solubility Limit
 Temperature ( C) Water ugar 217/1/4 Chapter 11: Phase Diagrams IUE TO ADDRE... When we combine two elements... what is the resulting equilibrium state? In particular, if we specify... -- the composition
www-materials.eng.cam.ac.uk/typd
 Part IB Paper 3: MATERIALS Examples Paper 3/1: TEACH YOURSELF PHASE DIAGRAMS This examples paper forms part of an interactive online resource Teach Yourself Phase Diagrams which is available at: www-materials.eng.cam.ac.uk/typd
Gibbs Phase Rule. 1 phase field: F = = 2 Change T and C independently in phase field
 P + F = C + 2 Gibbs Phase Rule P: # of phases F: Degrees of freedom C: # of components Normally, pressure = 1 atm P + F = C + 1 or F = C - P + 1 Apply to eutectic phase diagram 1 phase field: F = 2 1 +
HEAT TREATMENT. Bulk and Surface Treatments Annealing, Normalizing, Hardening, Tempering Hardenability
 Bulk and Surface Treatments Annealing, Normalizing, Hardening, Tempering Hardenability HEAT TREATMENT With focus on Steels Principles of Heat Treatment of Steels Romesh C Sharma New Age International (P)
Binary phase diagrams
 inary phase diagrams inary phase diagrams and ibbs free energy curves inary solutions with unlimited solubility Relative proportion of phases (tie lines and the lever principle) Development of microstructure
MAE 212: Spring 2001 Lecture 14 PHASE DIAGRAMS AND EQUILIBRIUM MICROSTRUCTURES N. Zabaras
 ME 212: Spring 2001 Lecture 14 PHSE DIGRMS ND EQUILIRIUM MICROSTRUCTURES N. Zabaras For more details on the topic read Chapter 9 of the Materials Science for Engineers by J. Shackelford, pp. 304 353. lso
INSTITUTE OF AERONAUTICAL ENGINEERING (Autonomous) Dundigal, Hyderabad
 Dundigal, Hyderabad") INSTITUTE OF AERONAUTICAL ENGINEERING (Autonomous) Dundigal, Hyderabad -500 043 MECHANICAL ENGINEERING TUTORIAL QUESTION BANK Course Name METALLURGY AND MATERIAL SCIENCE Course Code AME005 Class III Semester
INSTITUTE OF AERONAUTICAL ENGINEERING (Autonomous) Dundigal, Hyderabad -500 043 MECHANICAL ENGINEERING TUTORIAL QUESTION BANK Course Name METALLURGY AND MATERIAL SCIENCE Course Code AME005 Class III Semester
ME-371/571 ENGINEERING MATERIALS
 ME-371/571 ENGINEERING MATERIALS Problem Set 2 1. An SAE-AISI 1035 steel alloy is slowly cooled from 950 C to room What is the pro-eutectoid phase, and at what temperature would it first appear? What are
The Solubility Limit
 Phase Diagrams When we combine two elements... what equilibrium state do we get? In particular, if we specify... --a composition (e.g., wt%cu - wt%ni), and --a temperature (T) then... How many phases do
CHAPTER 9 PHASE DIAGRAMS
 CHAPTER 9 PHASE DIAGRAMS PROBLEM SOLUTIONS 9.14 Determine the relative amounts (in terms of mass fractions) of the phases for the alloys and temperatures given in Problem 9.8. 9.8. This problem asks that
MME 291: Lecture 13. Today s Topics. Heat treatment fundamentals Classification of heat treatment Annealing of steels Normalising of steels
 MME 291: Lecture 13 Heat Treatment of Steels #1: Annealing and Normalising Prof. A.K.M.B. Rashid Department of MME BUET, Dhaka Today s Topics Heat treatment fundamentals Classification of heat treatment
ENGR 151: Materials of Engineering LECTURE #15: PHASE DIAGRAMS
 ENGR 151: Materials of Engineering LECTURE #15: PHASE DIAGRAMS TENSILE TESTING VIDEO https://www.youtube.com/watch?v=-qukvzo2jse PROPERTIES OF ISOMORPHOUS ALLOYS Solid solution strengthening For Ni-Cu
MSE-226 Engineering Materials
 MSE-226 Engineering Materials Lecture-4 THERMAL PROCESSING OF METALS-2 CONTINUOUS COOLING TRANSFORMATION (CCT) DIAGRAMS: In industrial heat-treating operations, in most cases a steel is not isothermally
Introduction of Materials Materials Science SScience
 材料科學導論 Introduction of Materials Science 許正興國立聯合大學電機工程學系 1. Introduction of Materials Science and Engineering 2. Atomic Structure and Bonding 3. Crystal Structures and Crystal Geometry 4. Solidification,
Metals are used by industry for either one or combination of the following properties
 Basic Metallurgy Metals are the backbone of the engineering industry being the most important Engineering Materials. In comparison to other engineering materials such as wood, ceramics, fabric and plastics,
Chapter 1. Iron-Carbon AlloysⅠ. /MS371/ Structure and Properties of Engineering Alloys
 Chapter 1 Iron-Carbon AlloysⅠ Iron pure iron : to be obtained through zone refining adding a small amount of C, Mn, P, S 증가 pure iron 의 allotropic forms Allotropic forms Crystallographic form Unit cube
Development of Microstructure in Eutectic Alloys
 CHAPTER 10 PHASE DIAGRAMS PROBLEM SOLUTIONS Development of Microstructure in Eutectic Alloys 10.16 Briefly explain why, upon solidification, an alloy of eutectic composition forms a microstructure consisting
C β = W β = = = C β' W γ = = 0.22
 9-15 9.13 This problem asks us to determine the phases present and their concentrations at several temperatures, as an alloy of composition 52 wt% Zn-48 wt% Cu is cooled. From Figure 9.19: At 1000 C, a
Microstructural effects of phase transformations Marek Faryna
 Microstructural effects of phase transformations Marek Faryna Institute of Metallurgy and Materials Science m.faryna@imim.pl 012 2952828 mobile 697 225 186 Outline Transformation in solids Formal theories
Module 23. Iron Carbon System I. Lecture 23. Iron Carbon System I
 Module 23 Iron Carbon System I ecture 23 Iron Carbon System I 1 NPTE Phase II : IIT Kharagpur : Prof. R. N. Ghosh, Dept of Metallurgical and Materials Engineering Keywords : Ferrite (), Austenite (), Ferrite
MSE2034 (STALEY) Test #3 Review 4/2/06
 Test #3 Review 4/2/06") MSE2034 (STALEY) Test #3 Review 4/2/06 The third test in this course will be a take-home assignment handed out at the end of class Wednesday, April 5, and due by Noon on Friday, April 7. It will be open
MSE2034 (STALEY) Test #3 Review 4/2/06 The third test in this course will be a take-home assignment handed out at the end of class Wednesday, April 5, and due by Noon on Friday, April 7. It will be open
Precipitation Hardening. Outline. Precipitation Hardening. Precipitation Hardening
 Outline Dispersion Strengthening Mechanical Properties of Steel Effect of Pearlite Particles impede dislocations. Things that slow down/hinder/impede dislocation movement will increase, y and TS And also
Lecture 3: Solutions: Activities and. Phase Diagrams
 Lecture 3: Solutions: Activities and Lecture plan: Phase Diagrams 21-09-2010 Gibbs phase rule vapour composition two-component phase diagrams phase diagrams in material science: microstructures in isomorphous
Experiment E: Martensitic Transformations
 Experiment E: Martensitic Transformations Introduction: The purpose of this experiment is to introduce students to a family of phase transformations which occur by shear rather than diffusion. In metals,
Lecture 5: Heat Treatment of Steel
 Lecture 5: Heat Treatment of Steel MMat 380 Lecture outline TTT diagrams (hypo and hyper eutectoid steels) CCT vs TTT diagrams Austenizing Heat Treatments For hypoeutectoid mild steels For hypereutectoid
Short Notes for Engineering Materials
 Crystal Structure of Materials Short Notes for Engineering Materials When metals solidify from molten state, the atoms arrange themselves into various crderly configurations called crystal. There are seven
Modeling Diffusion: Flux
 Modeling Diffusion: Flux Flux (#/area/time): J = 1 A dm dt Directional Quantity y Jy kg atoms m 2 or s m 2 s Jx Jz x z Flux can be measured for: --vacancies and interstitials --host (A) atoms --impurity
Hypoeutectoid Carbon Steels. Hypereutectoid Carbon Steels
 Hypoeutectoid Carbon Steels Another example: Amount of carbon? 1035 Steel: white regions are proeutectoid ferrite grains By the end of this lecture you should be able to predict the amount of carbon in
Binary phase diagrams
 inary phase diagrams inary phase diagrams and ibbs free energy curves inary solutions with unlimited solubility Relative proportion of phases (tie lines and the lever principle) Development of microstructure
TALAT Lecture Phase Diagrams. 14 pages, 13 Figures. Basic Level
 TALAT Lecture 1203 Phase Diagrams 14 pages, 13 Figures Basic Level prepared by M H Jacobs * Interdisciplinary Research Centre in Materials The University of Birmingham, UK (Based on approach adopted by
Chapter 10: Phase Diagrams
 hapter 10: Phase Diagrams Show figures 10-1 and 10-3, and discuss the difference between a component and a phase. A component is a distinct chemical entity, such as u, Ni, NiO or MgO. A phase is a chemically
Material Science. Prof. Satish V. Kailas Associate Professor Dept. of Mechanical Engineering, Indian Institute of Science, Bangalore India
 Material Science Prof. Satish V. Kailas Associate Professor Dept. of Mechanical Engineering, Indian Institute of Science, Bangalore 560012 India Chapter 6. Phase Diagrams Learning objectives: - To understand
14ME406/ME 226. Material science &Metallurgy. Hall Ticket Number: Fourth Semester. II/IV B.Tech (Regular/Supplementary) DEGREE EXAMINATION
 DEGREE EXAMINATION") Hall Ticket Number: 14ME406/ME 226 April, 2017 Fourth Semester Time: Three Hours Answer Question No.1 compulsorily. Answer ONE question from each unit. II/IV B.Tech (Regular/Supplementary) DEGREE EXAMINATION
Hall Ticket Number: 14ME406/ME 226 April, 2017 Fourth Semester Time: Three Hours Answer Question No.1 compulsorily. Answer ONE question from each unit. II/IV B.Tech (Regular/Supplementary) DEGREE EXAMINATION
Each carbon atom causes a tetragonal distortion since the principal
 Ferrous alloys Fig. 1: Iron-carbon equilibrium phase diagram martensite start temperature or M S. The fraction of martensite increases with the undercooling below M S. The martensite in steels is supersaturated
BFF1113 Engineering Materials DR. NOOR MAZNI ISMAIL FACULTY OF MANUFACTURING ENGINEERING
 BFF1113 Engineering Materials DR. NOOR MAZNI ISMAIL FACULTY OF MANUFACTURING ENGINEERING Course Guidelines: 1. Introduction to Engineering Materials 2. Bonding and Properties 3. Crystal Structures & Properties
Part IV : Solid-Solid Phase Transformations I Module 3. Eutectoid transformations
 Part IV : Solid-Solid Phase Transformations I Module 3. Eutectoid transformations 3 Eutectoid transformations 3.1 Motivation What are the different microstructural features due to the eutectoid transformation
ME 254 MATERIALS ENGINEERING 1 st Semester 1431/ rd Mid-Term Exam (1 hr)
") 1 st Semester 1431/1432 3 rd Mid-Term Exam (1 hr) Question 1 a) Answer the following: 1. Do all metals have the same slip system? Why or why not? 2. For each of edge, screw and mixed dislocations, cite
1 st Semester 1431/1432 3 rd Mid-Term Exam (1 hr) Question 1 a) Answer the following: 1. Do all metals have the same slip system? Why or why not? 2. For each of edge, screw and mixed dislocations, cite
The Concept Of Weldability Of Metals
 The Concept Of Weldability Of Metals This chapter presents the concept of weldability of metals and factors affecting the same. Different parameters that are used as a measure of weldability have been
Module 31. Heat treatment of steel I. Lecture 31. Heat treatment of steel I
 Module 31 Heat treatment of steel I Lecture 31 Heat treatment of steel I 1 Keywords : Transformation characteristics of eutectoid steel, isothermal diagram, microstructures of pearlite, bainite and martensite,
Equilibrium phase diagram of metallic alloy
 Equilibrium phase diagram of metallic alloy Motivation New structure, concentration (mixing level) (at what temperature? for how long? ) Phase Diagrams - Introduction. Many materials systems can exist
Phase diagrams are diagrammatic representations of the phases present in a
 Chapter 4 What is a binary phase diagram? Phase diagrams are diagrammatic representations of the phases present in a system under specified equilibrium conditions, most often composition, temperature and
ISSUES TO ADDRESS...
 Chapter 11: Phase Transformations School of Mechanical Engineering Choi, Hae-Jin Materials Science - Prof. Choi, Hae-Jin 1 ISSUES TO DDRESS... Transforming one phase into another takes time. Fe C FCC Eutectoid
Tutorial 2 : Crystalline Solid, Solidification, Crystal Defect and Diffusion
 Tutorial 1 : Introduction and Atomic Bonding 1. Explain the difference between ionic and metallic bonding between atoms in engineering materials. 2. Show that the atomic packing factor for Face Centred
Department of Mechanical Engineering University of Saskatchewan. ME324.3 Engineering Materials. Mid-Term Examination (Closed Book)
") Student #: Department of Mechanical Engineering University of Saskatchewan ME. Engineering Materials Mid-Term Examination (Closed Book) Instructor: I. Oguocha Time Allowed: h Friday, 9 October 00. Section
Student #: Department of Mechanical Engineering University of Saskatchewan ME. Engineering Materials Mid-Term Examination (Closed Book) Instructor: I. Oguocha Time Allowed: h Friday, 9 October 00. Section
Introduction to the phase diagram Uses and limitations of phase diagrams Classification of phase diagrams Construction of phase diagrams
 Prof. A.K.M.B. Rashid Department of MME BUET, Dhaka Concept of alloying Classification of alloys Introduction to the phase diagram Uses and limitations of phase diagrams Classification of phase diagrams
Phase Diagrams & Phase Tranformation
 ep-16 Phase Diagrams & Phase Tranformation Microstructure - Phases Ferrite Cementite EM micrograph x magnification Plain C steel containing.44 wt. % C Basic Definitions Alloy: A metallic substance that
ENGR 151: Materials of Engineering LECTURE #14: PHASE DIAGRAMS
 ENGR 151: Materials of Engineering LECTURE #14: PHASE DIAGRAMS ANNOUNCEMENTS Midterm #2 Monday, May 1. Review on Wednesday, April 26. Chapters 4, 6, 7, 8 TERMINOLOGY Phase: Homogeneous portion of a system
UNIT-II PART- A Heat treatment Annealing annealing temperature Normalizing.
 UNIT-II PART- A 1. What is "critical cooling rate" in hardening of steels? This critical cooling rate, when included on the continuous transformation diagram, will just miss the nose at which the pearlite
Heat Treatment of Steel Lab Report. Justin Lance 11/16/2011 Engineering 45 Lab Section 3 Troy Topping
 Heat Treatment of Steel Lab Report Justin Lance justalance@gmail.com 11/16/2011 Engineering 45 Lab Section 3 Troy Topping troytopping@gmail.com ABSTRACT We observed how the properties of 4140 steel vary
Metallurgy in Production
 In the Name of Allah University of Hormozgan Metallurgy in Production First semester 95-96 Mohammad Ali Mirzai 1 Chapter 7 - Part 1: Heat Treatment of Steels 2 The kinds of treatments for improve properties
MT 348 Outline No MECHANICAL PROPERTIES
 MT 348 Outline No. 1 2009 MECHANICAL PROPERTIES I. Introduction A. Stresses and Strains, Normal and Shear Loading B. Elastic Behavior II. Stresses and Metal Failure A. ʺPrincipal Stressʺ Concept B. Plastic
CHAPTER10. Kinetics Heat Treatment
 CHAPTER10 Kinetics Heat Treatment The microstructure of a rapidly cooled eutectic soft solder ( 38 wt%pb 62 wt % Sn) consists of globules of lead-rich solid solution (dark) in a matrix of tin-rich solid
Thermal Equilibrium Diagrams. Equilibrium Diagrams
 A Carty Thermal Equilibrium Diagrams Equilibrium Diagrams When a pure metal solidifies it changes from a liquid to a solid state. An intermediate state of liquid and solid exists (sometimes known as the