Characterisation and photoelectrochemical properties of titania nanotubes
|
|
|
- Gwen Johnson
- 5 years ago
- Views:
Transcription


1 Characterisation and photoelectrochemical properties of titania nanotubes G. Dale; J. Hamilton; P. Dunlop, T. Byrne Nanotechnology and Integrated BioEngineering Centre (NIBEC), University of Ulster at Jordanstown, Shore Road, Newtownabbey, Northern Ireland, UK, BT37 0QB
2 Overview of presentation Background to the study Aims and Objectives Experimental Results and Discussion Summary
3 Photoelectrochemistry - i ph ε C n-sc - S hν - ε F(SC) ε F(M) ε F (O 2 /H 2 O) ε V + Diagram adopted from Sato (1998)
4 Titanium Dioxide Fujishima & Honda (1972) reported photo-splitting of water using n-type single crystal rutile under UV irradiation. Titanium dioxide is reported to be a good photocatalyst, it is photostable, chemically stable, insoluble in water, readily available and non-toxic. The wide bandgap energy gives a large potential window for redox reactions, however, it means UV activation. Zwilling et al(1999) first reported the formation of self organised titania nano-stuctures following anodisation of Ti in F containing electrolyte. Fujishima, Honda. Nature 1972, 238, 37. Zwilling, Aucouturier, Darque-Ceretti, Electrochimica Acta 45 (1999)
5 Proposed growth mechanism oxide metal Adapted from: J. Zhao et al, Solid State Communications 134 (2005)
6 oxide metal
7 oxide metal
8 void pore oxide metal
9 void Tube
10 Aim of this work To examine the growth of titania nanotubes by the anodisation of Ti metal in the presence of fluoride and to determine the current-potential response under illumination and the photocatalytic properties. Objectives Anodise Ti metal in the presence and absence of fluoride Characterise using surface analytical methods Determine the current-potential response of the electrodes under illumination Determine the photocatalytic properties of the material
11 Experimental
12 Electrochemical cell for anodisation
13 Compact oxide layer Electrolyte: 1 M H 2 SO 4 Anode: Titanium foil diameter of 10 mm (0.785 cm 2 ) Cathode: Pt foil diameter 20 mm Potential applied: constant 20 V dc Time: 30 min Current: starts around 18 ma and drops to approx 6 ma Anneal: 450 o C in air for 1 h (ramp 5 o C min -1 up and down)
14 Titania nanotubes Electrolyte: 1 M Na 2 SO M NaF Anode: Titanium foil diameter of 10 mm (0.785 cm 2 ) Cathode: Platinum foil diameter 20 mm Potential applied: Constant 20 V dc Time: 4 h Current: starts at 20 ma and drops to steady 1 ma Anneal temp: Range temperatures C C in air for 1 h (ramp 5 0 C min -1 up and down) Macak, J; Sirotna, K; Schumki, P. Electrochemica Actu, (2005), v 50, 18, pp


15 SEM FEI Quanta 200: tungsten filament electron source, accelerating voltage 20 kv, 42 pa current, spot size 2.5, chamber pressure 1.6 x 10⁻⁶ Torr. XRD Glazing incidence X-ray diffraction was used to determine the crystalline phase of the TiO 2 both before and after annealing using glazing incidence XRD (Bruker D8 Discover X-ray Diffractometer, source fixed at 0.75 degree).
16 Photoelectrochemistry One compartment cell with quartz window Pt paddle CE and SCE RE Electrolyte: 0.1 M NaClO 4 (air sparged, ph 4.5) Illumination source 1 kw Xe with AM1.0 filter for solar simulation Light intensity measured using Jobin Yvvon spectral radiometer Potentiostatic control using PG30 Autolab
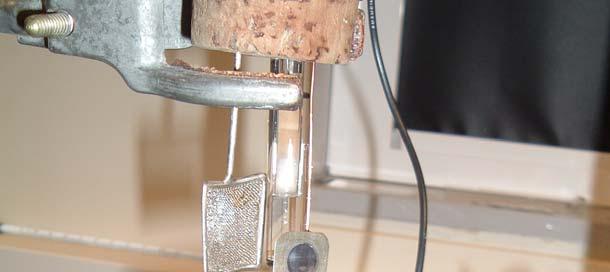
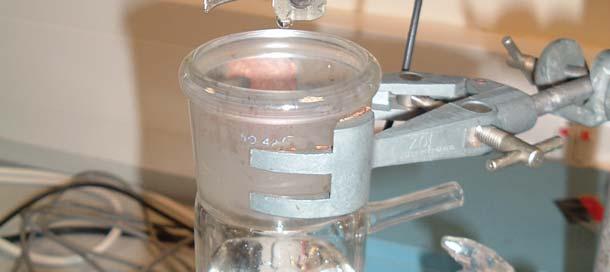
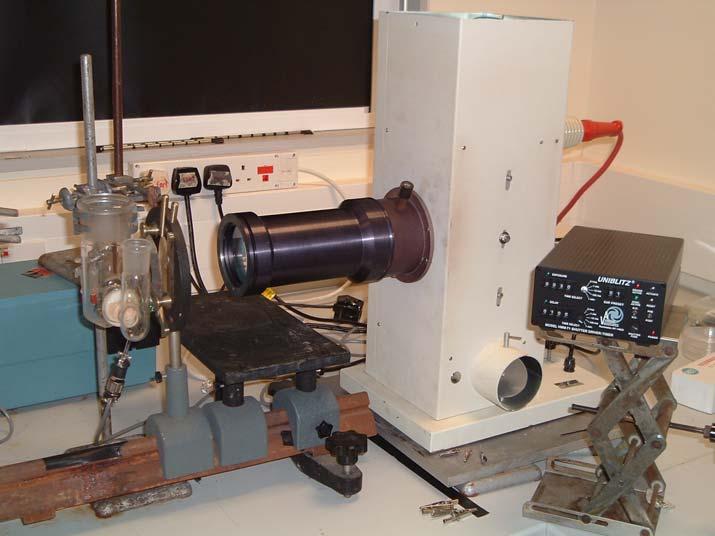
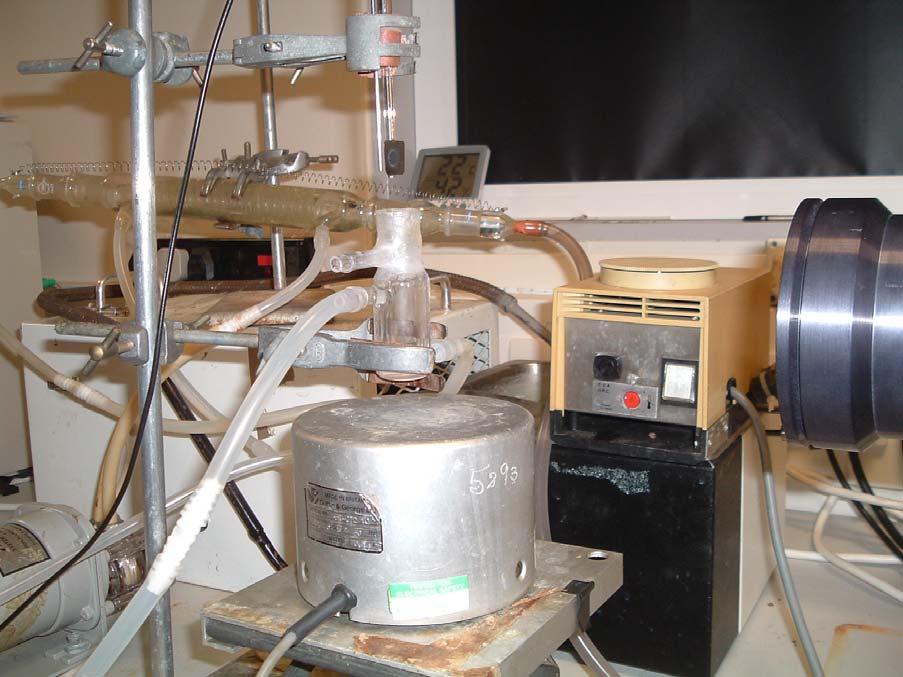
17 Photo-cell set-up
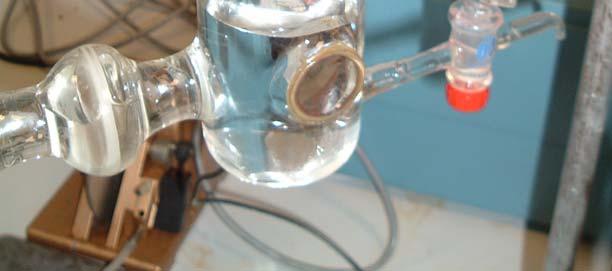
18 Photocatalytic properties Model pollutants were formic acid and phenol Illumination was provided by 1 kw xenon with AM1.0 filter Cell volume was 10 cm -3 Experiments were undertaken at open circuit and with applied bias. Concentration of formic acid was determined by ion exclusion HPLC Concentration of phenol was determined by reverse phase HPLC
19 Photocatalytic Setup.
20 Results and Discussion

21 SEM of self organised titania nanotubes (Top View) 500 nm 300 nm Uniform growth of aligned titania nanotubes Circular structures with mean internal diameter ca. 90 nm and wall thickness ca. 10 nm
 500 nm 400 nm")

22 SEM of nanotubes mechanically cracked from support (Side View) 500 nm 400 nm Mechanically cracked sample reveals length ca. 550 nm Note periodic ring structure along length

23 SEM of nanotubes mechanically cracked from support (Bottom View) Bottom view of mechanically cracked sample reveals tubes are capped by compact oxide layer which appears as the negative image of pore shape
24 TUBE DIAMETER VS POTENTIAL Internal diameter (nm) NT diameters Linear (NT diameters) Potential (V)


25 AFM AFM : Tapping mode AFM : Tapping mode
26 Photoelectrochemical Characterisation Linear sweep voltammetry provides a fast and effective means of evaluating the photoelectrochemical properties of electrode materials + i 0- i i + ph E E fb n-type response
27 LSV for Compact oxide in dark 6.00E E-03 CO dark 4.00E-03 J (A cm -2 ) 3.00E E E E E-03 Potential (V)
28 6.00E E-03 CO Dark CO as prepared Light 4.00E-03 J (A cm -2 ) 3.00E E E E E-03 Potential (V)
29 6.00E E-03 CO dark CO as-prepared Light CO Annealed Light 4.00E-03 J (A cm -2 ) 3.00E E E E E-03 Potential (V)
30 XRD analysis of compact oxide film pre- and post- anneal * Anatase Rutile Intensity (counts) * * * Annealed Theta
31 6.00E E-03 CO dark CO as-prepared Light CO Annealed Light as-prepared Light 4.00E-03 J (A cm -2 ) 3.00E E E E E-03 Potential (V)
32 6.00E E-03 J (A cm -2 ) 4.00E E E-03 CO dark CO as-prepared Light CO anealed Light as-prepared Light annealed Light 1.00E E E-03 Potential (V)
33 XRD analysis of nanotubes pre- and post- anneal Dot: Anatase Star: Rutile Intensity * * * Annealed at 450 o C Theta
34 6.00E-03 CO dark CO as-prepared Light CO annealed Light as-prepared Light annealed Light Degussa P E E-03 J (A cm -2 ) 3.00E E E E E-03 Potential (V)
35 XRD DATA VS ANNEAL TEMP Annealing Temperature ( 0 C) Ratio Anatase / Anatase Rutile Rutile
36 J (A cm -2 ) dark nts250 nts350 nts450 nts550 nts650 nts E E E E E E E E-03 Potential (V)
37 Photocatalytic degradation of pollutants (Formic Acid + Phenol)
38 Formic acid (mm) Not Ann OC Not Ann 1V Not Ann 2V Time(mins)
39 Formic Acid (mm) Not Ann Open Circuit Not Ann 1V Not Ann 2V Ann 0V Ann 1V Ann 2V Time (min)
40 11 10 Bias: 2V Rate( x10-2 mm min -1 cm -2 ) Open Circuit Bias: 1V Deg 0V Not Ann 0V CO 0V 0V Deg 1V Not Ann 1V CO 1V 1V Deg 2V Not Ann 2V CO 2V 2V
41 V 750 2V 750 1V 650 1V 650 0V 650 2V 550 1V 550 0V 550 2V 450 2V 450 1V 450 0V 350 2V 350 1V 350 0V Rate (x10-2 mm min -1 cm -2 )
42 Photocatalytic degradation of phenol Not Ann Open Circuit Not Ann 1V Not Ann 2V -1.5 Ln ( C/C0 ) Time (mins)
43 Ln ( C/C0 ) Not Ann Open Circuit Not Ann 1V Not Ann 2V Ann Open Circuit Ann 1V Ann 2V Time (mins)
44 Phenol Rate ( x10-2 min -1 cm -2 ) 4 3 Open Circuit Bias: 1V Bias: 2V Deg 0V Not Ann 0V CO 0V Ann 0V Deg 1V Not Ann 1V CO 1V Ann 1V Deg 2V Not Ann 2V CO 2V Ann 2V
45 7 6 5 Rate (x10-2 min -1 cm -2 ) V 350 1V 350 0V 450 2V 450 1V 450 0V 550 2V 550 1V 550 0V 650 2V 650 1V 650 0V 750 2V 750 1V 750 0V
46 Electron Transport Figure: Visual representation of electron transport in (a) degussa P25 film and (b) nanotubes De Jongh & Vanmaekelbergh, Physical review letters, v77, 1996,
47 Summary Self-organised titania nanotube arrays can be produced by anodising Ti metal in the presence of fluoride. The as-prepared are amorphous and have a relatively poor photoelectrochemical response Annealing the results in a dramatically improved photocurrent response Annealed show better photocatalytic efficiency when compared to P25 films under applied bias
48 Acknowledgements Dept of Employment and Learning Northern Ireland Technical staff of SE, University of Ulster Degussa for supplying free sample of P25