MECHANICAL PROPERTIES.
|
|
|
- Reynard Parrish
- 5 years ago
- Views:
Transcription
1 MECHANICAL PROPERTIES. Hardness, strength, ductility and elasticity are among the mechanical properties of a material that would probably first come to mind. In order to know how each of these characteristics is put to use, it will be necessary first to define a few common engineering terms. Stress is defined as the force per unit of area, and is expressed as pounds per square inch (psi) or in the metric system, in kilograms per square centimeter (kg/cm2) or some other convenient metric form of force per unit area. Whereas a load is an external force, stress is an internal force per unit of area. Strain is the deformation of a material caused by stress, and is expressed as the number of inches of deformation per inch of original length, or as a percentage of the initial length. Strain may be elastic or plastic. Elastic strain is reversible deformation; it disappears after the stress is removed. With most wrought metals the magnitude of elastic strain is nearly proportional to the stress that is applied, and this is shown in the partial stress-strain diagram of Fig It will be found that the ratio of stress to strain is a constant for a given material when the applied stress is such that the strain is elastic. This ratio of stress to strain is called the modulus of elasticity or Young s modulus. The units of Young s modulus are psi, since the fraction is pounds per square inch divided by inches per inch. It is a measure of the relative stiffness of a material. The proportionality between stress and strain holds true only up to the proportional limit (or elastic limit 1 ). At stresses above the elastic limit, plastic strain takes place. The portion of the strain that is nonelastic, i.e., non-recoverable, is the plastic strain. In Fig. 2-2 if a material were subject to increasing stress starting at point O, then point A would be the pro- portional limit, and if the loading were reduced starting at point B, distance OC would represent the plastic strain. 1. It is possible for the elastic limit to be slightly higher than the proportional limit, but for our purposes the two will be considered as being the same.
2

3 The amount of plastic strain that has occurred at the breaking stress is called elongation and is ordinarily expressed as a percentage, stating the gage length over which it is measured. In addition to elongation as a measure of ductility, the reduction in area at the point of fracture is used principally in large size structural materials. Possibly because of the small dimensions of most noble alloy shapes, the reduction in area is seldom utilized as a measure of ductility and percent elongation is used almost exclusively. Ultimate tensile strength is by custom the value obtained by dividing the highest load reached before breakage by the original cross-section area. Methods of Tensile Tests. The important properties of ultimate tensile strength, proportional limit and elongation are determined by subjecting a specimen (usually round or rectangular in cross-section) to an axial load tending to stretch the piece and increasing this axial load until fracture occurs. When the applied stress is plotted against the resulting strain, the properties of the specimen are revealed. Elongation is frequently determined by piecing together the broken specimen and measuring the distance between gage marks; which were placed on the piece before stress was applied. Graphical methods similar to that showing plastic deformation in Fig. 2-2 are also applicable for determining elongation.
.")
4 Apparatus for tension are of two general types: those which apply a constant strain rate and those which apply a constant load rate. A constant load rate device is typified by the inclined plane tester shown in Fig The specimen is held between clamps (C). A carriage (B) carries the load and is free to move to the right with negligible friction as the angle of the inclined plane becomes steeper and steeper due to its rotation about Pivot (P). A pen draws a stress-strain diagram which is used for the determination of strength and elongation. The arrangement is such that the rate at which the load is applied is nearly constant during a given test. Fig Constant Strain rate tension tester.

5 In the constant strain rate testing apparatus, the test specimen is held between clamps or grips and these grips are then separated at a constant velocity. The specimen is thus forced to stretch at a prescribed rate. A constant strain rate testing apparatus is shown in Fig. 2-4 with the insert picturing the movable crosshead (A) which is driven by threaded shafts (B). The clamps (C) hold the test specimen at each end and the force applied to the specimen is changed to an electrical signal, is amplified and recorded on one axis of the strip chart recorder. The second axis of the strip chart recorder is meanwhile recording crosshead position. Thus, the result is a stress-strain diagram as shown in Fig Note that the strain increases as the graph is read from right to left. This is caused by the direction of motion of the chart paper; also note that breakage of the specimen occurred at A at which time stress drops to zero. Testing apparatus such as that pictured is extremely versatile and can be used for compression as well as tension testing with the stress or strain axis amplified as desired.
6 Hardness The tests for hardness of contact materials includes Knoop, Brinell, and Rockwell hardnesses. Hardness cannot be considered a fundamental property of a material but is a composite property including in some way tensile strength, proportional limit, ductility, work-hardening properties, shear strength, modulus of elasticity, and other properties. In general, these indentation hardness measurements are obtained by forcing an indenter, under a known load, into the specimen s surface and then measuring some dimensions of the impression that has been made by the indenter. Brinell hardness (HB) is determined by applying a known load to the surface of the material to be tested through a hardened steel ball of known diameter. Then : In practice, the diameter of the impression is measured, from which the surface area is computed. The diameter of the indenter ball and the load used can make a difference in the observed hardness and therefore should be stated in any test report. For the common wrought noble metal alloys, when Brinell hardness is measured at Ney, a 1/16 (1.59 mm) diameter indenter ball and a 15 kilogram load is used. This is a deviation from textbook Brinell testing, which calls for a 12.6 kilogram load, but is useful and convenient because of the widespread availability of 15 kg loading devices. Samples are mounted in thermosetting plastic and ground and polished by the methods described in Section A Rockwell superficial hardness machine is used to conveniently provide the 15 kilogram indenter load. The operation of placing an indentation on a mounted specimen is pictured in Fig Although the machine is used to make the impression, no measurements are made while the specimen is on the machine. It is first removed from the machine and placed in a measuring microscope for a determination of the indentation diameter from which the Brinell hardness number is calculated. The Brinell hardness of any contact material is important because, as we have seen in previous sections, it is this hardness number which is used in the determination of load bearing area of mating contact members.

7 A high percentage of the material and parts made of noble metal alloys are of small dimension. The thin strip, small diameter wire and miniature fabricated parts are most times too small for a Brinell or Rockwell superficial hardness test to be made. Microhardness testing, principally Knoop hardness, is commonly used. The smallness of the Knoop impression (100 gram indenter load) compared with a Brinell impression, illustrated by Fig. 2-7, showing indentations taken on the same specimen at a magnification of 133X. Specimens with small cross section with their Knoop impression are shown in Fig Polishing scratches of the degree shown are acceptable for production testing so long as Knoop micro-hardness impression are placed in areas that are free of deep scratches. Knoop hardness number (HK) is a number signifying the ratio of the applied indenter load to the projected area of the impression made by a rhombic pyramidal diamond indenter having an accurately defined shape.
8 In practice, the length of the long diagonal is measured, after which tables of length versus Knoop hardness for specific indenter loads are used to conveniently convert to hardness number. A micro-hardness testing machine is shown in Fig This machine very gradually lowers the indenter onto the mounted specimen, applies the required indenter load in a smooth fashion, then automatically raises the indenter. The operator can then measure the long diagonal of the impression with the filar eyepiece and determine the Knoop hardness number.
 shown near 5 of the fixed grid.")

9 The view through the filar eyepiece appear as in Fig. 2-10, with the movable hairline (used to measure the impression length) shown near 5 of the fixed grid. Areas of metal distortion can be seen near the periphery of the impressions. Thus, indentations must be made far enough apart to avoid any influence of these distorted areas. Vickers hardness (formerly called Diamond Pyramid Hardness) is occasionally used in specifications for noble metal alloys. Ordinarily this is of the microhardness variety and is done by using the same equipment a for Knoop hardness, by replacing the indenter with one
10 that is an equal-sided pyramid. Another difference is that the Vicker hardness represents the ratio of the indenter load to the surface area of the indentation. Rockwell hardness and Rockwell superficial hardness machines are used at times when the items to be tested are large enough and of such a shape that uniform urfaces are available for placement against the anvil and for the impressions. All Rockwell machines measure hardness by determining the depth of penetration of an indenter into the specimen, with the depth being measured while a prescribed minor load is applied. The indenter may be a hardened steel ball or a sphericallyended diamond cone (Brale) may be used. Various combinations of loading and indenter pairing are given coded designations. For example, Rockwell C hardness indicate that a diamond indenter has been used with a major load of 150 kilograms; while Rockwell 15T signifies that 1/16 diameter ball indenter has been used in conjunction with a 15-kilogram major load. In Rockwell hardness testing, the fact that the depth of the impression is measured mean that the specimens must not be mounted in plastic or supported by anything other than a rigid member; otherwise the reading is erroneous to the extent that the supporting member has deformed during any of the loading cycle. This is in contrast to most other hardness systems where mounting in plastic is the preferred method. Conversions from one hardness scale to another are difficult to do with accuracy because of the differing effects of elastic recovery, work hardening, etc., among the various hardness measuring systems. Thus, tests comprising a multitude of measurements are needed for each material, in each metallurgical condition (i.e., work hardened, annealed, age hardened, etc.) to establish the correlation between two types of hardness. Even at their best, conversions are subject to significant error. The nature of the error can be visualized by referring to Fig. 2-11, which show data points from actual measurements of HK 100 (Knoop hardness, 100 gram indenter load) and HV 100 (Vicker hardness, 100 gram indenter load) on the same specimens of age hardened Paliney 7. Each data point represents the hardness measurement of one specimen and the line shown is what would be used for conversion purposes. It is obvious that the conversion factor is a band whose axis has a positive slope. Notice, however, that the increase in one type of hardness are not always accompanied by observed increases in the other, although it is true on the average.

11 Relation of Tension Properties and Hardness. All of the types of hardness tests that have been reviewed here measure in some way the resistance to permanent deformation. In a general way, this is a strength characteristic so we would expect hard materials to be those with high tensile strengths and proportional limits. While this is true on the average, it is not reliable to the extent that any accurate conversion can be made from hardness to any tensile property, or vice versa. Considering that a tensile test gives a measure of the strength of the weakest link in the chain, while a hardness test averages the strength over the deformed area, it is not surprising that conversions from one property to the other are only approximate. Sometimes one will be faced with choosing between tensile testing and hardness testing for verifying that properties of a material are proper. The tensile test is to be favored in this case because it reveals multiple characteristics, i.e., ultimate tensile strength, proportional limit and elongation. Conversely, the hardness test averages all these together in some unknown manner.

 operating at a sufficiently low value of applied stress, (b) having a small enough variation or fluctuation in the applied stress or by (c) operating below a")
12 Fatigue and Endurance Limit. Fatigue is the name given to the failure of materials due to the action of applied stresses which fluctuate repeatedly, usually in some cyclic manner. A minute crack forms at some location due to a microscopic fault, scratch or other stress concentration and gradually penetrates through the cross section until breakage occurs. This breakage happen at an applied repetitive stress level much lower than that needed to cause breakage if the load were applied only once. Fatigue failure can be avoided by (a) operating at a sufficiently low value of applied stress, (b) having a small enough variation or fluctuation in the applied stress or by (c) operating below a given number of stress applications. In other words, fatigue failure depends on the magnitude, variation and number of excursions of the applied stress. As an illustration of the sort of contact assembly in which one consideration in the material election would be the fatigue properties, see Fig Each blade, made of strips of Paliney 7, serves as a self-contained beam, cam follower, and contact member. The blade is pushed toward the rivet contact by the cam (not shown) until it applies the proper contact force. Stresses* in the blade thus vary from zero to some maximum value and then back to zero.


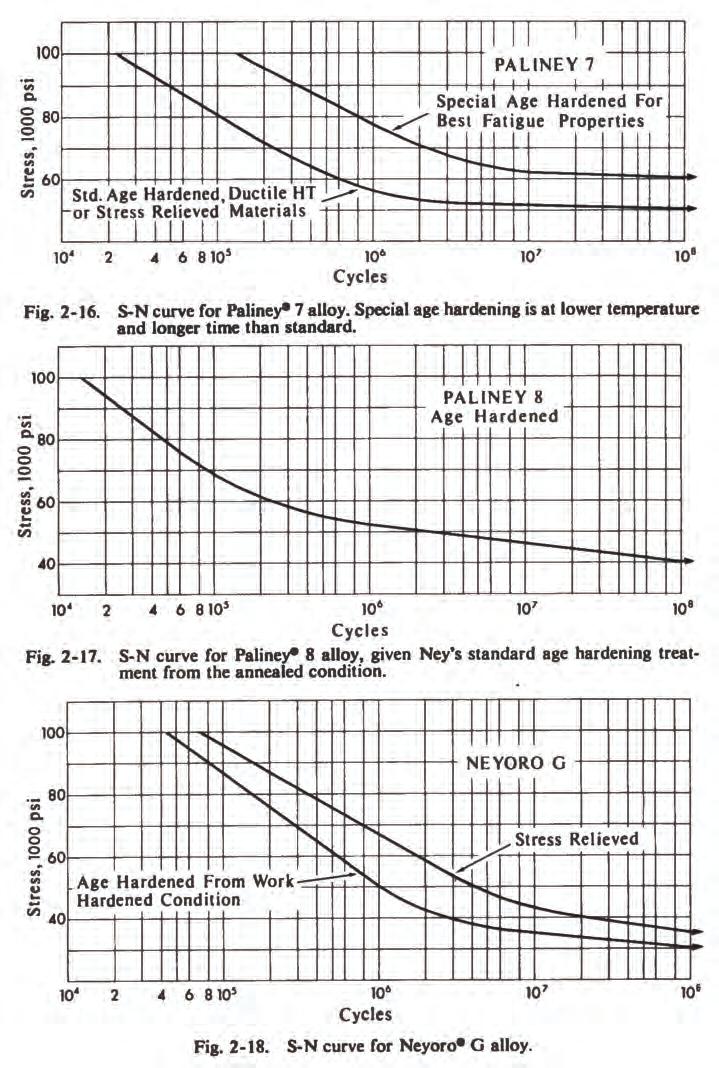
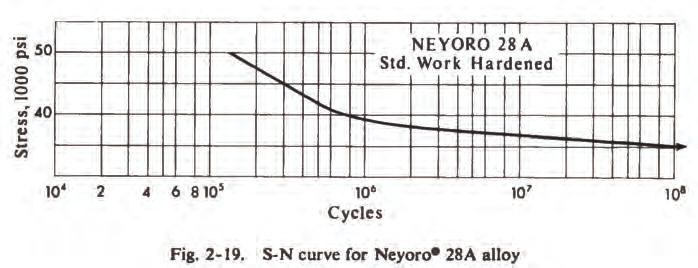
13 Tests to determine the fatigue properties of the Ney alloys have been performed on the test mechanism hown in Fig This apparatus tests round wire specimens which are straight until installed in the tester where they assume the form of a loop. By deflecting the wire into the shape of a loop of specified dimensions, the desired stress is applied. Stresses over a wide range are obtainable by varying the distance between the two end of the loop or the test wire diameter or both. Two bushings hold the test wire in position; the left bushing holds the wire loosely so that it can rotate about it own axis, the right bushing grip the specimen tightly and is rotated by a motor inside the case. Thus, with each rotation a cyclic stress ranging from maximum tension, to zero, to maximum compression, to zero and back to maximum tension is applied. This constitutes one cycle of stress. This is called a rotating-bending fatigue test. Result of a series of tests are plotted as shown in Fig The stress at which a sample was run is plotted against the number of cycles at which failure (in the form of wire breakage) occurred. (A symbol means no failure.) A plot of this type is commonly called an S-N diagram. Note that the curve has been constructed so that it passes through the minimum data points, which makes the curve conservative. The S-N diagrams in Figs 2-15 through 2-19 have been obtained and plotted in the manner described. This rotating-bending test is considered a more severe test than the more common reversal of stresses in a simple cantilever beam.

14 Another factor of importance in the interpretation of the curves is that no special surface preparation was used prior to the tests. The wires tested were from typical production runs; thus the results are what can be expected from material purchased from The J. M. Ney Company on a routine basis. The size of wire tested ranged from.006 to.017 diameter, depending on the stress desired for a particular alloy.
15
16