FATIGUE AND STRENGTH TESTS OF HEAT-STRAIGHTENED FERRY LOADING BRIDGE HANGER BARS
|
|
|
- Estella Morrison
- 5 years ago
- Views:
Transcription
1 Research Report Agreement T4118, Task 92 WSF Bearings Tests FATIGUE AND STRENGTH TESTS OF HEAT-STRAIGHTENED FERRY LOADING BRIDGE HANGER BARS by Jeffrey W. Berman Associate Professor Vince Chaijaroen Structures Lab Manager Department of Civil and Environmental Engineering University of Washington, Box Seattle, Washington Washington State Transportation Center (TRAC) University of Washington, Box University District Building 1107 NE 45th Street, Suite 535 Seattle, Washington Washington State Department of Transportation Technical Monitor Jeri Bernstein Bridge Engineer, Washington State Ferries Prepared for The State of Washington Department of Transportation Lynn A. Peterson, Secretary June 2013
2 1. REPORT NO. 2. GOVERNMENT ACCESSION NO. 3. RECIPIENT'S CATALOG NO. WA-RD TITLE AND SUBTITLE 5. REPORT DATE FATIGUE AND STRENGTH TESTS OF HEAT- STRAIGHTENED FERRY LOADING BRIDGE HANGER BARS June PERFORMING ORGANIZATION CODE 7. AUTHOR(S) 8. PERFORMING ORGANIZATION REPORT NO. Jeffrey W. Berman, Vince Chaijaroen 9. PERFORMING ORGANIZATION NAME AND ADDRESS 10. WORK UNIT NO. Washington State Transportation Center (TRAC) 11. CONTRACT OR GRANT NO. University of Washington, Box University District Building; 1107 NE 45th Street, Suite 535 Seattle, Washington Agreement T4118 Task SPONSORING AGENCY NAME AND ADDRESS 13. TYPE OF REPORT AND PERIOD COVERED Research Office Final Research Report Washington State Department of Transportation Transportation Building, MS SPONSORING AGENCY CODE Olympia, Washington Project Manager: Rhonda Brooks, SUPPLEMENTARY NOTES This study was conducted in cooperation with the U.S. Department of Transportation, Federal Highway Administration. 16. ABSTRACT: Tests were conducted on heat-straightened and/or bent live load hanger bars used in loading bridges in the Washington State Ferry (WSF) system. Both fatigue and ultimate strength tests were conducted. The study found that when heat-straightened three times, the hanger bars have a fatigue life that exceeds their design life. The data indicated that additional heat-straightening may be possible without concern for reducing the fatigue life. The yield strength of the hanger bars was found to be unaffected by either heat-straightening or by initial bending deformations. In both cases the hanger bar yield strength exceeded nominal values. The ultimate strength was somewhat reduced by the presence of initial bending deformation. 17. KEY WORDS 18. DISTRIBUTION STATEMENT Live load hanger bars, ferry bridges, fatigue, heatstraightening No restrictions. This document is available to the public through the National Technical Information Service, Springfield, VA SECURITY CLASSIF. (of this report) 20. SECURITY CLASSIF. (of this page) 21. NO. OF PAGES 22. PRICE None None
3 Disclaimer The contents of this report reflect the views of the authors, who are responsible for the facts and the accuracy of the data presented herein. The contents do not necessarily reflect the official views or policies of the Washington State Department of Transportation or Federal Highway Administration. This report does not constitute a standard, specification, or regulation. iii
4 iv
5 CONTENTS Executive Summary... vii Introduction, Motivation and Objectives... 1 Fatigue Testing Set-Up and Results... 4 Ultimate Strength Testing Set-Up and Results... 6 Conclusions Laboratory Disclaimer Statement Appendix v
6 FIGUES AND TABLES Figure 1. Loading Bridge Cross-Section with Hanger Bars Labeled... 1 Figure 2 Loading Bridge Elevation with Hangar Bar Labeled... 2 Figure 3 Hanger Bar Detail... 3 Figure 4 (a) Fatigue Test Set-Up and (b) Fatigue Specimen... 4 Figure 5 Figure 6 Ultimate Strength Test Set-Up (a) Nominal 10-ft Specimen and (b) 40-in. Specimen... 6 (a) Example of Typical Slotted Hole Yielding and Deformation and (b) Example of Typical net Section Fracture... 7 Figure 7 Load vs. Time Curves for Ultimate Strength Tests... 9 Table 1 Details and Yield and Ultimate Strengths of Tested Hanger Bars vi
7 EXECUTIVE SUMMARY Objectives The objective of this study was to determine whether heat-straightened and/or bent ferry loading bridge hanger bars have adequate fatigue life and ultimate strength. Background The bridges used to load vehicles onto Washington State ferries are supported on one end by hanger bars. These bars carry bridge loads in tension but can buckle in compression as the ferry rises with rising tides while at the dock. Washington State Ferries (WSF) engineers heatstraighten the buckled bars and return them to service. However, it is unclear whether the bars can be heat-straightened three times and safely reused. It is also unclear to WSF engineers what the ultimate tensile capacity of the plastically buckled bars is. Research Activities Two sets of tests were conducted on heat-straightened hanger bars. First, bars that had been heatstraightened three times were tested under fatigue loading with the amplitude of the varying loading near the design load for the bars, determined by the live truck loads on the bridge. Second, several hanger bars, heat-straightened two or three times or cold bent to 5 degrees, were tested in tension to failure to determine their ultimate strength. Conclusions Fatigue tests demonstrated that hanger bars heat-straightened three times have a fatigue life of at least 3 million cycles at a load range of 50 kips (10 kips tension to 60 kips tension). The ultimate strength tests demonstrated that the bars were able to reach the yield capacity of the net section regardless of the heat straightening or initial out-of-straightness. Ultimate hanger bar strength was not affected by heat-straightening, but initial out-straightness did reduce the ultimate capacity slightly. Results from all tests indicated that, for loads within the range used for testing, bars may be safely heat-straightened at least three times and likely more and returned to service. vii
8 INTRODUCTION, MOTIVATION AND OBJECTIVES The bridges used to load vehicles onto Washington State ferries are supported on one end by hanger bars. Figures 1, 2, and 3 show a typical loading bridge and hanger bar. These bars carry bridge loads in tension, but they can buckle in compression as the ferry rises with rising tides while at the dock or when workers adjust the bridge without removing the pins. Washington State Ferries (WSF) engineers then heat-straighten the bars and return them to service. However, it is unclear whether the bars can be heat-straightened three times and safely reused. Figure 1. Loading Bridge Cross-Section with Hanger Bars Labeled. The objective of this research was to determine whether heat-straightened ferry loading bridge hanger bars have adequate fatigue life and ultimate strength. To achieve this objective, the 1
9 researchers carried out fatigue and ultimate strength tests in the University of Washington (UW) Structural Research Laboratory (SRL). Figure 2. Loading Bridge Elevation with Hanger Bar Labeled. 2
10 Figure 3. Hanger Bar Detail 3


11 FATIGUE TESTING SETUP AND RESULTS Test Set-Up Two hanger bar specimens were tested under fatigue loading in a 110-kip fatigue test frame in the SRL. The test set-up is shown in Figure 4a. The specimens were 40 in. long and had three of the oval shaped holes shown in Figure 3, with 4 in. of overhang on each end. A typical specimen is shown in Figure 4b. Each specimen had been heat-straightened three times, and they were named 3A and 3B. The specimens were connected to the test frames by using a series of plates and pins. The pins that were used in bearing against the hanger bars were identical to those used in the ferry loading bridges to ensure that the stress distribution in the tests closely matched that expected in the field. (a) Figure 4. (a) Fatigue Test Setup (b) Fatigue Specimen (b). Mayes Testing Inc. conducted magnetic particle testing on both the fatigue specimens before and after testing to look for cracks. Some surface cracks were noted before testing but were likely the result of corrosion and did not grow during the tests. The inspection reports from Mayes Testing Inc. are included in the Appendix. 4
12 Both specimens were subjected to sinusoidal cyclic fatigue loading with peaks at 60 kips and 10 kips of tension at a rate of 3 Hz. The loading was conducted around the clock, and emergency switches were utilized to sense a failure and stop the hydraulic system. This loading protocol was agreed to by the SRL staff and the WSF engineers. They determined that the specimens should be subjected to 3 million cycles of loading, at which point the tests would be stopped if no failure occurred. Experimental Results Both specimens were loaded to 3 million cycles without failure. Post-test magnetic particle inspections conducted by Mayes Testing Inc. showed no signs of cracking at the hanger bar net section or in the regions of heat-straightening. Both specimens were then reused in the ultimate strength tests described below. Although twice heat-straightened specimens were also prepared, they were not tested in fatigue because the specimens that had been straightened three times performed well. Instead, they were tested for ultimate strength as described below. The design life for these bars is 10 years, and according to WSF engineers, the design life results in a loading of 1.3 million cycles at the tested stress range. Therefore, the experimental results indicated that the bars heat-straightened three times have ample fatigue life for their intended design life. 5
13 ULTIMATE STRENGTH TESTING SET-UP AND RESULTS Test Set-up Ultimate strength tests were conducted at the top of the SRL s 2.4-million-pound capacity Universal Testing Machine (UTM). Two lengths of specimens were tested: (1) nominally 10-ftlong bars, one that had been heat-straightened multiple times and two that were installed bent to simulate their condition after buckling, and (2) 40-in.-long bars that were used (or designed to be used) in the fatigue test set-up. Figure 5 shows the two types of specimens installed in the UTM. The material for all bars was either A36 or an unknown older steel. (a) (b). Figure 5. Ultimate Strength Test Setup (a) Nominal 10 ft Specimen (b) 40 in. Specimen The set-up utilized pin connections at each end of the hanger bars, and the pins used were identical to those used in the field. Loading was applied slowly to each specimen and continued 6
14 until failure. Only the load was recorded during the tests. However, the tests were conducted under displacement control, i.e., the displacement of the UTM crosshead was used to control loading during the test. This crosshead displacement was applied at a uniform, slow rate. Thus, plotting the force applied versus time would indicate when the specimens began to yield, since there is a linear relationship between time and displacement. Experimental Results Each specimen exhibited reasonable ductility before fracturing either at a net section area adjacent to a slotted hole within the length of the specimen or at the net section where the pins connected to the specimens. After the tests, signs of yielding at all net section areas adjacent to the slotted holes were visible. An example is shown in Figure 6a. An example of the typical net section fracture that occurred after significant inelastic deformation is shown in Figure 6b. (a) Figure 6. (a) Example of typical slotted hole yielding and deformation. (b) Example of typical net section fracture. (b) 7
15 Table 6 lists the details of each specimen. Specimens Ult1 and Ult2 were 10 ft long and were tested after being bent (Figure 5a). Specimen Ult3 had been heat-straightened three times. Specimens F3A and F3B were 40 in. long and had been subjected to 3 million cycles of fatigue loading as described above. Specimens F2A and F2B were 40 in. long and had been heatstraightened twice. As noted above, all specimens exhibited ductile behavior, and the two bent specimens did not fracture at the bend but rather at a different net section (at the pin connection or one slotted hole away from the pin connection). Figure 7 shows the force versus time curves for each tested specimen, where the names correspond to the information in Table 1. As noted above, a constant rate of crosshead displacement was used to control the test so that the load versus time curves would be similar to load deformation curves. Figure 7 shows that each specimen had a clear yield point at which the slope of the curve changed. This was followed by ductile inelastic deformation and eventual fracture at a net section adjacent to a slotted hole. Note that the two long bent specimens showed a smaller initial stiffness as the bend in the bar was straightened. Also note that those two specimens had slightly lower ultimate strengths than the other specimens, although the yield strength was similar. By using the curves of Figure 7, the yield and ultimate strengths of each specimen were determined, and the results are given in Table 1. The table also shows the nominal yield and ultimate strengths, assuming a yield stress of 36 ksi and an ultimate stress of 58 ksi each, times the net area at a long slotted hole of 9.5 in 2. A comparison of the nominal and experimentally obtained values indicated that the inelastic buckling deformation, heat-straightening (up to three times), and fatigue loading generally did not affect the yield strengths of the bars. The data in Table 1 do indicate that the bars tested in the bent configuration had somewhat lower ultimate strengths, producing effective ultimate stresses of 56.7 for Specimen Ult1 and 60 ksi for Specimen Ult2. The former was slightly lower than the minimum ultimate stress for A36 of 58 ksi. It is unclear why these specimens exhibited a lower ultimate strength, especially given that the fractures occurred far from the bends. Heat-straightening and fatigue loading were not found to affect the ultimate strength. 8
16 (a) Specimen F2A (b) Specimen F2B (c) Specimen F3A (d) Specimen F3B (e) Specimen Ult1 (f) Specimen Ult2 (g) Specimen Ult3 Figure 7. Load vs. Time Curves for Ultimate Strength Tests 9
17 Specimen ID Table 1. Details and Yield and Ultimate Strengths of Tested Hanger Bars Specimen Length Specimen Details F2A 40 in. Heat-straightened two times, loaded only for ultimate strength, A36 steel F2B 40 in. Heat-straightened two times, loaded only for ultimate strength, A36 steel Heat-straightened three times, F3A 40 in. loaded in fatigue before ultimate strength, A36 steel Heat-straightened three times, F3A 40 in. loaded in fatigue before ultimate strength, A36 steel Bent bar at approximately 10, Ult1 10 ft. loaded only for ultimate strength, A36 steel Bent bar at approximately 10, Ult2 10 ft. loaded only for ultimate strength, A36 steel Ult3 10 ft. Heat-straightened, loaded only for ultimate strength, unknown steel Nominal - 36 ksi yield stress, 58 ksi ultimate stress 1 Yield strength estimated as point of significant change in slope in Figure 7 plots. 2 Maximum force obtained during test. Yield Strength 1 (kips) Ultimate Strength 2 (kips)
18 CONCLUSIONS The testing program demonstrated that hanger bars heat-straightened up to three times are able to resist 3 million cycles of fatigue loading with a range of 50 kips develop good ductility achieve yield strengths consistent with the yield stress of the original material, and achieve ultimate strengths consistent with the tensile stress of the original material. Hanger bars with large bends from inelastic buckling are also able to achieve yield strengths consistent with the yield stress of the material, but they were observed in one case to have an ultimate strength slightly lower than what would be expected by developing the tensile stress of the material over the net section area. 11
19 LABORATORY DISCLAIMER STATEMENT: The Structural Research Laboratory provides commercial testing services. These services are limited to testing and data collection. The results are valid at the time the test occurs on the specific specimens tested. The engineering response of similar items is not within the scope of the testing agreement. The SRL staff, the Department of Civil and Environmental Engineering, the College of Engineering, and the University of Washington disclaim any and all liability for any personal or property damage or loss as a result of use of the test results. 12
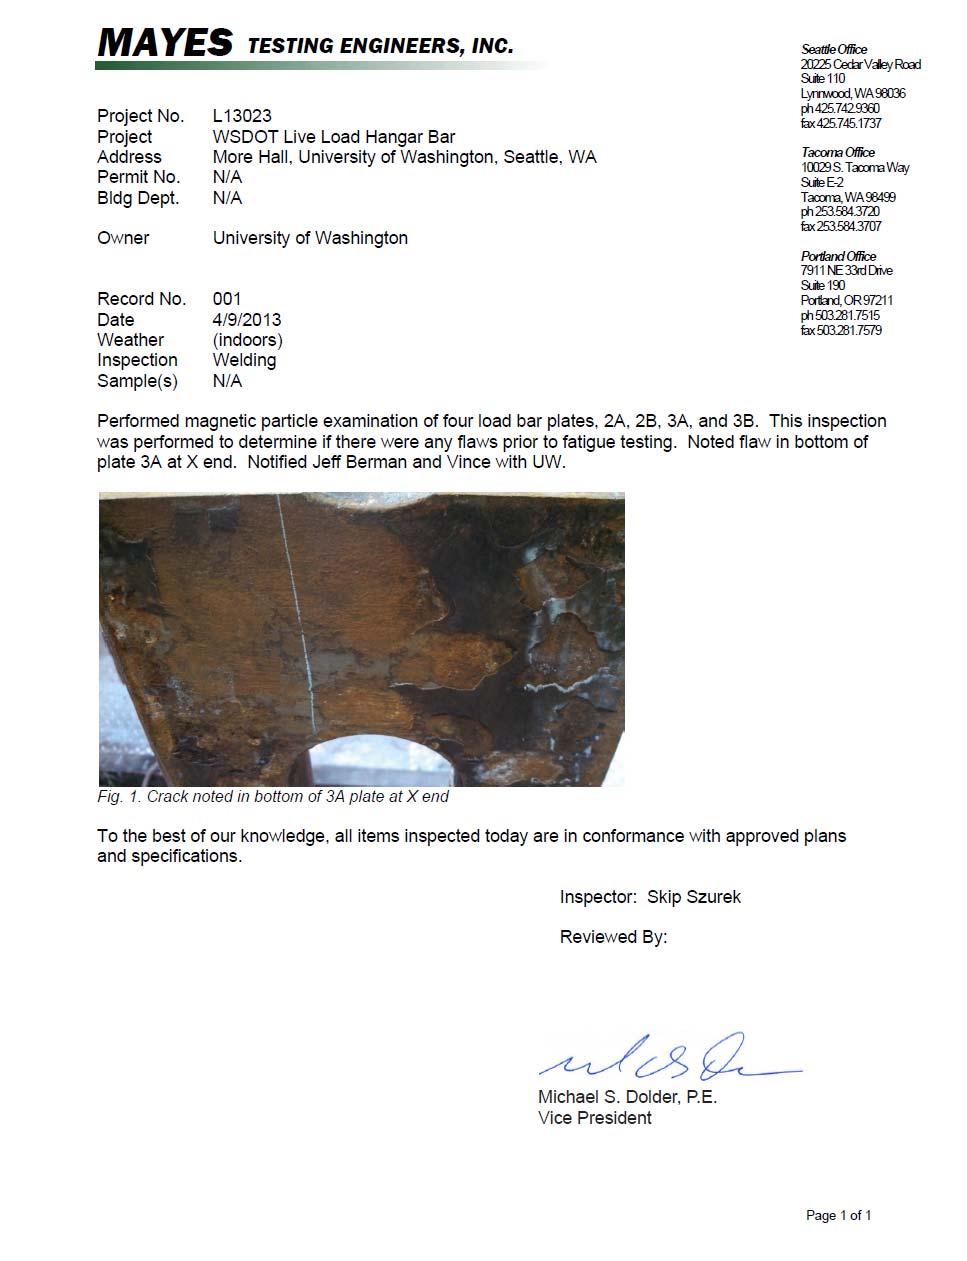
20 APPENDIX Below are inspection reports from Mayes Testing Engineers, Inc. They performed magnetic particle testing on the hanger bars before fatigue loading (inspection on April 2, 2013) to check for initial cracks and following fatigue loading (inspection on May 17, 2013) for Specimen F3A and F3B (denoted 3A and 3B in the inspections reports). As shown, no indications of significance were found. Small indications parallel to the direction of the applied load were found, but they were not due to the fatigue loading applied but instead may have been related to corrosion or material imperfections. 13
21 14
22 15
23 16
24 17