SPECIAL PETROPHYSICAL TOOLS: NMR AND IMAGE LOGS CORE
|
|
|
- Marshall Walton
- 5 years ago
- Views:
Transcription
1 SPECIAL PETROPHYSICAL TOOLS: NMR AND IMAGE LOGS CORE NMR Logging LEARNING OBJECTIVES By the end of this lesson, you will be able to: Understand the basic concepts of Nuclear Magnetic Resonance (NMR) logging Explain how porosity and other rock and fluid are determined with the NMR Describe how permeability is derived from NMR logs 1
2 Image Logs NMR IMPORTANCE IN WELL LOGGING What does S w = 50% mean??? Should we perforate or not? Will it produce water or will it not? Must be able to relate to irreducible saturation. This is especially true if working tight reservoirs! (fine grained) PETROPHYSICAL VALUE OF NMR Of interest here Mineralogy-independent porosity (total, effective) Mobile versus bound water volume Distinction between capillary and clay-bound water Relative pore body size (large-small) distributions For comparison to quantitative PIA (Petrographic Image Analysis) data Permeability estimate Potential for hydrocarbon typing and saturation through advanced processing 2


3 NUCLEAR MAGNETIC RESONANCE Nuclear Magnetic resonance measures the strength and the decay time of the signal generated by the hydrogen in the pore space. Interpretation: Strength Porosity Decay time Pore size distribution SPECIAL TOOLS NUCLEAR MAGNETIC RESONANCE TOOLS THE PRINCIPLE 3
4 Image Logs NMR - TOOL PRINCIPLE At the center of the tool is a permanent magnet that produces a magnetic field. An antenna surrounding the magnet transmits precisely timed bursts of radio-frequency energy in the form of an oscillating magnetic field. Between the pulses the antenna is used to listen for the decaying echo signals from hydrogen protons that are in resonance with the magnetic field. The tool is tuned to specific frequencies. CENTRALIZED NMR TOOL 4


5 VARIABLE RADIAL INVESTIGATION VOLUME MRIL TOOL The tool can be operated at different frequencies allowing independent information to be obtained from multiple concentric cylinders; Depth of Investigation typical ins. 5

 Properties of the pore fluids are the; Hydrogen Index (HI) Longitudinal relaxation")
6 Image Logs MRIL TOOL RESPONSES Courtesy of Halliburton RAW DATA The echo train can be linked to properties of the pore fluids; Acquisition parameters include inter-echo spacing (TE) and polarization time. (TW) Properties of the pore fluids are the; Hydrogen Index (HI) Longitudinal relaxation time (T1) Transverse relaxation time (T2) and Diffusivity (D) 6
7 DECAY OF SPIN ECHO TRAIN Courtesy of Halliburton T 2 DISTRIBUTION OF FORMATION IS GOAL T 2 distribution helps unravel: Reservoir Texture Pore Distribution Producibility 7
8 Image Logs NMR POROSITY Initial amplitude of spin echo is proportional to the number of hydrogen nuclei in the pore fluids which can be calibrated to give a porosity. Note: This porosity is independent of lithology and can be validated by comparison with lab NMR measurement on cores using conventional porosity measurements. PROXIMITY TO A SURFACE Signal amplitude 100% porosity CMR porosity Water in test tube T 2 = 3700 msec Water in pore space of rock T 2 = 10 to 500 msec Time, msec 8

9 PORE SIZE T 2 RELATIONSHIP Large SPECIAL TOOLS NMR Nuclear Magnetic Resonance Tools - Decay and Spectrum Small pores Small pores 9


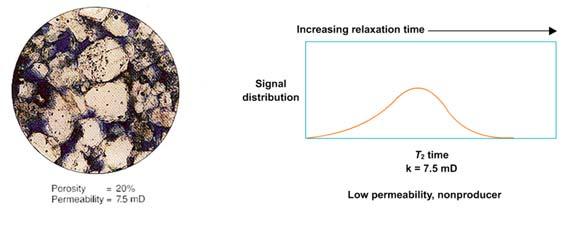
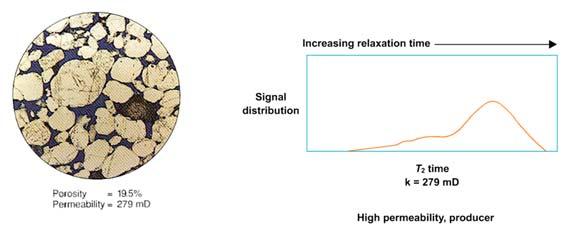
10 Image Logs CORRELATION OF MCIP AND T 2 DISTRIBUTION The correlation between MCIP and T 2 distributions offers a reasonable assurance that the T 2 distributions estimate a sensible pore size distribution when pores are 100% water-saturated. Courtesy of Halliburton WHICH WELL PRODUCES BETTER? 10
11 NMR VS CORE POROSITY Courtesy of Halliburton INFORMATION FROM THE TOOL Quantity of fluid Properties of fluid Pore sizes Direct measurement of density of hydrogen nuclei Data converted to water filled porosity Determine the presence and quantities of fluids oil, water, gas and specific properties e.g. viscosity 11

12 Image Logs NMR T 2 DISTRIBUTION Amplitude of spin-echo train can be fit by a sum of decaying exponentials Single pore size will give a single exponential with decay constant proportional to pore size T 2 distribution can be displayed in three ways Waveform presentation Image format Bin-distribution NMR BULK VOLUMES DISPLAY 12

13 T2 DISTRIBUTION DISPLAYS Courtesy of Halliburton FREE FLUID INDEX AND BULK VOLUME IRR: Porosity and pores size distribution can be used to estimate permeability and potentially producible (i.e. the moveable fluids). Estimate is termed FFI based on large versus small pores based on T2 values; a T2 cutoff is established. By partitioning T2 distribution the total porosity (MPHI) is divided into FFI and bound fluid porosity. (BVI) T2 cutoff can be determined by NMR measurements on water saturated core samples. (GOM data T2cutoff 33ms and 92ms (sand/carbonate)). 1

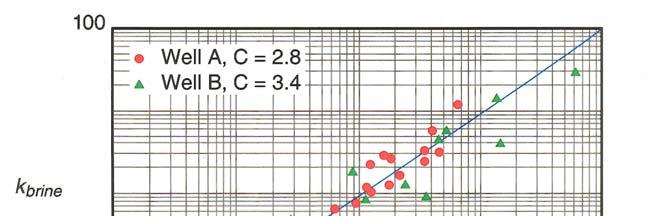
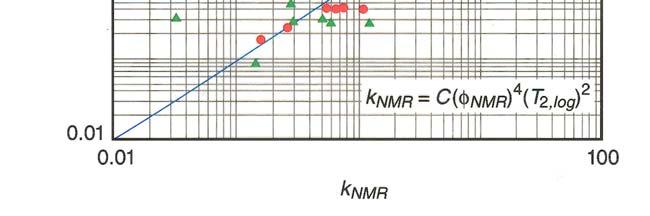
14 NMR Logging SPECIAL TOOLS NMR Nuclear Magnetic Resonance Tools The Free Fluid Index Concept NMR PERMEABILITY Moveable fluids Estimate of permeability based on theoretical models based on porosity and pore size. Two related models have been developed. 1. Free Fluid model 2. Coates model Measurements on core are necessary to refine these models 2

 3")
15 PERMEABILITY FROM NMR EFFECT OF PORE SIZE (PERMEABILITY) 3


16 NMR Logging PERMEABILITY FROM NMR Track 3 of this log shows the MRIL permeability derived from a customized Coates model. RESERVOIR FLUID PROPERTIES Courtesy of Halliburton 3 Clay bound water, capillary bound and movable water occupy different pore sizes and locations Differences in viscosity and diffusivity are used to characterize the fluids Bound fluids have very short T1 and T2 and slow diffusion (D) Free water generally medium T1,T2 and D Hydrocarbons have different characteristics Gas exhibits long T1 but short T2 Oils quite variable dependent on viscosity Lighter oils highly diffusive long T1 and T2 As viscosity increases D, T1, T2 decrease 4
. A coarsening upward sequence from X160 to X255 is apparent based upon the increase of BVI")


17 GOM EXAMPLE This Gulf of Mexico silty-sand formation illustrates the variability of BVI (Track 4). A coarsening upward sequence from X160 to X255 is apparent based upon the increase of BVI and gamma ray with depth. If the free fluid were predominantly hydrocarbon, then the increased - irreducible water deeper in the interval would account for the observed reduction in the logged resistivity. What appears at first sight to be a transition zone from X190 to X255 could actually be just a variation of grain size with depth. Courtesy of Halliburton 4 NMR HYDROCARBON TYPING 5 5

18 NMR Logging DSM AND TDA ANALYSIS Courtesy of Halliburton 5 NMR WATER SATURATION WITH RESISTIVITY DATA Resistivity tools do not distinguish between capillary bound and movable water 6 Information from NMR such as BVI and CBW can enhance the estimation of resistivity based water saturation and recognition of pay zones that will produce water free oil NMR data is combined with deep resistivity to determine producible water or whether an interval with high water saturation may produce water free hydrocarbons Refer to the figure on the next slide 6

19 COMBINATION OF RESISTIVITY DATA WITH NMR Courtesy of Halliburton 5 NMR ON CORE WHY? Field specific: Verification of NMR tool response Fine-tuning of permeability equation Unusual rock types, in particular carbonates Global, by rock type if required Establish correlations with other parameters Micro-porosity as input to models Estimation of capillary pressure curve Verification of existing and new interpretation methods Multi-acquisition NMR processing 7


20 NMR Logging SHALY SAND EXAMPLE These data from a shaly sand formation in Egypt show the good agreement between core data and MRIL porosity and permeability. Courtesy of Halliburton GAS RESERVOIR EXAMPLE In this gas reservoir, MRIL porosity is affected by the hydrogen index of the pore fluids. A corrected porosity, either from another source such as nuclear logs or from MPHI after HI correction, should be used for permeability calculation. Courtesy of Halliburton
 indicate that both the upper and lower intervals have high water saturation, but that the formation water is at irreducible conditions.")
 deter mined oil saturation in the flushed zone to be in the 35 to 45% range.")
21 MRIL DATA ANALYSIS MRIL data were acquired in the well of Fig and were used in DSM, TDA, and MRIAN analyses. The MRIAN results (Track 7) indicate that both the upper and lower intervals have high water saturation, but that the formation water is at irreducible conditions. Thus, the zone should not produce any formation water. The entire zone has permeability in excess of 100 md (Track 2). The TDA analysis (Track 6) deter mined oil saturation in the flushed zone to be in the 35 to 45% range. With this information, the operator perforated the entire interval and recorded an initial production rate of 2,000 BOPD with no water influx. Courtesy of Halliburton 6 DUAL TW MEASUREMENT 7 Courtesy of Halliburton 9


22 NMR Logging NORTH SEA CHALK EXAMPLE_T2 DISTRIBUTION WATER AND LIGHT OIL Courtesy of Halliburton Courtesy of Halliburton 10

23 VISCOUS OIL RESERVOIR NMR LOGGING SUMMARY Courtesy of Halliburton Distinguish low resistivity/low contrast pay zones Evaluating complex lithology oil and/or gas reservoirs Identifying medium viscosity and heavy oils Studying low porosity/low perm formations Determining residual oil saturation Enhancing stimulation design Valuable information: Mineralogy independent porosity Porosity and pore size distribution BVI and Free Fluid when a reliable T cutoff is available 11
24 NMR Logging MRIL TOOL In its basic configuration, the MRIL tool consists of a magnetic mandrel, an electronics cartridge, and one or two energy-storage cartridges. Courtesy of Halliburton LEARNING OBJECTIVES By You the are end now of this able lesson, to: you will be able to: Understand the basic concepts of Nuclear Magnetic Resonance (NMR) logging Explain how porosity and other rock and fluid are determined with the NMR Describe how permeability is derived from NMR logs 12
25 LEARNING OBJECTIVES SPECIAL PETROPHYSICAL TOOLS: NMR AND IMAGE LOGS CORE Permeability from Logs and Cores By the end of this lesson, you will be able to: Perform qualitative evaluation of permeability from conventional logging tools Estimate permeability from empirical relationships using log derived data Understand the application of specialized logging tools such as NMR and acoustic waveform for qualitative and quantitative estimation of permeability Identify techniques using core analysis both steady and unsteady state tests to derive permeability 1
 Crossplots (for example Schlumberger chart K-4) can give us a")
 EXAMPLE OF SP, GAMMA AND RESISTIVITY LOGS TO IDENTIFY PERMEABILITY")
26 Permeability from Logs and Cores CONVENTIONAL LOGS The basic or conventional tools do not give us a quantitative estimate of permeability SP, Gamma and Resistivity tools give us indications of whether the lithology is permeable, non-permeable or tight (low porosity and permeability) Crossplots (for example Schlumberger chart K-4) can give us a quantitative estimate of permeability using Porosity and Swirr (irreducible water saturation) NOTE: This can only be applied to the irreducible zone above the transition zone: Whether or not a formation is at irreducible water saturation depends upon bulk volume water values (=Sw x Ø) EXAMPLE OF SP, GAMMA AND RESISTIVITY LOGS TO IDENTIFY PERMEABILITY CHANGES 2
27 PERMEABILITY MODELS Numerous permeability models have been used. There are well established relationships between: Porosity Grain Size Grain surface area Irreducible water saturation Swirr Capillary pressure Shaliness Flow Rate Tortuosity (pore throat size) PERMEABILITY FROM SCHLUMBERGER CHART K-4 (Ø & S WIRR ) k Equation for Chart K-4 Swi 70 e Swi 1/
 Ø,porosity(p.u.")
28 Permeability from Logs and Cores PERMEABILITY ESTIMATION USING CHART K-4 (F AND S WIRR ) S wt water saturation above transition Zone (%) Ø,porosity(p.u.) PERMEABILITY MODELS FROM LOG DATA Kozeny (1927) later modified by Carman: Example: Locate Porosity (Ø=25 p.u.) Find irreducible water saturation (Swirr = 40%) Follow the two values into to the chart where they intersect: the heavy curve at point of intersection is permeability: In this example K= 130 md The equation includes a porosity term accounts for variables that might not directly affect permeability as it includes a surface area term Wyllie & Rose (1950): This method uses a Chart or 2 forms of an equation for medium gravity oils or gas. The factors in this equation include porosity and irreducible water saturation: ( S wirr) terms Timur (1968): Again this includes a porosity term and irreducible water saturation Coates and Dumanoir (1973): A more complex method; as it includes hydrocarbon density 4
29 NMR TOOLS NMR can give us a quantitative estimate of permeability. (Refer to Section 1 of Specialized Tools) NMR PERMEABILITY Estimate of permeability based on theoretical models based on porosity and pore size Two related models have been developed Free Fluid or Coates model Average T2 model Measurements on core are necessary to refine these models 5
30 Permeability from Logs and Cores WHICH WELL PRODUCES BETTER? PERMEABILITY FROM NMR 6
 SONIC TOOL")

31 EFFECT OF PORE SIZE (PERMEABILITY) SONIC TOOL PRINCIPLE WAVE MODES Compressional First Motion Shear Stoneley 7


32 Permeability from Logs and Cores SONIC MEASUREMENT PRINCIPLE ARRAY PROCESSING Waveforms SONIC TOOL PRINCIPLE STONELEY OR TUBE WAVE Amplitude Depends on Formation Permeability 8

33 ACOUSTIC WAVEFORM LOGS The Stoneley wave component can be analyzed to give a permeability value. In the case of fractures in the wellbore the Stoneley waves will be attenuated across an open fracture References: The Geological interpretation of Well Logs pp STONELEY WAVE DERIVED PERMEABILITY INDICATOR Processing with Halliburton s integrated Stoneley attenuation and petrophysical analysis (Reference: Canady equation SPE 96598) Qualitative Stoneley derived permeability magnitude (can be calibrated with cores or MRIL analysis) Open hole only 9

34 Permeability from Logs and Cores PERMEABILITY DERIVATION Texture Coefficient (SIDEWALLS) Permeability not measured directly in the laboratory. Q, A, P, µ and L are measured: k is derived. Two methods of measurement: Steady State Measures actual rate of flow of gas through the sample. Relatively slow for tight rocks but precise. Preferred technique. Unsteady State Uses a mini-well test procedure for very rapid sample analysis. Data is less precise than steady state, particularly in lower permeability samples (<500md) and at stress conditions, where the results can be unreliable. Steady State Permeameter Core Holder LASER PARTICLE SIZE ANALYSIS (LPSA)-DERIVED PERMEABILITY SIDEWALL VS. CONVENTIONAL CORE Texture Coefficient: CORE vs SIDEWALL Texture Coefficient (CORE) Percussion Sidewall samples will include increased fines due to shattering Sidewalls through a cored interval permit correlation of Texture Coefficients Improved Sidewall K results are due to LPSA How sample alteration usually affects data quality. 10
35 LEARNING OBJECTIVES You are now able to: Perform qualitative evaluation of permeability from conventional logging tools Estimate permeability from empirical relationships using log derived data Understand the application of specialized logging tools such as NMR and acoustic waveform for qualitative and quantitative estimation of permeability Identify techniques using core analysis both steady and unsteady state tests to derive permeability 11