Supplementary Information for the Paper Ref. B207765F. Fig. S1 shows the simultaneous TG / DTA curves of the gel-carbonate precipitate.
|
|
|
- Russell Leonard Poole
- 5 years ago
- Views:
Transcription
1 Supplementary Information for the Paper Ref. B207765F Photoluminescence of Sr 2-x Ln x CeO 4+x/2 (Ln = Eu, Sm or Yb) prepared by a wet chemical method. Abanti Nag and T. R. Narayanan Kutty* Thermoanalytical studies Fig. S1 shows the simultaneous TG / DTA curves of the gel-carbonate precipitate. TG of the as-prepared solids after oven drying shows that the mass loss occurs in two steps: (i) initial mass loss of about 5% through the broad range of temperature up to 700 o C is arising due to the removal of water from ceria gel and (ii) the mass loss of about 16% occurs again through the broad range of temperature from 950 to 1100 o C, due to the reaction between CeO 2 and SrCO 3 accompanied by the release of CO 2. The differential thermogravimetry (DTG) [Fig. S1] also shows that the mass loss is complete by 1100 o C. Mass loss measurements were also carried out under isothermal conditions by heating the samples for several hours at selected temperatures. The total mass loss of the as-prepared sample obtained in the present experiments is about 23%. After drying at 120 o C for extended periods, the residue shows the mass loss of 9.5% up to 700 o C, 11% at 950 o C and 2.5% at 1100 o C. This indicates that there is a difference in mass loss between the dynamic (TG / DTA) and isothermal heating conditions. However both the cases clearly indicate that the phosphor formation reactions are over by 1100 o C. The endothermic maximum below 100 o C in DTA curve is due to the loss of water resorbed by the oven-dried samples when handled in air. The shift in the baseline of the DTA curve corresponds to the broad mass loss due to recrystallization
2 2 of the xerogel to crystalline CeO 2. The endotherm at ~900 o C in DTA curve is due to the phase transformation of SrCO 3 from orthorhombic to rhombohedral as it is not associated with any mass loss. The two endothermic maxima at ~950 o C and ~1100 o C in DTA curve correspond to the mass loss due to the release of CO 2 in the TG curves. The appearance of two endotherm may indicate the successive reactions; initially CeO 2 reacts with SrCO 3 and forms Sr 2 CeO 4 as the major phase and SrCeO 3 as an impurity phase. SrCeO 3 further reacts with excess SrCO 3 giving rise to phase pure Sr 2 CeO 4.
3 3 Figure S1. TG-DTA and DTG curves of a composite precipitate of SrCO 3 and hydrated ceria in air at a heating rate of 10 o C min 1.
4 4 XRD studies The sequence of reactions during thermal analyses is studied by identifying the intermediate phases under isothermal heating conditions at selected temperatures for several hours using x-ray diffraction (Fig. S2). XRD pattern of the gel dried at 120 o C [Fig. S2(a)] shows the presence of SrCO 3 as the only crystalline phase. No CeO 2 is detected since it is in the form of amorphous CeO 2.xH 2 O. Heat treatment of the powder at 700 o C [Fig. S2(b)] shows that CeO 2.xH 2 O gel (x 2) is totally converted to CeO 2 with cubic symmetry and appears as a crystalline phase along with SrCO 3. This is also indicated in TG-DTA analyses. The appearance of the XRD reflections of orthorhombic Sr 2 CeO 4 and SrCeO 3 (JCPDS card no ) phases indicate that SrCO 3 starts reacting with CeO 2 even at 700 o C under isothermal condition. The (hkl) values and the relative intensities of Sr 2 CeO 4 phase are calculated using a computer program (LAZY PULVERIX). The crystallographic data and the atomic positions were taken from Danielson et al. 6 As the calcination temperature is increased to 950 o C the XRD pattern [Fig. S2(c)] shows the presence of Sr 2 CeO 4 with orthorhombic symmetry as the major phase although SrCO 3, CeO 2 and SrCeO 3 still remain as minor phases. Further annealing at >1000 o C for extended periods in air, O 2 or N 2 atmosphere leads to the formation of crystalline Sr 2 CeO 4 [Fig. S2(d)] with complete phase purity. However annealing in H 2 atmosphere or heating to temperatures >1300 o C causes the formation of SrCeO 3 phase, indicating that Sr 2 CeO 4 phase is unstable in strongly reducing atmosphere as well as at higher temperatures.
5 5 Figure S2. X-ray diffraction patterns of the sample at (a) 120 o C, (b) 700 o C, (c) 950 o C, (d) 1100 o C shows the evolution of crystalline Sr 2 CeO 4 from the composite powder.

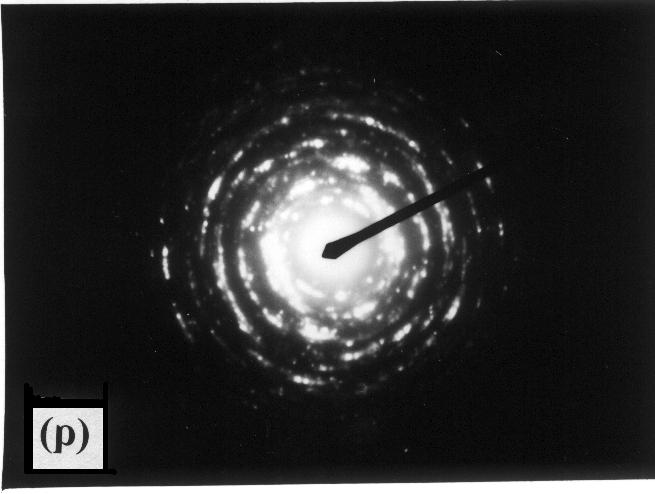
6 6 TEM studies The TEM studies clearly illustrate the composite nature of the precipitates. Fig. S3(a) shows micrograph of the as-prepared powders. The aggregates of the small particles are identified as amorphous hydrated ceria. The appearance of lattice images oriented in the same direction indicates the presence of crystalline SrCO 3 particles, which are embedded within the ceria gel. The corresponding electron diffraction [Fig. S3(b)] shows spotty patterns superimposed with diffused rings, further confirming the presence of two phases in the system, i.e. CeO 2.xH 2 O as the amorphous and SrCO 3 as the crystalline phases. Figure S3. (a) TEM image of composite precipitate of SrCO 3 and hydrated ceria, (b) the corresponding electron diffraction pattern.
7 7
8 8 Photoluminescence of undoped Sr 2 CeO 4 The excitation spectra recorded for the compound Sr 2 CeO 4 at room temperature are presented in Fig. 6 ([FLWDWLRQ VSHFWUXP PRQLWRUHG DW em = 472 nm shows a broad band with two maxima at 282 and 336 nm. The latter appears as a broad and sharp shoulder. The feature of the excitation spectrum remains unchanged when monitored DW em = 456 nm except for the difference in intensity. The emission spectra recorded on exciting at 282 as well as 336 nm show broad band with the maximum in the bluegreen region (FWHM = 3821 cm -1 ) with the extended emission into longer wavelengths. In fact, there are two maxima, one at 456 nm (low intensity) and another high intense band peaking around 472 nm. These bands have been assigned as intraconfigurational Ce 4+ O 2- charge-transfer (CT) transition by Danielson et al 3. There is no overlap between excitation and emission spectra, with a large Stokes shift (8875 cm -1 ). Annealing for longer periods at 1100 o C does not change the general features of excitation nor emission spectra; annealing only increases the intensity, irrespective of the atmosphere. The increase in intensity may be related to the removal of oxygen vacancy related defect centers as reported by Pieterson et al 4.
9 9 Figure S4. Excitation (solig OLQH em LV QP GDVKHG OLQH em is 456 nm) and HPLVVLRQ VROLG OLQH ex LV QP GDVKHG OLQH ex is 336 nm) spectra of Sr 2 CeO 4 recorded at room temperature.