In-Situ Strength by CAPO-TEST
|
|
|
- Asher Hudson
- 5 years ago
- Views:
Transcription
1 1 In-Situ Strength by CAPO-TEST NATO Workshop on load carrying capacity of bridges june, 2015 Høveltegård, Birkerød, Denmark Claus Germann Petersen GERMANN INSTRUMENTS, Inc.
2 2 In-Situ Strength, why? Strength of existing structures for calculation of load carrying capacity Timing of safe and early loading operations Control of effects of transportation, compaction and curing, in-place Quality of the cover layer protecting the reinforcement Low strength of laboratory specimens Changed mixes, intentionally / not intentional
3 3 Evaluation of in-place strength Pull-out test (LOK-TEST and CAPO-TEST) Testing cores Rebound hammer Ultrasound (UPV) Pull-off test Maturity method
4 25 mm 55 mm 25 mm 55 mm 4 LOK-TEST CAPO-TEST 25 mm 25 mm F F


5 5 Examples London, UK Strength of industrial floor Translink, UK, Residual strength of tunnel segments Trinity Square, Toronto, CA, Strength for early loading Bridge Leznow, Poland Residual strength Cigar Lake Uranium Mine, CA Strength of gunite concrete Great Belt Link, Denmark Strength of cover layer
6 6 What is measured in a LOK-TEST and CAPO-TEST?
7 7 Analysis by Jensen & Bræstrup Jensen, B.C. & Bræstrup, M.W.: LOK-Test Determine the Compressive Strength of Concrete, Nordisk Betong, Conclusion: Plastic analysis may be applied to determine the load-carrying capacity of the concrete embedded bolt which is pulled out under application of a counterpressure (LOK-TEST). It is shown that when the angle between the direction of deformation and the failure surface is equal to the angle of friction for the concrete, then the pull-out force is proportional to the concrete compressive strength
8 8 Analysis by Ottosen Ottosen, N.S.: Nonlinear Finite Element Analysis of Pull-Out Test, Journal of the Structural Division, ASCE, Vol. 107, No ST4, April 1981
9 9 Stress curves at 70% loading C L Stresses in MPa (negative when stresses are compressive). Dotted lines gives the direction of the principal stress. Calculations are made for a uniaxial compressive strength of 31.8 MPa. Note the much higher stresses (up to 50 MPa) are present right below the disc due to concentrated tri-axial loading in this area.

10 Compressive cracking, 98% loading, Finite element analysis and experimental analysis Ref.: Ottosen, N.S.: Nonlinear Finite ElelementAnalysis of Pull-Out Test, JSD, ASCE, Vol. 107, No ST4, April 1981 Krenchel, H. & Shah, S.P.: Fracture analysis of the pullout test, Dept. of Structural Engineering, Technical University of Denmark, RILEM, Materials and Structures, Dunod, Nov-Dec no C L C L
11 11 Conclusion by Ottosen It has been shown that large compressive forces run from the disc in a rather narrow band towards the support, and this constitutes the load-carrying mechanism. Moreover, the failure in a LOK-TEST is caused by crushing of the concrete and not by cracking. Therefore, the force required to extract the embedded steel disc is directly dependent on the compressive strength of the concrete.
12 12 Fracture analysis Krenchel, H. & Shah, S.P.: Fracture analysis of the pullout test, Dept. of Structural Engineering, Technical University of Denmark, RILEM, Materials and Structures, Dunod, Nov-Dec no 108 Krenchel, H. & Bickley, J.A. : Pullout Testing of Concrete, Historical Background and Scientific Level Today, Dept. of Structural Engineering, Technical University of Denmark, Nordic Concrete Research, The Nordic Concrete Federation, 1987 Krenchel, H. & Mossing, P.: LOK-Styrkebestemmelse af Beton, Brudmekanisk Analyse, Deprtment of Structural Engineering, Technical University of Denmark, Serie R, No 198, 1985
13 Stress-strain curve from 13 uniaxial compressive test Linearity Compression Softening regime
14 Load displacement curve 14 for pullout test Linearity Compression Softening regime Acoustic Emission
15 98% load level 15

16 Situation at collaps into the softening regime 16
17 17 Explanation 1. At about 30% of the load a circumferential crack is developed at a open angle running from the outer edge of the disc. This is where the liniarity is lost. 2. From thereon multiple microcracks are developed in a compression band between the disc and the counterpressure 3. A collaps happens into the softening regime at increased loading, forming the final pullout cone
18 18 The three different stages of internal cracking in a pullout 2. Band of multiple micocracking to max. load 1. Crack at ~30% load 3. Collaps in the softening regime

19 19 LOK-TEST pullout failure Leave from the second crack pattern with the concrete in compession being intersected in the softening regime Crushed material in the compression zone

20 20 CAPO-TEST pullout failure Leave from the second crack pattern with the concrete in compession being intersected in the softening regime Crushed material in the compression zone
21 NOTE LOK-TEST and CAPO-TEST measure the compressive strength of concrete (2nd crack pattern). This constitute the load-carrying mechanism The tests are NOT testing the tensile, NOR the shear strength, only the compressive strength The tensile crack develops at about 30% of the ultimate load. This crack release stesses in the pullout area. Therefore, pullout values are not affected by inherent stresses in the structure (ref.: Jehrbo Jensen, J.K.: Influences of Stresses in a Structure on the LOK-TEST Pullout Force, AUC, Deptm. of Building Technology and Structural Engineering, Aalborg, Denmark, 1990) 21
22 Jehrbo Jensen, J.K.: Influences of Stresses in a Structure on the LOK-TEST Pullout Force, AUC, Deptm. of Building Technology and Structural Engineering, Aalborg, Denmark, mm cube
23 Clearance Requirements 23 ASTM C900 Insert clearance >150 mm >100 mm 25 mm d b d b or NMSA Reinforcement clearance Edge distance
24 24 Correlations in the laboratory To 150 mm x 300 mm cylinder strength To 150 mm cube strength Pullout (LOK-TEST or CAPO-TEST ) performed on specimens with exactly the same concrete quality as the standard specimens (same concrete mix, same compaction and same curing)
25 Correlation Testing Prepare cylinders (or cubes) Prepare 200 mm cubes with inserts Compact and cure under same conditions 2 x LOK-Test 2 x CAPO-Test
26 26 Cylinder relationships
27 150 mm x 300 mm cylinder (MPa) LOK-TEST to cylinder strength, 1st major correlation Krenchel&Bickley Max aggr size ( 8 mm) Max aggr size (16 mm) Max aggr size (32 mm) Linear fit 95 % confidence intervals fcylinder = 1.20 LOK 4.1 R xy = 0.99 SD = 0.9 MPa LOK-TEST (kn) Aggregate type: Sea Gravel and Granite (for strength > 70 MPa)
28 150 mm x 300 mm cylinder (MPa) 28 CAPO-TEST to cylinder strength, 1st major correlation 1987 Krenchel&Bickley Max aggr. size ( 8 mm) Max aggr. size (16 mm) Max aggr. size (32 mm) Linear fit 95% confidence intervals fcylinder = 1.18 CAPO 3.4 R xy = 0.98 SD = 1.1 MPa CAPO-TEST (kn) Aggregate type: Sea Gravel and Granite (for strength > 70 MPa)
29 Compressive strenght, f cyl (MPa) 150 mm dia x 300 mm Standard Cylinder 18 correlations to cylinder strength correlations between cylinder strength and pullout force compared to the general correlation for cylinders: f cyl = 0.69 F Gay,G. LOK 1-13 MPa Bickley, J. LOK 5-44 MPa Krenchel, H. LOK 3-33 MPa Krenchel, H. LOK 3-33 MPa Krenchel, H. LOK 5-50 MPa Jensen, J. LOK 5-50 MPa Drake, K.D. CAPO MPa Drake, K.D. LOK MPa Poulsen, E. LOK MPa Kierkegaard, P. LOK MPa Lekso, S. LOK MPa Lekso, S. LOK MPa Krenchel, H. CAPO MPa Krenchel, H. LOK MPa McGee, R.L. LOK 6-35 MPa Bickley, J. LOK 3-45 MPa AEC LOK MPa Karthikeyan,H. LOK 8-32 MPa LOK-TEST/CAPO-TEST pullout force F (kn)
30 30 Cube relationships
31 150 mm cubes (MPa) 31 LOK-TEST to cube strength, 1st major correlation Bellander mm cubes (MPa) max. aggregate size 16 mm 150 mm cubes (MPa) max. aggregate size 32 mm Linear fit 95% confidence intervals fcube = 1.55 LOK 2.58 R xy = 0.97 SD = 0.9 MPa LOK-TEST (kn)
32 150 mm cubes (MPa) CAPO-TEST to cube strength, 1st major correlation Bellander mm cubes (MPa) max. aggregate size 16 mm 150 mm cubes (MPa) max. aggregate size 32 mm Linear fit 95% confidence intervals fcube = 1.56 CAPO 3.17 R xy = 0.99 SD = 1.2 MPa CAPO-TEST (kn)
33 Compressive strenght, f cube /f core (MPa) 150 mm standard cube/100 mm dia x 100 mm core correlations to cube strength correlations between cube strength and pullout force compared to the general correlation for cubes: f cub = 0.76 F 1.16 Johansen, R cube/core 8-35 Mpa Gelhard, R. cube MPa Winden, N. cube 3-48 MPa Winden, N. cube MPa Bellander, U. cube/core MPa Bellander, U. core MPa Bellander, U. cube 3-85 MPa Bellander, U. cube 3-85 MPa Worthers, P. cube MPa Moczko, A. core MPa Thun.U core MPa Price, W. F. cube MPa Price, W. F. cube MPa LOK-TEST/CAPO-TEST pullout force F (kn)
34 CAPO-Test, kn 34 CAPO-TEST to LOK-TEST Line of equality LOK -Test, kn Refs: Krenchel (1982), Bellander (1983), Yun (1990), & Meyer (1994)
35 f Compressive Strength, MPa 35 General Correlations f cube = 0.76 F f cyl = 0.69 F General Correlations for Cylinder and Cube Strength F Pullout Load, kn
36 Robust Correlation Not affected by: Cementitious materials Water-cement ratio SCC mixtures Fibers Age Air entrainment Admixtures Curing conditions Age and depth of carbonation Stresses in the structure Shape, type or size of aggregate < 38 mm 36 Lightweight aggregate, however, produce a significantly different correlation
37 Variations 37 Calibration Procedure, laboratory Pullout V n Standard spec. V n Danish 9.4 % % 1177 North American 7.5% % 994 Swedish/Dutch/English 6.8% % 963 Structure, On-site testing LOK-TEST V n CAPO-TEST V n Shotcrete 3.2% 310 Slabs, bottom 10.5% % 35 Slabs, top 12.9% % 623 Beams & Columns 8.1% % 434 Walls & Foundations 10.1% % 534 Dubious Structures 14.7% % 3334 Ref.: Petersen (1994)
38 38 Why is the strength from a 150 mm cube higher than a 150 mm x 300 mm cylinder?

39 39 Effect of End Friction Triaxial Compression Frictional Stresses Zones of triaxial compress ion
40 40 As L/D Decreases Strength Increases
41 CORES The ratio of the maximum aggregate size in the concrete to the diameter of the core has a significant influence on the measured strength when it is greater than about 1:3. Testing a core with a nominal diameter of 100 mm and equal length (L/D=1) gives a strength value equivalent to the strength value of a 150 mm cube manufactured and cured under the same conditions. Testing a core with a nominal diameter at least 100 mm and not larger than 150 mm and with a length to diameter ratio equal to 2.0 gives a strength comparable to a 150 mm by 300 mm cylinder manufactured and cured under the same conditions. Preferred diameter of core is 100 mm


42 42 Cores
43 43 Moisture Gradients Immediately After Wet Drilling Moistened concrete tends to swell Swelling is restrained by dry interior Results in internal stresses; outer region in compression Measured strength is reduced Tension Compression

44 44 Effect of Core Conditioning on Strength CT003
45 45 Moisture Conditioning ASTM C42/C42M Wipe off drilling water, surface dry Place in watertight containers Wait at least 5 days between wetting due to drilling or sawing and testing Other procedure permitted when required by the specifier of tests
46 46 ACI 214.4R for coring In-place strength Correction for L/D Correction for D Correction for moisture content Core strength Correction for damage due to coring Equivalent specified strength f ' c, eq K f c Average in-place strength Statistical factor


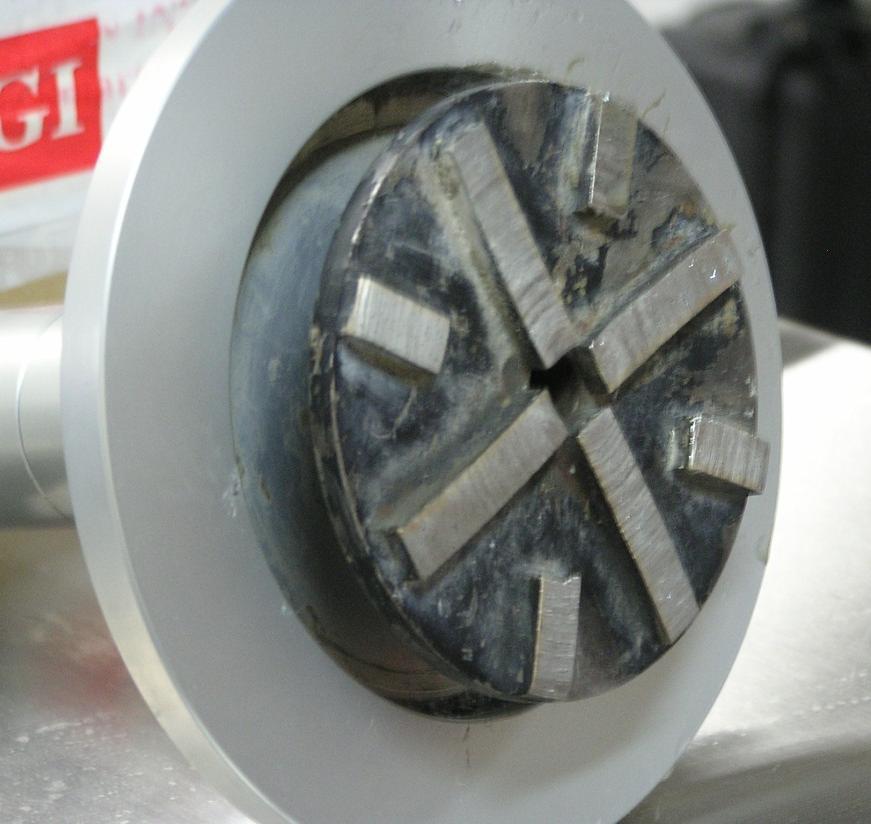
47 47 Capo-Test on shotcrete, Note the failure zone is unaffected by water needed during coring / recessing
48 48 Comparative study Polish bridges for increased loading Cores, sawcut, capped, tested after 5 days drying in lab conditions (100 mm dia x 100 mm cores) CAPO-Test in-situ, double amount of cores Schmidt Hammer in-situ, up to 20 locations, each 6 tests Schmidt Hammer on side of cores prior to compression tests NOTE: All Schmidt Hammer results have been reduced by an Aging Factor of 1.4 recommended by manufacturer


49 CAPO-TESTing on Polish bridges COMA-Meter 49
50 Bridge No. Cores from structure Capo-Test on structure Schmidt Hammer on structure 50 Schmidt Hammer on cores MPa Av. MPa (CT) MPa (L) MPa (LM) of % % % % % % % % % % % % % % % % % % % % % % % % % % % % % % Avg % % Comparative testing, Polish experience, bridges years old, ref. A. Mozcko,, Wroclaw University Note: The Schmidt Hammer results have been reduced by 1.4, the aging factor recommended by the manufacturer

 Schmidt on Structure (MPa) V (%) Schmidt on Cores")


51 Comparative Strength Estimates from Polish Bridges, summary Zglobice Bridge 32 years old Wisna Bridge 35 years old Average Cores (MPa) V (%) CAPO-TEST (MPa) V (%) Schmidt on Structure (MPa) V (%) Schmidt on Cores (MPa) V (%) Strength Carbonation depth: 2 mm - 35 mm Source: Moczko, A.: Comparative Study of In-Situ Strength Measurements on 50 Polish Bridges, University of Wroclaw, Poland, 2007

52 52 Correlation from Polish bridges Data UCL LCL FIt General Fit C core = 0.79 Capo 1.14 R xy = 0.97 Standard deviation = 2.2 MPa Capo-Test (kn)
53 53 Comparison to the general correlation for cubes Note that the correlation found C core = 0.79 Capo 1.14 match closely the general correlation for cubes C cube = 0.76 Capo 1.16 As a 100 mm dia. core, 100 mm long gives a strength equivalent to the strength value of a 150 mm cube, the following general relationship may be applied: C cube = 0.79 Capo 1.14


54 54 Effect of carbonation 100 mm dia x 100 mm core Depth of carbonation Avg. Core 33.9 MPa, Avg.CAPO 33.7 MPa, Diff -0.6% Avg. Carbonation Depth 13.1 mm Ref: Moczko, (2010)
55 55 Considerations using CAPO-TEST Capo-Test depth is 25 mm, samples for coring is taken deeper in the structure Relationships have not been investigated for max. aggregate size > 40 mm Capo-Test seems to be unaffected by depth of carbonation (Polish data) Minimum distance to edges and corners of 100 mm has to be observed Minimum distance from the strut to reinforcement ~ 10 mm
56 56 Consideration Quality of the cover layer protecting the reinforcement on new structures using modern concrete mixes: Experience has shown that cover layer testing with pullout may give up to 20% - 30% reduction of the strength compared to cores or standard laboratory specimens. Experience has also shown that the electrical conductivity of the cover layer is increased 40%-50%, indicating a negative effect on the cover layer from insufficient compaction and/or curing conditions on-site, increasing the chloride permeability. To check this effect, LOK-TEST inserts may be embedded deeper in the structure, and surface planing prior to CAPO-TEST may be done at a required depth.
57 57 CAPO-Test advantages Does not require pre-planning test locations Can perform test at any accessible location Permits testing of existing structures minutes per test Test results immediately available Cause only a small fracture cone hole compared to a 100 mm coring hole. Portable equipment (electricity and water is needed)
58 58 CAPO-TEST Procedure

59 59 CAPO-TEST Pullout
60 60 Prepare Concrete 1. Core hole 18.4 mm dia. 2. Plane surface 100 mm dia. r 25 mm 18 mm 25 mm 10 mm 3. Cut slot Dia 25 mm


61 61 Core Hole

62 62 Plane surface

63 63
64 64 Cut Slot 25 mm
65 65 Cut Slot
66 66 Cut Slot
67 67 Insert Expansion Cone and Coiled Split-Ring Coiled ring Cone


68 Ring Expansion Hardware 68 Nut Coiled ring Cone
69 69 Expand Ring Nut

70 70 Expand Ring
71 Pullout the Expanded Ring against a 55 mm counterpressure 71

72 72 Apply Pullout Force

73 73 Acceptable Test Sharp 55 mm diameter edge from counterpressure

74 74


75 75 CAPO Equipment Prep. Kit Pullmachine DSV Kit with Surface Planner Inserts
76 76 EN : 2005: The correlation between strength and pullout force for the apparatus being used should be established experimentally. It has been shown that for a given type of apparatus the relationship between pullout force and compressive strength is similar over a wide range of concretes and that a general correlation can be used with reasonable accuracy ASTM C : For a given concrete and a given test apparatus, pullout strengths can be related to compressive strength test results..before use, these relationships must be established for each test system and each new concrete mixture
77 77 Summary Pullout test is a reliable method for estimating in-situ compressive strength of the cover layer Can be used for new construction and existing construction General correlations according to EN : 2005 Following ASTM C confirm general correlations for LOK-Test For CAPO-Test cores can be drilled out for comparison to the general correlation


78 78 Other systems intending to estimate compressive strength in-situ Rebound Hammer Ultrasound (UPV)
79 Core Strength, MPa Rebound number to cores, mix specific Ward, M.A. and Langan, B.W., Cement Concrete and Aggregates, 16(2), Dec. 1994, n = Core Strength Upper 95 % CL Lower 95 % CL Rebound Number
80 80 Factors Affecting Rebound Number Strength and elastic modulus of concrete near to surface Aggregate type dependence Thickness of carbonation zone Surface texture Surface moisture condition Rigidity of test object
81 Core Strength, MPa 81 Comparison of Relationships Case 1 Case Rebound Number
82 82 Rebound Hammer related to cube strength Average relationships shown for granite and limestone aggregates and curing conditions (water and air) Ref: Tam, C.T.: Application of NDT in Appraisal of Buildings, 4th Int. l Conf. On Inspection, Appraisal, Repair and Maintenance of Buildings & Structures, March, 1995, Hong Kong
83 83 Strength Relationship UPV Physics: V E Empirically: E f c f c f c V 4 For mature concrete, large increase in strength is accompanied by small increase in velocity, mix specific. Velocity
84 Compressive Strength, MPa 84 Relationship for a specific mix day 7day 15 1 day Pulse Velocity, m/s
85 85 Factors Affecting UPV for Given Concrete Strength Aggregate type Aggregate content Moisture content Saturated concrete 5 % greater UPV than dry Presence of reinforcement Perpendicular to pulse path Parallel to pulse path

86 Ref: Bungey, 1982 Example Aggregate Type
87 87 UPV (Ultrasound Pulse Velocity) related to cube strength Average relationships shown for granite and limestone aggregates and curing conditions (water and air) Ref: Tam, C.T.: Application of NDT in Appraisal of Buildings, 4th Int. l Conf. On Inspection, Appraisal, Repair and Maintenance of Buildings & Structures, March, 1995, Hong Kong
88 88 Evaluation techniques by Pullout test Testing cores Rebound hammer UPV Pull-off test Maturity method are dealt with in detail at our NDT Workshops as well as other advanced NDT Methods
89 89 Thank you for your attention