Presentation 5 th ISLFD Annual Meeting 30 th March Dr. Heiko A. Schiffter IBME Oxford
|
|
|
- Claude Stevenson
- 5 years ago
- Views:
Transcription
1 Lyophilization of Proteins FTIR-Guided Formulation Development Dr. Heiko A. Schiffter (until 30 th April 2012)
2 Table of contents Part 1: FTIR Microscopy and Chemical Imaging Idea and Objective FTIR protein spectrum and analysis Multivariate data analysis In situ freeze-drying formulation development In situ study of phase separation Part 2: Multiphoton Microscopy MPM and FD Microscopy Setup 3D Imaging of FD stage samples using MPM 3D Imaging of Phase Separation using MPM In-situ Study of Phase Separation using MPM Summary and Conclusions
3 Part I : FTIR Microscopy and Chemical Imaging Idea and Objective FTIR protein spectrum and analysis Multivariate data analysis In situ freeze-drying formulation development In situ study of phase separation


4 The Background Idea Part 1: FTIR spectroscopy Spray-drying is a complex drying process in regards to the drying kinetics and product morphology Single Droplet Drying of proteins and protein formulations via acoustic levitation for the determination of drying kinetics and product characteristics in spray-drying What is acoustic levitation?


5 The Background Idea Single Droplet Drying using acoustic levitation for drying kinetics analysis A better understanding for the product at hand Part 1: FTIR spectroscopy micrometer screw levitation chamber transducer piezo-crystal CCD-camera back light illumination bellows macrolens sample to PC with imaging software reflector micrometer screw Controlled evaporation mixer CEM air flow liquid flow Today used by GEA Niro
6 Part 1: FTIR spectroscopy Formulation of Biopharmaceuticals McNally, E.J. and Lockwood, C.E., The importance of a thorough preformulation study (illustrated by Leigh Rodano, BI Pharmaceuticals, Inc.)
7 Freeze-drying basics Part 1: FTIR spectroscopy Freeze-drying is a complex multistage process Risk of product instability during each process step! (Freeze-concentration, phase separation, interfacial adsorption, dehydration) Objective: To develop a tool for the in-situ study of product stability and excipient behaviour at the small scale during freeze-drying
")

8 Part 1: FTIR spectroscopy FPA-FTIR FTIR freeze-drying microscopy system FTIR microscope with focal plane array (FPA, 64 x 64) detector Integrated miniature freezedrying system Sample & Spacer Vacuum Objective CaF2 window CaF2 Cover Slips Casing Thermal Stage CaF2 window


9 FTIR protein spectrum Part 1: FTIR spectroscopy Qualitative and quantitative information about the protein secondary structure is obtained from the Amide bands of the infrared spectrum α-helix β-sheet Absorbance further vibrations Wavenumber [cm -1 ]
10 FTIR protein spectrum analysis Part 1: FTIR spectroscopy Analysis methods: Subtraction spectrum Area of overlap 2 nd derivative spectrum No quantitative secondary structure data Peak fitting (Gaussian curve fitting) Time intensive and highly subjective Abs sorbance [AU] Amide I band observed Amide I band generated Peak 1 Peak 2 Peak 3 Structure Wavenumber [cm -1 ] Peak 4 α-helix β-sheet unordered turn Wavenumber [cm -1 ]
11 FTIR- spectra evaluations using multivariate data analysis Part 1: FTIR spectroscopy Objective and fast approach towards spectra evaluation by multivariate data analysis using a partial least square (PLS) algorithm Relates a known concentration (here amount of secondary structure) to absorbencies to generate a calibration curve Quantitative decomposition technique Decomposes spectral data and structural content into two sets of vectors (variance spectra eigenvectors) and scores (critical shapes loading factors) As spectral information and secondary structure are connected, the two sets of scores can be related to each other by regression and a calibration model can be constructed. Spectral decomposition and regression are performed in one step
12 Part 1: FTIR spectroscopy Multivariate data analysis - pure component spectra α-helix ( cm - 1 ) Intramolecular β-sheet ( cm - 1 and cm - 1 ) Intermolecular β-sheet ( cm - 1 ) Abs sorbance Carboxypeptidase A Concanavalin A HSA Chymotrypsin Insulin Wavenumber Abso orbance α helix intramol. β-sheet intermol. β-sheet Wavenumber
13 Part 1: FTIR spectroscopy Protein α-helix (actual) α-helix (calculated) intra β-sheet (actual) intra β-sheet (calculated) inter β-sheet inter β-sheet (actual) (calculated) alkaline phosphatase 36.21% 37.68% 34.49% 35.15% 4.26% 4.66% bovine serum albumin 69.64% 71.19% 17.39% 13.95% 1.78% 2.28% carbonic anhydrase 14.05% 15.99% 46.29% 47.59% 7.15% 6.44% carboxypeptidase A 35.04% 37.45% 28.18% 27.74% 6.56% 6.03% catalase 35.86% 32.32% 38.91% 36.55% 6.64% 6.69% concanavalin A 0.00% 0.00% 60.45% 63.89% 9.45% 9.70% α-chymotrypsin 10.00% 13.61% 49.00% 52.47% n/a 5.59% β-galactosidase 42.78% 39.51% 36.05% 35.47% 3.63% 4.72% glucagon 59.12% 57.15% 15.88% 17.05% 0.42% 0.23% haemoglobin 74.68% 79.59% 10.63% 10.64% 2.79% 2.09% human serum albumin 74.48% 48% 77.62% 13.81% 10.76% 0.57% 1.00% insulin 56.14% 51.23% 23.92% 22.46% 5.00% 4.79% lactate dehydrogenase 56.81% 61.39% 25.32% 23.46% 2.92% 1.94% lysozyme 51.92% 49.57% 21.84% 21.84% 4.17% 4.03% myoglobin 80.71% 78.04% 9.68% 12.56% 2.25% 2.28% ribonuclease A 24.78% 23.39% 39% 40.26% 42.09% 2.92% 3.65%
14 Part 1: FTIR spectroscopy Multivariate data analysis - FTIR calibration curves calculated [%] α-helixα e r = actual [%] calculated [%] Intramolecular β-sheetβ r = actual [%] 10 intermolecular β-sheet 8 calculated r = actual
15 Part 1: FTIR spectroscopy In-situ freeze-drying formulation development 20 C 30mins -40 C 2 nd Drying Freezing 1 C/min 1 C/min 1 60mins st Drying 1 C/min 20 C 60mins 27 C 60mins 100mTorr 100mTorr Absorb bance [AU] Chymotrypsin (unformulated) 20 mg/ml; freezing rate: 025 C/min 0.25 and 1 C/min; Sample volume: 2.5 μl unprocessed cooled at 0 C frozen at 1 C/min frozen at 0.25 C/min freeze-thawed Wavelenth [cm -1 ] α-helix Intramol β-sheet Intermol β-sheet Unprocessed 13.6% 52.5% 5.6% Cooled 0.2% + 0.3% +/ 0% Frozen at (1 C/min) Frozen at (0.25 C/min) After freeze- thawing at 0.25 C/min 3.2% 2.9% + 4.2% 4.8% 3.0% + 5.9% 1.9% 1.1% + 1.9%
16 Part 1: FTIR spectroscopy In-situ freeze-drying formulation development 20 C 30mins -40 C 2 nd Drying Freezing 1 C/min 1 C/min 1 60mins st Drying 1 C/min 20 C 60mins 27 C 60mins 100mTorr 100mTorr Chymotrypsin yp (unformulated) 20 mg/ml; freezing rate: 0.25 C/min; sample volume: 2.5 μl Absor rbance [AU] unprocessed frozen at -40 C freeze-dried rehydrated α-helix Intramol β-sheet Intermo l β- sheet Unprocessed 13.6% 52.5% 5.6% Frozen at 0.25 C/min 4.8% 3.0% + 5.9% Freeze-dried 6.6% 3.1% + 8.2% Wavelength [cm -1 ] Rehydrated 3.2% 2.1% + 4.1%
17 Part 1: FTIR spectroscopy In-situ freeze-drying formulation development Absorb bance [AU] C 30mins -40 C 2 nd Drying Freezing 1 C/min 1 C/min 1 60mins st Drying 1 C/min 20 C 60mins 27 C 60mins 100mTorr 100mTorr Chymotrypsin yp (formulated) 20 mg/ml; concentration excipients: 30 mg/ml; freezing rate: 0.25 C/min and 1 C/min; sample volume: 2.5 μl unprocessed cooled at 0 C frozen at 1 C/min frozen at 0.25 C/min freeze-thaw Wavelength [cm -1 ] α-helix Intramol β-sheet Intermo l β- sheet Unprocessed 13.6% 52.5% 5% 56% 5.6% Cooled 0.2% + 0.2% +/ 0% Frozen at 1 C/min Frozen at 025 C/ 0.25 C/min 1.9% + 0.3% + 0.4% 2.9% 1.6% + 3.1% After freeze- thawing at 0.5% 0.2% + 0.7% 0.25 C/min
18 Part 1: FTIR spectroscopy In-situ freeze-drying formulation development 20 C 30mins -40 C 2 nd Drying Freezing 1 C/min 1 C/min 1 60mins st Drying 1 C/min 20 C 60mins 27 C 60mins 100mTorr 100mTorr Chymotrypsin (formulated) 20 mg/ml; concentration excipients: 30 mg/ml; freezing rate: 0.25 C/min; sample volume: 2.5 μl rbance [AU] Abso unprocessed frozen at 0.25 /min freeze-dried rehydrated α-helix Intramol β-sheet Intermo l β- sheet Unprocessed 13.6% 52.5% 5.6% Frozen at 0.25 C/min 2.9% 1.6% + 3.1% Freeze-dried 3.5% 2.1% + 4.5% Wavelength [cm -1 ] Rehydrated 1.1% 0.4% + 1.0%
19 Part 1: FTIR spectroscopy In-situ freeze-drying formulation development 20 C 30mins -40 C 2 nd Drying Freezing 1 C/min 1 C/min 1 60mins st Drying 1 C/min 20 C 60mins 27 C 60mins 100mTorr 100mTorr 20mg/ml rh albumin in 145 mm NaCl solution at ph 7.1, 7 1 with 30mM 5% w/w Octanoate, Sucrose 15µg/L Polysorbate 80 Solution at 20 C 100% Solution at 20 C 100% Solution at 20 C 100% Frozen at -40 C 89.36% Frozen at -40 C 90.70% Frozen at -40 C 95.46% Dried at 20 C 91.82% Dried at 20 C 92.37% Dried at 20 C % 20mg/ml rh albumin in 145 mm NaCl solution 20mg/ml rh albumin in 145 mm NaCl solution, with 15µg/L T80 & 30mM Octanoate 20mg/ml rh albumin in 145 mm NaCl solution, with 5% w/wsucrose th Stucture Chang ge Compared wit Solution at 20 Degree C (%) Frozen (at -40 Degree C) Dried (at 20 Degree C) Physical States
20 Part 1: FTIR spectroscopy Comparison of formulations before & after FD 7.0 Loss of alpha-helix structure (%) Shift of fluorescence emission (nm) Increase in aggregate content t (%) 7.0 Loss of alpha-helix structure (%) Shift in fluorescence emision (nm) Increase in agregate conten (%) rha 50 rha 20 rha+suc 50 rha+treh (f) rha 50 (f) rha 50 (f) rha+suc 50 (f) rha+treh Comparison of defatted rh albumin at 20 mg/ml, 50 mg/ml, 50 mg/ml with 5% (w/v) sucrose, and 50 mg/ml with 5% (w/v) trehalose, (alpha-helix, fluorescence emission and aggregate, before and after freeze-drying) Comparison of formulated rha at 20 mg/ml, 50 mg/ml, 50 mg/ml with 5% (w/v) sucrose, and 50 mg/ml with 5% (w/v) trehalose, (alpha-helix, fluorescence emission and aggregate, before and after freeze-drying)


21 28.7 C 25.9 C T C and Tg Determination Example: 50 mg/ml rh albumin formulated with 50 mg/ml trehalose Part 1: FTIR spectroscopy 23.8 C 21.2 C Tg C


 PEG")


22 Part 1: FTIR spectroscopy In-situ study of phase separation during lyophilization 20 C 30mins -40 C 1 Freezing 1 C/min 1 C/min st Drying 1 C/min 60mins -27 C 60mins 100mTorr 2 nd Drying 20 C 60mins 100mTorr 5% (w/w) PEG 4000 and 5% (w/w) Dextran 500 kda in 145 mm NaCl solution at ph 7.1 Visible light image of freeze-dried mixture of PEG 4000 and Dextran 500 FPA-FTIR image of Dextran 500 distribution within the freeze-dried mixture FPA-FTIR image of PEG 4000 distribution within freeze-dried mixture


 PEG 4000 and 5% (w/w)")


23 Part 1: FTIR spectroscopy In-situ study of phase separation during lyophilization 20 C 30mins 1 Freezing 1 C/min 1 C/min st Drying 1 C/min -40 C 60mins -27 C 60mins 100mTorr 20 mg/ml rh albumin in 145 mm NaCl solution at ph 7.1, 5% (w/w) PEG 4000 and 5% (w/w) Dextran 500 kda 2 nd Drying 20 C 60mins 100mTorr PEG rich area Dextran rich area FPA-FTIR image of distribution of Dextran 5000 within freeze-dried mixture FPA-FTIR image of distribution of Recombumin within freeze-dried mixture Visible light image of freeze-dried mixture of PEG4000 and Dextran 500 FPA-FTIR image of distribution of PEG4000 within freeze-dried mixture Mix area
24 Part 1: FTIR spectroscopy In-situ study of phase separation during lyophilization 20 C 30mins -40 C 1 Freezing 1 C/min 1 C/min st Drying 1 C/min 60mins -27 C 60mins 100mTorr 20 mg/ml rh albumin in 145 mm NaCl solution at ph 7.1, 5% (w/w) PEG 4000 and 5% (w/w) Dextran 500 kda 2 nd Drying 20 C 60mins 100mTorr PEG rich area Dextran rich area Mix area Amide 1 region of rh albumin at different sample position


25 Part 1: FTIR spectroscopy In-situ study of phase separation during lyophilization 20 C 10mins -40 C 1 Freezing 1 C/min 1 C/min st Drying 1 C/min 60mins -27 C 60mins 10mTorr 2 nd Drying 20 C 60mins 10mTorr Dextran Protein Protein PEG PEG -20 C -40 C Protein 2 nd nd Structural Change Visible Distribution
26 Part II : MPM Microscopy MPM and FD Microscopy Setup 3D Imaging of FD stage samples using MPM 3D Imaging of Phase Separation using MPM In-situ Study of Phase Separation using MPM
27 Part 2: Multiphoton Microscopy Multiphoton Microscopy & Freeze-Drying Microscopy System Set-up MPM Laser Adjust System Laser Control System Cyrostage Control System Cyrostage MPM Control System LN2 Tank


28 Part 2: Multiphoton Microscopy 3D Imaging I i off samples l in i a cryostage using MPM 33µm 3D MPM images of freeze-dried mixture of 10% w/v FITC-PEG5000 and 10% w/v Cascade Blue dextran (10 kda) (size 207 μm 207 μm, μm resolution μm μm 0.5μm). 0 5μm) Presentation 5th ISLFD Annual Meeting 30th March 2012


 Frozen and annealed for")


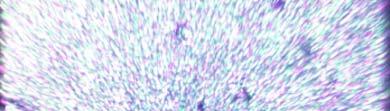
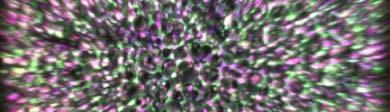
29 3D Imaging of Phase Separation during Freeze-Drying Part 2: Multiphoton Microscopy Freeze-Dried Sample 10% w/v FITC-PEG % w/v TRITC-dextran155,000 (Size 621μm 621μm, resolution 0.6 μm 0.6μm 1.5μm) Frozen and annealed for 240mins at -40 C 10% w/v FITC-PEG % w/v Cascade Blue dextran 10, mg/ml Texas Red BSA (Size 621μm 621μm, resolution 0.6 μm 0.6μm 1.5μm) Frozen and annealed for 240mins at -40 C 10% w/v FITC-PEG % w/v Cascade Blue dextran 10, mg/ml Texas Red BSA (Size 148μm 148μm, resolution 0.145μm 0.145μm)
 Presentation 5th ISLFD Annual Meeting 30th March")
30 Part 2: Multiphoton Microscopy In--situ Study In S off Phase Separation S using MPM Freeze-Drying Cycle with Annealing at -9 C for 240 mins 10% w/v FITC-PEG % w/v Cascade Blue dextran 10, mg/ml Texas Red BSA Visible Light Pictures 1000μm 1000μm (Resolution 1μm 1μm) Presentation 5th ISLFD Annual Meeting 30th March 2012


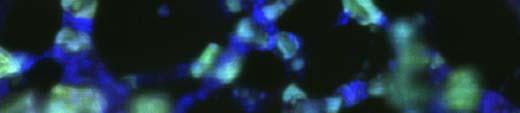
31 Part 2: Multiphoton Microscopy In--situ Study In S off Phase Separation S using MPM Freeze-Drying Cycle with Annealing at -9 C for 240 mins 10% w/v FITC-PEG % w/v Cascade Blue dextran 10, mg/ml Texas Red BSA 3D MPM Images 621μm 621μm (Resolution 0.6 μm 0.6μm 1.5μm) Presentation 5th ISLFD Annual Meeting 30th March 2012 Zoom-In MPM Slice Images 148μm 148μm (Resolution 0.145μm 0.145μm)
32 Summary and conclusions FTIR spectroscopy can be used for a range of protein applications including the formulation development for freeze-drying Multivariate data analysis by PLS algorithm provides a rapid and objective way of quantitative evaluation of protein FTIR spectra The combination of FTIR and freeze-drying microscopy enables the in-situ study of protein stability during lyophilization in the small scale MPM enables to look into the pore formation and structure during freeze-drying Both, FTIR microscopy and MPM are expensive specialist techniques and relatively complicated data analysis techniques are necessary Only ultra small scale analysis possible and the question in regards to scalability is so far unanswered Final question: Will this ever be used wide spread?


33 Acknowledgements Dr. Renchen Liu Mr Vivasvat Kaul Prof. Zhanfeng Cui Prof. Geoffrey Lee Dr. Sebastian Vonhoff Mr Felix Wolf Phil Morton Institute of Biomedical Engineering, University of Oxford Division of Pharmaceutics, University of Erlangen Thank you very much for your attention