A Desalination Battery
|
|
|
- Julian Doyle
- 5 years ago
- Views:
Transcription
1 SUPPORTING INFORMATION A Desalination Battery Mauro Pasta 1, Colin D. Wessells 2, Yi Cui 2,3 and Fabio La Mantia 1, 1 Analytische Chemie Zentrum für Elektrochemie, Ruhr-Universität Bochum, Universitätsstr. 150, D Bochum, Germany. 2 Department of Materials Science and Engineering, Stanford University, Stanford, CA, 94305, USA. 3 Stanford Institute for Materials and Energy Sciences, SLAC National Accelerator Laboratory, 2575 Sand Hill Road, Menlo Park, California 94025, USA. corresponding author (fabio.lamantia@rub.de)
2 1. Synthesis and characterization of the Na + capturing electrodes Sodium manganese oxide, Na 2 Mn 5 O 10, was synthesized by soaking cotton in an aqueous solution of NaNO 3 (0.2 M) and Mn(NO 3 ) 2 (0.5 M). The cotton was then wrung out and heated in air in a Lindberg Moldatherm Box Furnace (Fischer Scientific) at a rate of 100 ºC h -1 to a final temperature of 750 ºC. This temperature was sustained for 24 hours, and then the material was allowed to cool to room temperature. The resultant powder was characterized with X-ray powder diffraction measurements using an X-ray diffractometer (XRD, Rigaku, D/MAX-IIIC X-ray diffractometer, Tokyo, Japan) with Cu KR radiation (λ = nm at 45 kv and 40 ma). Representative XRD patterns are shown in Figure S1. This pattern corresponds to a mixture of phases, primarily composed of the monoclinic Na 2 Mn 5 O 10 phase, as reported by Parant, et al in 1971 (1), but with additional minority phases of both Na 2 Mn 3 O 7 and Mn 2 O 3 (2). These phases appear also in the previously cited works; however, they seem to be electrochemically inert in the conditions under which our experiments were performed. The powder was also thoroughly ground for Scanning Electron Microscopy imaging to determine the average particle size and particle morphology. SEM measurements were performed on a FEI XL30 Sirion microscope on uncoated powder samples. Images were recorded at 5 kv with a secondary electron beam. 2. Electrode preparation and electrochemical characterization Na 2 Mn 5 O 10 and Ag based electrodes were prepared by mixing the as synthesized powder of Na 2 Mn 5 O 10 or Ag microparticles (Sigma Aldrich) (85% wt.) with Super-P (Timcal) (8% wt.) and PVdF (7% wt.). The mixture was ball milled with a methyl methacrylate ball and vial for 1 hour. N-methyl pirrolidone (NMP) was added to the powders. The resulting slurry was stirred
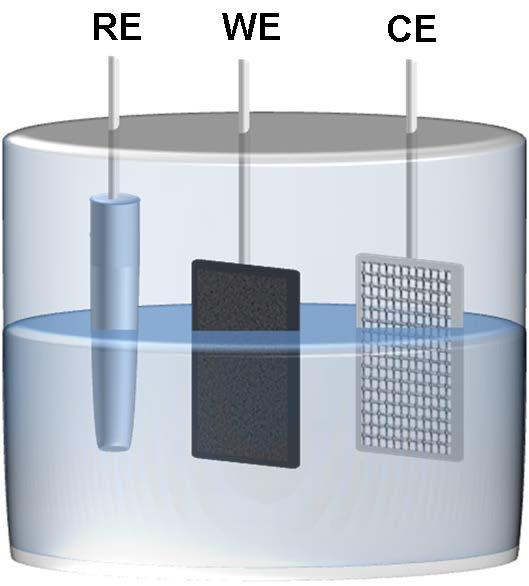
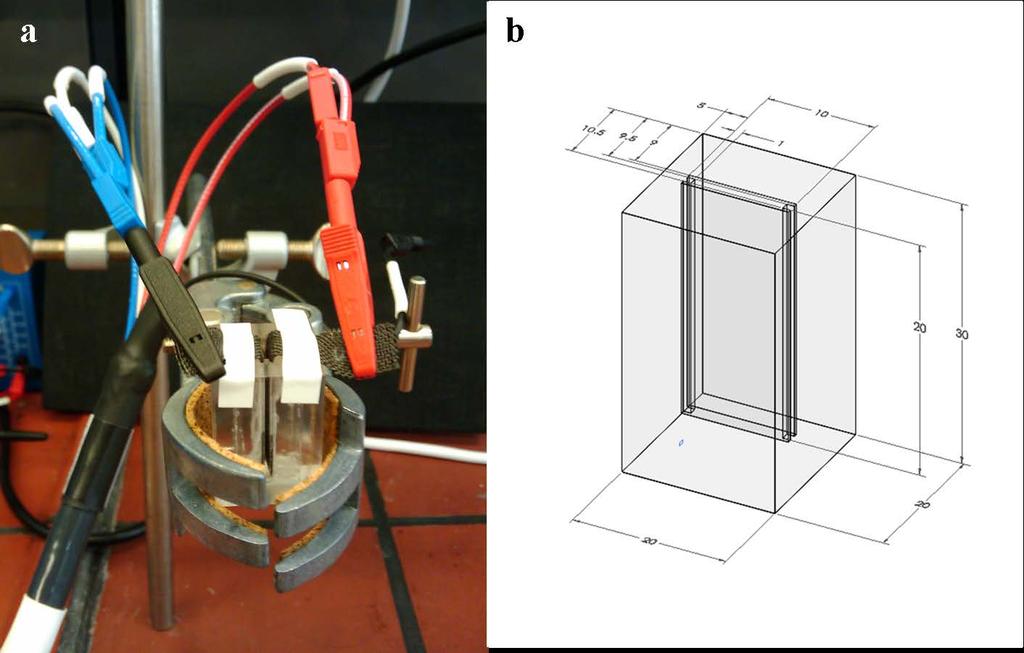
3 overnight and successively drop cast onto a carbon cloth (CC) based current collector. The use of the carbon cloths is related to its high corrosion resistance in chloride environment, low reactivity towards oxygen in solution, and the possibility to reach a high mass loading (mg/cm 2 ). After drying in oven at 100 C for 1 hour, the electrode was ready to be tested in the electrochemical cell. The electrochemical characterization was carried out in a three electrode cell (Figure S2). The silver based electrode (chloride capturing electrode) was employed as the counter electrode (CE), Na 2 Mn 5 O 10 based electrode (sodium and lithium ion capturing electrodes respectively) as working electrodes (WE) and Ag AgCl KCl (3.5 M) as the reference electrode (RE). In the presence of the reference electrode, both working and counter electrode potentials can be monitored. The geometrical electrode surface area in contact with the solution was 2 cm 2. The technical drawing of the desalination cell is reported in Figure S3b. The cell is divided in three compartments, two for holding the anionic and the cationic electrodes, supported on carbon cloth, and the third one for the electrolyte solution. The total immersed length of the electrodes is 20 mm, while the broadness is 10 mm, giving a total apparent surface area of 2 cm 2 exposed to the solution. The electrolyte compartment is 20 mm deep and 8 mm broad, to avoid that the two electrodes can come into contact, and therefore short-circuit the system. The total volume of the cell is equal to 360 μl; the standard test requires around 300 μl of electrolyte, the remaining part being occupied by the solid part of the electrode.
4 3. Chemical Analysis The ions composition has been analyzed by WESSLING Laboratorien GmbH. Here it follows the experimental conditions. Abbreviation Norm Executive location Metals / elements in water (ICP-OES / ICP-MS) ISO / ISO A Environmental Analysis Altenberge Sulfates in water EN ISO D19/D20A Environmental Analysis Bochum Chlorides in water EN ISO A Environmental Analysis Bochum References 1. J. P. Parant, R. Olazcuaga, M. Devalette, C. Fouassier, P. Hagenmuller, J. Solid State Chem. 3, 1 (1971). 2. F. M. Chang, M. Jansen, Zeitschrift für anorganische und allgemeine Chemie 531, 177 (1985).
5 Figure Captions Figure S1: XRD pattern of the prepared sample. Impurities of Mn 2 O 3 are marked with *. Figure S2: Schematic of cell geometry, showing the silver electrode (CE), Na 2 Mn 5 O 10 electrode (WE), and reference electrode (RE). Figure S3. Desalination cell employed in our measurements. Cell volume is 200 µl the distance between the electrodes 1 mm. The compact design is dictated by the low capacity of the NMO electrode. (a) Real picture (b) Schematic of cell geometry, all the values given in mm.
6 Figure S1
7 Figure S2
8 Figure S3