CHAPTER 4 DURABILITY STUDIES ON PMMFRHPC
|
|
|
- Frederica Hill
- 5 years ago
- Views:
Transcription
1 65 CHAPTER 4 DURABILITY STUDIES ON PMMFRHPC 4.1 GENERAL This chapter presents the durability aspects of Polyolefin Macro-Monofilament Fibre Reinforced High Performance Concrete. The experimental studies on durability properties of PMMFRHPC, such as void permeability, water absorption, permeability, acid resistance, impact resistance, drying shrinkage, Rapid Chloride Penetration Test (RCPT), and corrosion resistance -impressed current voltage test were carried out. The results of durability studies of properties of PMMFRHPC have been discussed. Mathematical models for the durability studies of concrete are also developed and validated. 4.2 EXPERIMENTAL PROGRAMME Materials Used The various materials (Cement, Fly ash, Metakaolin, Fine aggregate, Coarse aggregate, Water, Superplasticizer and Polyolefin macro-monofilament fibre) used for the experimental investigation were given under Mix Proportioning Mix proportioning was done based on ACI 211.4R-08 Guide for selecting proportions for high strength concrete with Portland cement and
2 66 other cementitious materials. The summary of mix proportions used for experimental investigation was discussed under and presented in Table Details of Test Specimens The experimental investigation of PMMFRHPC was done under three Phases as shown in Figure 1.1. The summary of the cast specimens for durability studies are given in Table 4.1. Table 4.1 Details of the Specimen Cast for Durability Studies Sl. No. Shape Dimensions in mm Number of Specimens Cast Age in Days 1. Cube 100 x 100 x ,56 and Cube 100 x 100 x ,56 and 90 Type of Test Carried Out Voids Permeability Water Absorption 3. Cube 100 x 100 x ,56 and 90 Permeability 4. Cube 100 x 100 x ,56 and Disc 152 diameter 63.5 height 63 28, 56 and Prism 285 x 75 x , 56 and Cylinder 8. Cylinder 100 diameter 200 height 100 diameter 200 height Total specimens 321 H 2 SO 4 HCl Impact Resistance Drying Shrinkage 45 28, 56 and 90 Chloride Ions 45 28, 56 and 90 Corrosion Resistance
3 Voids Permeability In the present investigation, percentage of water absorption and percentage of permeable voids were determined as per the procedure given in ASTMC The absorption and permeable voids were determined using 100 mm cubes. Saturated surface dry cubes were kept in a hot air oven at 105 o C till a constant weight was attained. The ratio of the difference between the mass of saturated surface dry specimen and the mass of the oven dried specimen at 105 o C to the volume of the specimen (1000 ml.) gives the permeable voids in percentage as given in the Equation (4.1): Permeable voids = [(A B)/V] x 100 (4.1) where, A = weight of surface dried saturated specimen after 28 days. B = weight of oven dried specimen in air. V = volume of sample (considered as 1000 ml). The oven dried cubes after attaining constant weight were then immersed in water and the weight gain was measured at regular intervals until a constant weight was reached. The absorption at 30 min. (initial surface absorption) and final absorption (at a point when the difference between two consecutive weights at 12 hours interval, almost negligible) were determined. The final absorption in all cases was determined at 96 hours. The absorption characteristics indirectly represented the volume of pores and their connectivity Water Absorption Saturated Water Absorption (SWA) Test was carried out on 100 mm cube specimens at the age of 28, 56 and 90 days of curing as per
4 68 ASTM C The specimens were weighed before drying. The drying was carried out in a hot air oven at a temperature of 105 o C. The drying process was continued, until the difference in mass between two successive measurements at 24 hours interval agreed closely. The dried specimens were cooled at room temperature and then immersed in water. The specimens were taken out at regular intervals of time, surface dried using a clean cloth and weighed. This process was continued till the weights became constant (fully saturated). The difference between the saturated mass and oven dried mass expressed as a percentage of oven dry mass gives the saturated water absorption Permeability The test was conducted as per IS The permeability test setup is shown in Figure 4.1. The equipment comprises of three cells, each square in cross section mounted on stands. These cells were connected with connecting pipe through valve. A pressure regulator was mounted on a pressure chamber with two pressure gauges one 0-20 kg/cm 2 gauge and the other 0-15 kg/cm 2. First one showed the input pressure and the second showed the test pressure. The pressure was regulated by turning the handle of pressure regulator in the clockwise direction to the desired pressure. A pressure chamber fitted with a Schrader valve water inlet for pouring water and valve provided as a water source. Standard cubes of 150 mm size were cast and cured for 28, 56 and 90 days. After the curing period, it was taken out and allowed to dry for two days and the four faces of the cube were painted to prevent penetration of water from sides. Then the top surface was effectively sealed to achieve water tightness. Glass bottles were kept in bottom position to collect the water percolating through the specimen. Compressor was started and the pressure equal to 0.5 MPa/second was applied to the water column. The quantity of water passing through the cube
5 69 was collected at the bottom, in the glass bottle through the funnel being maintained in humid atmosphere to prevent losses due to evaporation. The operating pressure, quantity of water collected, time of observation etc., at intervals were recorded. The test was conducted till the uniform rate of flow was obtained. The co-efficient of permeability was then calculated. Figure 4.1 Permeability Test setup Acid Resistance The chemical resistance of the concrete was studied through chemical attack by immersing the specimens in an acid solution. After 28 days period of curing, the specimens were removed from the curing tank and their surfaces were cleaned with a soft nylon brush to remove weak reaction products and loose materials from the specimen. The initial weights were measured and the specimens were identified with numbered tokens that were tied around them. The specimens were then immersed in 3% H 2 SO 4 solution and 3% HCl solution, for the pre-determined period maintaining a constant ph value of 4 throughout the test period. The solution was replaced


 were cast using PMMFRHPC.")
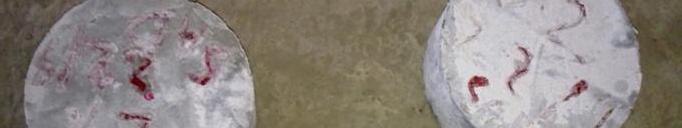
6 70 at regular intervals to maintain the required concentration throughout the test period. The mass of specimens were measured at regular intervals upto 90 days, and the loss of mass of specimens was determined. Some of the cubes were immersed in HCl and H2SO4 as shown in Figure 4.2. Figure 4.2 Curing of Cubes in HCl and H2SO4 Solutions Impact Resistance The Impact Test was performed in accordance with the impact testing procedures recommended by ACI 544.5R-10, Report on the Physical Properties and Durability of Fibre Reinforced Concrete Reported by ACI Committee 544. The test equipment was fabricated according to standards for testing as per ACI 544.5R-10 and presented in Figure 4.3. For this study disc specimens of size 152 mm (dia.) x 63.5 mm (thickness) were cast using PMMFRHPC. For each mix proportion 9 disc specimens were cast and the test results were obtained for 28, 56 and 90 days of immersion. Totally 63 concrete specimens were cast as per procedures recommended by ASTM. Specimens were tested at 28, 56 and 90 days of age. Curing and handling of the specimens were similar to those adopted for finding compression.
7 71 The samples were coated on the bottom with a thin layer of petroleum jelly or heavy grease and placed on the base plate. The base plate was bolted to a rigid base such as a concrete floor or a concrete block. A steel hammer of weight N was guided through a steel tube and dropped on the specimen from a height of 457 mm to transfer impact energy of Nm on the concrete disc specimens. The total number of blows required to detect the first crack, as well as to cause the ultimate failure by splitting were noted. From the results, first crack energy was calculated by multiplying the number of blows required to cause the first crack with the impact energy ( Nm) and the energy spent for ultimate failure was calculated by multiplying the number of blows required to cause the splitting of disc specimens and the impact energy. The schematic diagram of impact test setup and disc specimens are shown in Figures 4.3 and 4.4 respectively. Calculation of Impact Energy For the entire disc subjected to impact loading, damage was localized at the point of contact and no large fragments fallout from the specimens. Impact energy was calculated for the discs as reported by Mohammadi et al (2009) H = gt 2 /2 457= 9810 x t 2 /2 t = sec V = gt V = 9810 x V = mm/sec U = mv 2 /2 U = Wv 2 /2g U = x ( ) 2 / (2 x 9810) U = Nm


8 72 Figure 4.3 Schematic Diagram of Impact Test Setup Figure 4.4 Disc Specimen Drying Shrinkage The drying shrinkage of concrete was determined on prism of size 285 x 75 x 75 mm as per ASTM C Drying shrinkage experiments


9 73 were carried out to evaluate the unrestrained volumetric shrinkage of concrete specimens. After removal from the moulds, steel balls were fixed to the centre of both the square ends of the specimens. An initial measurement of the length performed on the length comparator setup is shown in Figure 4.5. For each mix proportion, three prism specimens were cast and length measurement was performed periodically by the length comparator at 28, 56, 90 and 120 days. Figure 4.5 Length Comparator Setup Rapid Chloride Penetration Test (RCPT) The most hazardous durability problem in the country is corrosion of reinforcement in RCC structures. One of the principal sources of this problem is the ingress of chloride ions into porous concrete. Movement of ions into a porous medium under a constant gradient is known as diffusion. It is necessary that concrete is impermeable to chloride ions for quality control measures. Measurement of chloride diffusion co-efficient requires a long time for establishment of steady state conditions. Therefore, a direct current (DC)


 (4.")
10 74 potential is usually applied to accelerate the migration of chloride ions. The RCPT Test Setup is shown in Figure 4.6. Figure 4.6 Rapid Chloride Penetration Test setup The RCPT apparatus consists of two reservoirs. The test method consists of monitoring the amount of electrical current passing through a water-saturated concrete specimen of size 50 mm thick, 100 mm diameter when subjected to a 60 V applied through DC current supply for 6 hours. The total charge passed during this period was calculated in terms of coulombs using the trapezoidal rule as given in the ASTM C , Q = 900 (I I I I I 360 ) (4.2) where, Q = charge passed (coulombs) I 0 = current (amperes) immediately after voltage is applied, and I t = current (amperes) at t minutes after voltage is applied.
11 75 If the specimen diameter was other than 95 mm, the value for total charge passed must be adjusted. The adjustment was made by multiplying the value established by the ratio between the cross sectional area of the standard to that of actual specimen. It is given in the Equation (4.3), Q s = Q x (3.75/x) 2 (4.3) where Q s = charge passed (coulombs) through a 95 mm diameter specimen Q x = charge passed (coulombs) through x inch diameter specimen x = diameter (inch) of the non standard specimen. A higher amount of electric charge passing through the specimen during the test represents a higher penetrability of chloride ions into the concrete. The concrete quality can be assessed according to the RCPT rating as per ASTMC criteria given in Table 4.2. Table 4.2 RCPT Ratings Charge Passed ( coulombs) Chloride Ion Penetrability > 4,000 High 2,000-4,000 Moderate 1,000-2,000 Low 100-1,000 Very Low < 100 Negligible The testing procedure leads to variation of values and hence, to minimize the variation, three samples are generally tested and the average value is reported. (However, the average values of the result of three samples
12 76 should not differ by more than 29 % between two separate laboratories). From the RCPT, the Q value was applied in the Berke s equation to calculate diffusion coefficient, D C values are calculated from Equation (4.4) (Andrade and Whiting 1996). D c = x 10-8 x Q 0.84, cm 2 /s (4.4) In the present study, the Rapid Chloride Penetration Test (RCPT) was performed as per ASTM C to determine the electrical conductance of HPC and PMMFRHPC mixes at the age of 28, 56 and 90 days curing and to provide a rapid indication of its resistance to the penetration of chloride ions. The specimen was fixed between two reservoirs using an epoxy bonding agent to make the setup to be leak proof. In one reservoir was a 2.4 N NaCl solution which was connected to negative terminal of DC source and in the other reservoir, a 0.3 M NaOH solution was connected to positive terminal of DC source, a DC of 60 V was applied across the specimen using two stainless steel electrodes (meshes) and the current flowing across the specimen was recorded at an interval of 30 minutes for a duration of 6 hours Corrosion Resistance - Impressed Current Voltage Test The Impressed Current Voltage Test for concretes was carried out based on FM Florida Method of Test for an Accelerated Laboratory Method for Corrosion Testing of Reinforced Concrete using Impressed Current. The concrete cylinders of 100 mm (dia.) and 200 mm (height) with 16 mm dia. Fe 415 bar embedded concentrically were tested at the ages of 28, 56 and 90 days. The concrete specimens were immersed in 3% sodium chloride solution. The embedded rebar was treated as anode and an external stainless steel electrode served as cathode and a constant positive potential of 30 Volts to this system was applied from a DC source. The variation of current was recorded with time. A sharp rise in current indicates the
13 77 corrosion, and cracking of the concrete is usually visible thereafter, the time taken for the initiation if the first crack can be considered as a measure of their resistance against chloride permeability and reinforcement corrosion. After cracking, the specimens were taken out, visually inspected, and carefully split open to assess the corroded steel rod. The reinforcement bars were then cleaned by dipping it in Clark s solution for 25 minutes. Each bar was then weighed again to an accuracy of 0.1 mg. and the change in weight was observed. The Impressed Current Voltage Test setup is shown in Figure 4.7. Figure 4.7 Schematic View of Impressed Current Voltage Test setup 4.3 TEST RESULTS AND DISCUSSION ON DURABILITY OF PMMFRHPC The results obtained for the various durability studies of PMMFRHPC have been presented and discussed.
14 Voids Permeability The results of the Voids Permeability Test on concrete cubes are listed in Table 4.3. The maximum value of permeable voids obtained for mix FMHPC00 at 28 days was 4.42 %.The mix FMHPC03 showed the lowest value of permeable voids absorption and its value 1.87% was lower than the FMHPC00 mix at the age of 28. Adding PMM fibre to the normal concrete, the porosity of the concrete was reduced and the main reason were due to decrease in permeable voids. The test indicated that when more pozzolanic material was added to concrete, the water absorption reduced. Also mix FMHPC02 showed a moderate value of 2.56% at 28 days. The PMM fibre added in ascending order in FMHPC00 mix showed variation according to the increase in percentage (0.1, 0.2, and 0.3).Voids Permeability is mainly influenced by the paste phase; primarily, it was dependent on the extent of interconnected capillary porosity in the paste. The relationship between Voids Permeability (f vp ) and fibre content (x) in percentage is obtained as f vp = -15.2x at age of 28 days, f vp = -14.7x at age of 56 days and f vp = -13.8x at age of 90 days, as shown in Figure 4.8 Table 4.3 Test Results of Voids Permeability and Water Absorption Mix Fibre Dosage in % Voids Permeability in % Water Absorption in % 28 Days 56 Days 90 Days 28 Days 56 Days 90 Days CM FMHPC FMHPC FMHPC FMHPC
15 y = -15.2x R 2 = y = -14.7x R 2 = y = -13.8x R 2 = Fibre (%) Figure 4.8 Voids Permeability Vs Fibre Content Water Absorption The results of the Water Absorption Test of concrete cubes are listed in Table 4.3. The result shows that the water absorption reduced when the admixture metakaolin used. The maximum value of water absorption obtained at 28 days was 3.01 %. Concrete mixes with higher paste contents were bound to have higher absorption values than concrete with lower paste content (at consistent w/c). The lower voids permeability thus observed for normal vibrated concrete was attributed to the relatively lower paste volume i.e., smaller capillary pore volume. It was noted that high performance concretes with fly ash and metakaolin had lesser water absorption. The increase in paste volume due to the lower specific gravity of fly ash contributed to an increased capillary pore volume and increased water absorption in the control mix concrete. The test result indicated that when more pozzolanic material is added to concrete, the water absorption would
16 80 reduce. Water absorption was mainly influenced by the paste primarily; it was dependent on the extent of interconnected capillary porosity in the paste. Concrete mixes with higher paste contents were bound to have higher absorption values than concretes with lower paste content (at consistent w/c). The lower water absorption thus observed for normal vibrated concretes was attributed to the relatively lower paste volume i.e., smaller capillary pore volume. It was noted that high performance concretes with fly ash and metakaolin have lesser water absorption. The relationship between water absorption (fwab) and fibre content (x) in percentage is obtained as fwab = -2.27x at age of 28 days, fwab = -2.32x at age of 56 days and fwab = -1.11x at age of 90 days, as shown in Figure y = -2.27x R 2 = y = -2.32x R 2 = y = -1.11x R 2 = Fibre (%) Figure 4.9 Water Absorption Vs Fibre Content Permeability The test results of permeability are shown in Table 4.4. The permeability of concrete reduced for the optimum dosage of mineral
17 81 admixtures such as fly ash 10% and metakaolin 10% with 0.3% of PMM fibre for the mix FMHPC03. Table 4.4 Test Results of Permeability Test Mix Fibre Dosage The Co-efficient of Permeability (K) K= QL/(ATH) x 10-7 cm/sec in % 28 Days 56 Days 90 Days CM FMHPC FMHPC FMHPC FMHPC The maximum permeability obtained by the FMHPC00 is 5.09x10⁻⁷ at 28 days. The lowest value of permeability obtained by the mix FMHPC03 is 4.76 x10⁻⁷ at 28 days. The permeability was reduced, when the metakaolin and fly ash is equally replaced along with fibres. For FMHPC00 specimen developed with replacements of fly ash and metakaolin, the corresponding permeability was also found to be lesser. This may be due to the high paste volumes (due to replacements of fly ash and metakaolin), water contents and super plasticizer dosages adopted in producing HPC which result in decreased porosity. The relationship between permeability (fp) and fibre content (x) in percentage is obtained as fp = -1.08x at age of 28 days, fp = -1.88x at age of 56 days and fp = -1.88x at age of 90 days, as shown in Figure 4.10.
18 y = -1.08x R 2 = y = -1.88x R 2 = y = -1.88x R 2 = Fibre (%) Figure 4.10 Permeability Vs Fibre Content Acid Resistance The Acid Resistance Test was conducted by using sulphuric acid and hydrochloric acid at a concentration of 3% dilution. From the results it was found that the resistance of concrete to sulphuric acid in the mix with mineral admixtures was far greater than that of control mix. Most resistance was offered by a mix containing 10% metakaolin and 10% fly ash. A similar result was found in the case of hydrochloric acid also. The results of acid resistance test of concrete cubes were listed in Table 4.5. The result showed that the percentage of weight loss reduced when the percentages of metakaolin increased. The maximum value of weight loss was obtained for mix FMHPC00 at 28 days and it was 2.12 % in sulphuric acid. The mix FMHPC02 showed a value of 0.62% of weight loss and mix FMHPC03 showed a value of 0.56 % comparatively low than the control mix at 28 days in sulphuric acid. In case of hydrochloric acid, the maximum weight loss obtained for mix FMHPC00 at 28 days is 0.96% at 28 days. The mix FMHPC03 showed a value of 0.39% at 28 days. Mix FMHPC03 showed a


19 83 moderate weight loss of 0.43%. Every mix showed a difference in weight loss between control mixes. Adding fibres to the normal concrete, the porosity of the concrete was reduced this was the main reason for decrease in weight loss. Figure 4.11 Cubes Cured in H2SO4 Figure 4.12 Cubes Cured in HCL The Concrete Cube Test specimens attacked by sulphuric acid lead to leaching of maximum part of outer surface. And it was observed that no pores or voids were formed but the surface of the specimen was completely washed out. The acid attack leached away the calcium compounds of cement paste formed in concrete through the hydration process, as well as the calcium in calcareous aggregate. The reaction is primarily between the offending acid and calcium hydroxide. Acid attack weakens the concrete structurally and reduces its durability and service life. The compressive strength of the cubes was reduced in all the mixes after curing in sulphuric acid, the reduction of strength maximum in mix FMHPC00 at a percentage of 2.12% at 28 days curing in sulphuric acid. The relationship between acid resistance H 2SO4 (fcu)and fibre content (x) in percentage is obtained as fars = -350x at age of 28 days, fars = -285x at age of 56 days and fars = -285x at age of 90 days, as shown in Figure The relationship between acid resistance HCl (fcu) and fibre content (x) in percentage is obtained as
20 84 f arh = -351x at age of 28 days, f arh = -285x at age of 56 days and f arh = -285x at age of 90 days, as shown in Figure y = -350x R 2 = y = -285x R 2 = y = -285x R 2 = Fibre (%) Figure 4.13 Acid Resistance (H 2 SO 4 ) Vs Fibre Content y = -351x y = -285x R 2 y = -285x = R 2 = R 2 = Fibre (%) Figure 4.14 Acid Resistance (HCl) Vs Fibre Content
21 85 Table 4.5 Loss of weight due to Chemical Exposure of H 2 SO 4 and HCl Mix Fibre Dosage in % 28 Days H 2 SO 4 Loss in weight, gms 56 Days 90 Days HCL Loss in weight, gms 28 Days 56 Days 90 Days CM FMHPC FMHPC FMHPC FMHPC In hydrochloric acid FMHPC00 mix showed a maximum value, but less when comparing with sulphuric acid. In control mix, the reduction of compressive strength was more. Mix FMHPC03 was the lowest value in both the acids. Hence, concrete with metakaolin and fly ash equally replaced provides a better durable concrete. It was observed that the test specimen were least attacked by HCl acid and hence, the loss of weight leaching effect was also minimum. In most cases, the reaction between the attacking acid and calcium compounds will form calcium salts, which could be soluble in water. These salts would then be leached away, causing a loss of volume and cohesion of the paste. Both the Figures 4.11 to 4.12 in case of H 2 S0 4 and HCl clearly showed that the coarse aggregate used here was not attacked by the acid. The maximum size of the aggregate was restricted by passing through a sieve of 12.5 mm In this way, the aggregates actually protect the concrete. Based on the experimental investigation, it was observed that loss of compressive strength decreased with ages subjected to hydrochloric acid and sulphuric acid
22 86 exposure. It was observed from the experimental investigations, the percentage loss of compressive strength was higher with the increase in fly ash, metakaolin and fibre content. But with the increase of age, percentage loss of compressive strength was reducing. This property was due to gain in strength with the increase in ages Impact Resistance The experimental results of the impact resistance of the concrete mixes with admixtures and without fibers and the remaining five mixes with admixtures containing 0.1, 0.2, 0.3, 0.5 and 0.7 percentage of fibers were consider in this investigation and presented in Table 4.6 and shown in Figure The impact strength of the mix FMHPC01 was % higher than the FMHPC00 with the increase in age. But for the mix FMHPC05 and FMHPC07 the average increase in impact strength was varying between % higher than the FMHPC00 mix with the increase in ages. On attaining the age of 90 days, the addition of fibre improved the strength characteristics of the FMHPC mixes with fibres significantly to 100% higher than mix without fibre. The maximum impact strength achieved by the FMHPC07 mix was knmm at 90 days knmm at 56 and knmm at 28 days respectively. Whereas, the mix FMHPC00 without fibre achieved an impact strength of knmm at 90 days, knmm at 56 days and knmm at 28 days respectively. Three factors namely fibre, age and the compressive strength of the mix mainly had contributed to the improvement of impact strength. On an average FMHPC03, FMHPC05, FMHPC07 attained impact strength of 47% higher than FMHPC00 at 28 days whereas, the same mixes achieved impact strength of 100% higher than FMHPC00 at 90 days. Further with the addition of fibre dosage above 0.3%, the improvement of impact resistance is meager. Thus the fibre, compressive strength and age constituted the improvement in impact strength. The relationship between
23 87 impact resistance (fir) and fibre content (x) in percentage is obtained as fir = 154.2x at age of 28 days, fir = 150.3x at age of 56 days and fir = 142.3x at age of 90 days, as shown in Figure Fibre dosage (%) 28 days 56 days 90 days Figure 4.15 Variation of Impact Strength at Different Ages 500 y = x R 2 = y = x R 2 = y = x R 2 = Fibre (%) Figure 4.16 Impact Resistance Vs Fibre Content
24 88 Table 4.6 Impact Strength of Concretes Mix Fibre in % 28 Days Specimen Weight in kg. 56 Days 90 Days 28 Days Energy Absorbed in Nm 56 Days 90 Days CM FMHPC FMHPC FMHPC FMHPC FMHPC FMHPC Drying Shrinkage The experimental observations on the drying shrinkage value (percentage change in length) of the concrete mixes are presented in Table 4.7 and shown in Figures In the case of fibre concretes, the appearance of the crack was delayed, compared to plain concrete. Free drying shrinkage of all the fibre concretes was lesser than the plain concrete. The maximum shrinkage at 120 days was observed to be around 0.12% for plain concrete. The rate of shrinkage decreased rapidly with time. It was observed that 40 to 80 percent of shrinkage occurred within 90 days. The maximum percentage of the rate of shrinkage decreased at 56, 90 and 120 days by 70%, 76% and 77% respectively when compared to the 28 days. The relationship between drying shrinkage (fds) and fibre content (x) in percentage is obtained as fds = 0.041x at age of 28 days, fds = 0.072x at age of 56 days and fds = x at age of 90 days, as shown in Figure 4.18.
25 89 Figure 4.17 Drying Shrinkage of Concretes y = x R 2 = y = x R 2 = y = x R 2 = Fibre (%) Figure 4.18 Drying Shrinkage Vs Fibre Content
26 90 Table 4.7 Test Results of Drying Shrinkage Test Mix 28 days 56days 90 days 120 days CM FMHPC FMHPC FMHPC FMHPC FMHPC FMHPC Rapid Chloride Penetration Test (RCPT) The results of the Rapid Chloride Penetration Tests of the mixes are given in Table 4.8. From the test results, it was observed that the lowest value charge passed was for the mix having fibre dosage as 0.3%. It was also noted that the addition of pozzolanic material such as fly ash and metakaolin increased the penetration resistance of concrete when compared to control mix. It was also noted that as the curing period increased, the penetration resistance increases due to the depletion of calcium ions in the gel pore fluids and subsequent reduction of ph and the development of constricted discontinuous and tortuous pore structure. As a result of pore structure becoming relatively more refined due to the pozzolanic reactions, the high conductivity path or the least resistive paths for the ions would be decreased. The relationship between rapid chloride penetration test (RCPT) (frcp) and fibre content (x) in percentage is obtained as frcp = x at age of 28 days, frcp= -3798x at age of 56 days and frcp= x at age of 90 days, as shown in Figures 4.19.
27 y = x R 2 = y = -3798x R 2 = y = x R 2 = Fibre (%) Figure 4.19 RCPT Vs Fibre Content Table 4.8 Test Results of Rapid Chloride Penetration Test Mix Charge Passed as per ASTM Equivalent (coulombs) Degree of Chloride ion Penetrability Based on Charge Passed 28 days 56 days 90 days 28 days 56 days 90 days CM Moderate Moderate Low FMHPC Moderate Low Low FMHPC Moderate Low Very Low FMHPC Low Very Low Very Low FMHPC Low Very Low Very Low Diffusion Co-efficient for Mixes The diffusion co-efficient for the mixes containing control mix and fly ash, metakaolin replaced concrete with fibre dosage 0.1%,0.2% and 0.3% are given in Table 4.9. From The results indicated that the diffusion
28 92 co-efficient value decreased as the fibre dosage increased and also the curing period was extended. The decrease in diffusion co-efficient value indicated that the concrete exhibited increased penetration resistance. The fibres used provide excellent resistance to the salts. Table 4.9 Diffusion Co-efficient of Concretes Mix Diffusion Co- Efficient (cm 2 /s) 28 days 56 days 90 days CM E E E-07 FMHPC E E E-07 FMHPC E E E-07 FMHPC E E E-07 FMHPC E E E Corrosion Resistance (Impressed Current Voltage Test) In the accelerated electrolytic corrosion test, constant voltage studies were carried out on control mix and HPC mixes containing fly ash, metakaolin with fibre dosage 0.1%, 0.2% and 0.3% for 28, 56 and 90 days of curing. The loss of weight of rebar for the mixes at 28, 56 and 90 days of curing are shown in Tables 4.10 to 4.12 respectively. From the test results it was observed that the loss in weight in rebar due to corrosion was less for concrete mixes with higher fibre dosage of 0.3% and high for control mix. The control mix showed greater loss in weight than replacement mixes with different fibre dosage. The increased resistance to corrosion was mainly due to the pozzolanic activity and the fibres that contributed primarily to reduced inter connected porosity. It was the pore structure which attributed to the ultimate reduction of corrosion. The intensity
29 93 of current was measured for different fibre dosages at 28, 56 and 90 days of curing. It showed that the intensity of current measured decreased with increase in fibre dosage and as the curing period increased, the number of days for the concrete to develop initial crack also increased. The relationship between corrosion resistance (fcr) and fibre content (x) in percentage is obtained as fcr = -8.96x at age of 28 days, fcr = -6.6x at age of 56 days and fcr = -4.66x at age of 90 days, as shown in Figure y = -8.96x y = -6.6x R 2 = R 2 y = -4.66x = R 2 = Fibre (%) Figure 4.20 Corrosion Resistance Vs Fibre Content Table 4.10 Accelerated Electrolytic Corrosion Results for 28 Days Curing Mix Loss of weight of Rebar % Visual Observation of Specimen Placed in 3.5% NaCl Solution After 28 Days CM 8.5 Severe Corrosion FMHPC Severe Corrosion FMHPC Mild Corrosion FMHPC Mild Corrosion FMHPC Mild Corrosion
30 94 Table 4.11 Accelerated Electrolytic Corrosion Results for 56 Days Curing Mix Loss of weight of Rebar % Visual Observation of Specimen Placed in 3.5% NaCl Solution After 56 Days CM 4.39 Mild Corrosion FMHPC Mild Corrosion FMHPC Mild Corrosion FMHPC Mild Corrosion FMHPC Mild Corrosion Table 4.12 Accelerated Electrolytic Corrosion Results for 90 Days Curing Mix Loss of weight of Rebar % Visual Observation of Specimen Placed in 3.5% NaCl Solution After 90 Days CM 3.3 Mild Corrosion FMHPC Mild Corrosion FMHPC Mild Corrosion FMHPC Mild Corrosion FMHPC Mild Corrosion 4.4 CORRELATIONS AMONG VARIOUS HARDENED PROPERTIES Correlation between Impact Energy and Compressive Strength The impact energy at 28 days is related with compressive strength concrete mixes, as shown in Figure The coefficient of determination (R 2 ) for the estimated impact energy was Relation between impact energy (f ir ) and compressive strength (f cu ) is as per Equation (4.5). f ir = 6.354e fcu (4.5)
31 y = 6.354e x R 2 = Compressive strength f cu (MPa) Figure 4.21 Correlation between Impact Energy and Compressive Strength Correlation between Water Absorption and Compressive Strength The water absorption at 28 days is related with compressive strength concrete mixes, as shown in Figure The coefficient of determination (R 2 ) for the estimated water absorption was Relation between water absorption (f wab ) and compressive strength (f cu ) is as per Equation (4.6). f wab = e fcu (4.6) x y = e R 2 = Compressive strength f cu (MPa) Figure 4.22 Correlation between Water Absorption and Compressive Strength
32 Correlation Between Permeability and Compressive Strength The permeability at 28 days is related with compressive strength concrete mixes, as shown in Figure The coefficient of determination (R 2 ) for the estimated permeability was Relation between permeability (f p ) and compressive strength (f cu ) is as per Equation (4.7). f p = e fcu (4.7) x y = e R 2 = Compressive strength f cu (MPa) Figure 4.23 Correlation between Permeability and Compressive Strength 4.5 MATHEMATICAL MODELLING FOR DURABILITY PROPERTIES OF PMMFRHPC Statistical Approach A mathematical model is a description of system using mathematical concepts and language. The process of developing a mathematical equation is termed as mathematical modelling. Identification of process control parameter, based on statistical approach was given by Ghezal and Kamal Khayat (2002). Models were developed for the durability studies at the ages of 28, 56, and 90 days.
33 97 The response function representing any of the recorded response can be expressed as in the Equation (4.8) Y = f (F/M) (4.8) expressed as follows The relationship selected is a single degree response surface Y = a 0 + a 1 [F/M] (4.9) Variables, F refers fibre, M refers mortar composite (cement, metakaolin, fly ash, water, super plasticizer and fine aggregate), a 0 refers regression constant and a 1 refers Variables co-efficient Voids Permeability Model The Voids Permeability Regression Models, (f vp ) in percentage developed in the study were based on the variables given in Equation (4.9). Models were developed for 28,56 and 90 days as presented in the Equations (4.10) to (4.12) respectively. f vp = F/M R 2 = (4.10) f vp = F/M R 2 = (4.11) f vp = F/M R 2 = (4.12) Water Absorption Models The Water Absorption Regression Models, (f wab ) in percentage developed in the study are based on the variables given in Equation (4.9). Models developed for 28, 56 and 90 days are presented in the Equations (4.13) to (4.15).
34 98 f wab = F/M R 2 = (4.13) f wab = F/M R 2 = (4.14) f wab = F/M R 2 = (4.15) Permeability Models The Co-efficient of Permeability Regression Models, (f p ) in cm/sec developed in the study are based on the variables given in Equation (4.9). Models developed for 28, 56 and 90 days are presented in the Equations (4.16) to (4.18). f p = F/M R 2 = (4.16) f p = F/M R 2 = (4.17) f p = F/M R 2 = (4.18) Acid Resistance Models The acid resistances, mass losses regression models in grams developed in the study are based on the variables given in Equation (4.9). Models developed for 28, 56 and 90 days as presented in the Equations (4.19) to (4.24). Sulphuric acid (H 2 SO 4 ) f ars = F/M R 2 = (4.19) f ars = F/M R 2 = (4.20) f ars = F/M R 2 = (4.21) Hydrochloric acid (HCl) f arh = F/M R 2 = (4.22) f arh = F/M R 2 = (4.23) f arh = F/M R 2 = (4.24)
35 Impact Resistance Models The Impact Energy Absorbed Regression Models, (f ir ) in Nm developed in the study are based on the variables given in Equation (4.9). Models developed for 28, 56 and 90 days are presented in the Equations (4.25) to (4.27). f ir = F/M R 2 = (4.25) f ir = F/M R 2 = (4.26) f ir = F/M R 2 = (4.27) Drying Shrinkage Models Shrinkage Value % (Change in Length) The Drying Shrinkage Value (change in length) Regression Models, (f ds ) in percentage developed in the study are based on the variables given in Equation (4.9). Models developed for 28, 56 and 90 days are presented in the Equations (4.28) to (4.30). f ds = F/M R 2 = (4.28) f ds = F/M R 2 = (4.29) f ds = F/M R 2 = (4.30) RCPT Models The RCPT Regression Models, (f ds ) in coulombs developed in the study are based on the variables given in Equation (4.9). Models developed for 28, 56 and 90 days are presented in the Equations (4.31) to (4.33). f rcp = F/M R 2 = (4.31) f rcp = F/M R 2 = (4.32) f rcp = F/M R 2 = (4.33)
36 Corrosion Loss of Weight of Rebar Models The Corrosion Loss of Weight of Rebar Regression Models, (f cr ) in percentage developed in the study are based on the variables given in Equation (4.9). Models developed for 28, 56 and 90 days as presented in the Equations (4.34) to (4.36). f cr = F/M R 2 = (4.34) f cr = F/M R 2 = (4.35) f cr = F/M R 2 = (4.36) Validity of the PMMFRHPC Models The validation of models establishes a precise correspondence between durability properties of concrete and a complete abstract interpretation and strong preservation could be formulated by the interpretation as completeness properties. Nevertheless, the model was used to calculate the durability properties of various PMMFRHPC mixtures produced in the present study and the predictions were compared with experimental results and validated, the general trend of results and the major characteristics were discussed in terms of the discrepancies Validation of Durability Studies Models Adequacy of the durability models are shown in Table 4.13.
37 101 Durability Properties Voids Permeability Water Absorption Permeability RCPT Table 4.13 Adequacy of the Durability Models Days F t Acid Resistance H 2 SO Acid Resistance HCl Impact Resistance Corrosion Drying Shrinkage Notes: Standard Estimate Error Significance Percentage F (statistic) = mean square (Regression)/mean square (Residual) t (statistic) = p values ranges from 0 to 0.05 Standard estimate error = square root of mean square for the residual Significance Percentage is <0.05 or 5%
38 Application of the Models The models are applicable for the concretes with mineral admixtures fly ash and metakaolin, 12.5 mm size of coarse aggregates and PMM fibre type. The voids permeability of PMMFRHPC can be estimated with good accuracy based on the derived model, which can be used to estimate the durability studies of the PMMFRHPC mixtures. The models of hardened PMMFRHPC properties would be useful to assess the performance and thus to facilitate the usage of PMMFRHPC. The ability of models and variation in the range of models were discussed in validity of the PMMFRHPC models. The predicated and measured voids permeability for 28, 56 and 90 days are shown in Figure Figure 4.24 Measured Vs Predicted Compressive Strength for 28, 56 and 90 Days
39 CONCLUSIONS PMMFRHPC: The following conclusions are drawn from the durability studies of Water absorption and voids permeability test conducted in the laboratory gave a good result for PMMFRHPC, when compared to the concrete without fibres. It was seen that there is a decrease in the absorption of water after 56 and 90 days in PMMFRHPC and voids permeability was also lower. In 3% concentration of sulphuric acid the leaching was more and in hydrochloric acid the leaching was less in all the mixes. HPC with 10% fly ash and 10% metakaolin with addition of 0.3% of PMM fibre showed an enhanced resistance by providing a weight loss 53.5% on 28 days & 64.5% on 56 days. The weight loss percentages reduced up to 77% in H 2 SO 4 compared to the High Performance Concrete. In hydrochloric acid attack, HPC with 10% Fly ash and 10% Metakaolin with addition of 0.3% of PMM fibre showed a better resistance by providing a weight loss 49% on 28 days and 52% on 56 days, lesser than High Performance Concrete. Through the addition of 0.3% fibres the weight loss percentages reduce up to 62% in HCl compared to the High Performance Concrete. The empirical relations obtained could be used to predict the impact energy absorption of the PMMFHPC based on compressive strength. Predicted values of impact energy based on compressive strength lies within + 10 variations in the present investigation.
40 104 Age affected the impact energy characteristics. The maximum percentage of increase in impact energy absorption at 56 and 90 days was 97 and 103% respectively when compared to the 28 days impact energy absorption. In the case of fibre concretes, the appearance of the crack was delayed compared to plain concrete. Free drying shrinkage of all the fibre concretes was lesser than the plain concrete. The maximum shrinkage at 120 days was observed to be around 0.12% for plain concrete. The rate of shrinkage decreased rapidly with time. It was observed that 40 to 80 percent of shrinkage occurs within 90 days. The maximum percentage of the rate of shrinkage decreased absorption at 56, 90 and 120 days is 70%, 76% and 77% respectively, when compared to the 28 days. Rapid Chloride Penetration Test conducted in the laboratory for HPC with 10% fly ash and 10% metakaolin gives a better result than that of control mix concrete. The permeability of HPC was lower than control mix concrete. The increase in fibre dosage showed reduction in the charges passed in HPC mixes. Also the increase in curing period reduced the charges passed (low, very low) indicating that there was higher penetration resistance as the fibre dosage and curing period increased. Thus the above conclusions show that the performance of HPC, using mineral admixtures such as metakaolin and fly ash, over durability characteristics was good.