Modeling of Microstructure Evolution During LENS TM Deposition
|
|
|
- Bernadette Zoe Flowers
- 5 years ago
- Views:
Transcription
1 Modeling of Microstructure Evolution During LENS TM Deposition Liang Wang, PhD Haitham El Kadiri, PhD Sergio Felicelli, PhD Mark Horstemeyer, PhD Paul Wang, PhD Center for Advanced Vehicular Systems Mississippi State University 1
")
2 Laser Engineered Net Shaping (LENS) 2


3 Introduction A variety of materials can be used: Steel Materials (4140, SS410, SS316) Ti-based alloy (Ti-6Al-4V) Inconel, copper, aluminum, etc. Application: Aerospace repair & overhaul Rapid prototyping and 3D structure fabrication Product development for aerospace, defense, and medical markets, etc. Advantages: Low cost & time saving Enhanced design flexibility and automation Highly localized heat-affected zone (HAZ) Superior material properties (strength and ductility) Processing Blade Processing Bar 3
4 Objectives Develop a 3-D thermal-metallurgical model to simulate 16-pass single build plate LENS deposition of 4140 steel powder with SYSWELD finite element code. Predict the thermal profiles, phase transformation, and hardness in the deposited part, and compared with experimental data Investigate the effect of the thermal cycles on the phase transformation and consequent hardness. 4

5 Geometry & Process Parameters Process parameters Values 10 (unit: mm) Width of the part 2.0mm Thickness for each layer 0.8mm layers Laser beam travel velocity 8.5mm/s Moving time of the laser beam for each pass 1.18s Substrate Idle time of consecutive layers deposition 0.32s Time to finish one layer 1.5s 5 20 Total time to finish the part 24s Chemical composition of 4140 steel (wt%) Weld direction: Same direction for each pass Both the deposited part and the substrate are 4140 steel 5
6 Thermal Properties (4140) Specific Heat Density Thermal Conductivity CCT Diagram Ferrite Bainite M s Martensite Phase Proportion (%) 6
7 Thermal-Metallurgical Model Modified heat conduction equation: i f i T ( ρc) i fiλi T t i + i< j L ij ( T ) A ij = Q f T t - phase proportion i, j - phase indexes Q (T ) L ij - temperature -time - latent heat of i j transformation Aij - proportion of phase i transformed to j in time unit ρ C - mass density - specific heat λ - thermal conductivity - heat source 7
8 Element Activation Technique Dummy material method is applied to the element activation: M1: Deposited layers + substrate Material with actual thermal properties and phase transformation M2: Layer being deposited Material with actual thermal properties and starting with dummy phase Dummy phase Austenite phase (T>T aus ) M3: Layers to be deposited Material with dummy low thermal properties and without phase transformation M3 M2 M1 V Element size in the beams: 0.1 X 0.1 X 0.1 mm 3 Fixed mesh is used for the plate and substrate. 8
9 9 L. Wang, H. Kadiri, S. Felicelli, M. Horstemeyer, P. SPIE 2007 Heat Source h z h r r r r i e e o ) )( ( = ) ( ) ( t v y y x x r o o + = = exp 1 2 r r h z h r P Q r π 3D Conical Gaussian Function Q r P - Input energy density (W/mm 3 ) - Absorbed laser power (W) Q r
10 Initial and Boundary Conditions Initial condition T ( x, y, z, t = 0) = T 0 Boundary condition on the bottom of the substrate T ( x, y, z = 0) = T for t > 0 Boundary conditions for all other surface k r ( ) ( 4 4 T n ) Ω = h( T Ta ) Ω + εσ T Te Ω Qr ΩLaser As new layers are activated, the surfaces are increased and the boundary conditions are updated. 0 10
11 Model for Phase Transformation Evolution equation for austenitic, ferritic-perlitic, and bainitic transformation of steels: f ij j eq f j (T ) df dt j = f ij j eq - proportion of phase j and ( T ) τ ij f ( T ) = 1 j ( T ) - equilibrium fraction of phase j at temperature T j f j ij τ (T) - characteristic time of the transformation (from i to j) at temperature T These functions can be obtained by comparison of the prediction provided by the model with experimental results (i.e. CCT diagram). 11
12 Martensitic Phase Transformation Martensitic transformation by Koistinen-Marburger Law: f m ( T ) f (1 exp( 0.011( M T ))) = γ s for T M s fγ - phase proportion of austenite before cooling down to Ms M S - initial transformation temperature 12
13 Hardness Calculation Hardness of ferrite (229 HV) (Blondeau et al., 1973) H F (HV) = C + 53Si + 30Mn Ni + 7Cr + 1Mo + logvr(10-19si + 4Ni + 8Cr +130V) Hardness of bainite (337 HV) (Blondeau et al., 1973) H B (HV) = C Si + 153Mn + 65Ni + 144Cr + 191Mo + logvr(89+53c- 55Si - 22Mn - 10Ni - 20Cr -33Mo) Hardness of martensite (H M0 = 800 HV) (Miokovic et al., 2006) Hardness of tempered martensite (Costa et al., 2005) H M t = H M A 2 0 t1 exp Q RT ( t) dt m t1 is tempered martensite start time (the beginning of the thermal cycle in which martensite is tempered) t2 is the final time when the part cools down to room temperature 13
14 Hardness Calculation For each thermal cycle If Tmax > Ac3, then complete austenization If Tmax < Ac1, then martensite tempered If there are n thermal cycles, the proportion of retained austenite in the final part: Hardness of the material: f γ = f γ 0 η η η Kη ( M T ) η = exp S ( i = 1,2, K, n) i 90.9 n H = f F H F + f B H B + f M H M + fm 0 H M 0 + f γ H γ 14


15 Temperature Contours Deposition of 11 th layer Deposition of 16 th layer 15
16 Thermal Cycles ( C) Ac3 Bs Ms t (s) Temperature profile at the center point of each layer 16
17 Thermal Cycle (1 st layer) 2500 The proportion of retained austenite is: Temperature ( C) a c e g i Ac3 From a to b: f r = 100%*exp[-( )/90.9] = 29.5% From c to d: f r = 29.5%*exp[-( )/90.9] = 14.4% From e to f: f r = 14.4%*exp[-( )/90.9] = 7.8% From g to h: f r = 7.8%*exp[-( )/90.9] = 3.9% From i to j: f r = 3.9%*exp[-(420-30)/90.9] = 0.0% Hardness of tempered martensite is calculated by integrating the equation from point b to j b d f h Ms j Time (s) Martensite is completely tempered at the first layer (H M = 582HV) 17


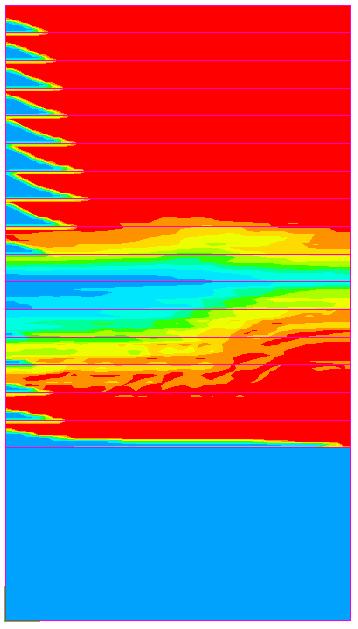


18 Phase Contours (t=50s) Temperature Ferrite Bainite Martensite 18
19 Phase Proportions The first 2 layers are tempered martensite since the part cools down below the martensite start temperature (Ms) for each thermal cycle Starting from the third layer, the part never cools down to Ms and martensite is not tempered once it forms From the 3rd to 7th layers, bainite forms due to the slow cooling rate, then martenite forms afterwards with increasing cooling rate Phase Proportion Tempered Martensite 0 Bainite Martensite Ferrite Distance from the substrate (mm) 19
 800 700 600")

20 Micro-hardness Measurement and Prediction Micro-Hardness (HV) Predicted Measured Distance from the substrate (mm) 20
21 Conclusion 3-D model was developed to predict the thermal cycles, phase transformation, and hardness in LENS deposition process. The calculated hardness qualitatively agrees with the measured data The microstructure and hardness strongly depends on the thermal history in the deposited part. This model has the potential to control the processproperty relationships for the component design optimization to meet the product attributes. 21