A Stable Super-Supertetrahedron with Infinite Order via. Assembly of Supertetrahedral T4 Zinc-Indium Sulfide Clusters
|
|
|
- Ursula Evans
- 5 years ago
- Views:
Transcription
1 Supporting Information for A Stable Super-Supertetrahedron with Infinite Order via Assembly of Supertetrahedral T4 Zinc-Indium Sulfide Clusters Li Zhang, Chaozhuang Xue, Wei Wang, Dandan Hu, Jing Lv, Dongsheng Li, and Tao Wu, * College of Chemistry, Chemical Engineering and Materials Science, Soochow University, Suzhou, Jiangsu , China. College of Materials and Chemical Engineering, Hubei Provincial Collaborative Innovation Center for New Energy Microgrid, Key Laboratory of Inorganic Nonmetallic Crystalline and Energy Conversion Materials, China Three Gorges University, Yichang, Hubei , China. wutao@suda.edu.cn S1
2 Experimental Section Chemicals and Materials. Indium powder (In, 99.99%, powder), sublimed sulfur (S, 99.9%, powder), Zinc acetate dihydrate (Zn(Ac) 2 2H 2 O, 99.99%, powder), cesium chloride (CsCl, AR, solid, Macklin), 3, 5-dimethylpiperidine (DMP, 97%, liquid), deionized water, pyrrolidine (Py, 99%, liquid). All the reagents and solvents were commercially available and used as supplied without further purification. Synthesis of ITF-9 {[Zn 5 In 15 S 32 ] 8.5(H + -Py) 0.5(H + -DMP) 2.1H 2 O}. Indium powder (45 mg, mmol), sulfur powder (122 mg, mmol), zinc acetate dihydrate (Zn(Ac) 2 2H 2 O, 62 mg, mmol) were mixed with 3,5-dimethylpiperidine (3.0 ml), deionized water (1.0 ml) and pyrrolidine (1.0 ml) in a 23-mL Teflon-lined stainless autoclave and vigorously stirred for 20 min. The vessel was sealed and heated at 190 o C for 9 days, and then taken out from oven and cooled to room temperature naturally. The yellow decahedral-like crystals were obtained together with indefinite amorphous powders. The crystals was washed by ethanol and then dried in air. Single Crystal X-ray Diffraction (SCXRD). The single-crystal X-ray diffraction measurements were performed on Photon II CPAD diffractometer with nitrogen-flow temperature controlled using graphite-monchromated Mo-Kα (λ= Å) radiation at 120 K. The structure was solved by direct method using SHELXS-2014 and the refinements against all reflections of the compound were performed using SHELXS The protonated organic amines and water molecules located in the void space of the framework cannot be identified owing to their serious disorder and hence the squeeze subprogram was performed. Powder X-ray Diffraction (PXRD). PXRD data were collected on a Bruker D2 Phaser X-ray diffractometer using Cu-Kα (λ = Å) radiation operated at 30 kv and 10 ma. The patterns were recorded in a slow-scanning mode with 2θ from 5 to 50. Elemental Analysis. Energy dispersive spectroscopy (EDS) analysis was performed on scanning electron microscope (SEM) equipped with energy dispersive spectroscopy (EDS) detector. An accelerating voltage of 25 kv and 40 s accumulation time were applied. EDS results clearly confirmed the presence of In, Zn and S elements. EA elements analysis of C, H, and N was performed on VARIDEL III elemental analyzer {Calcd. (wt %): C ; N 3.367; H 2.980; Found: C ; N 3.332; H 2.590}. The elemental molar ratio of In / Zn was determined by inductively coupled plasma-atomic emission spectrometry (ICP-AES) on Leeman's PROFILE SPEC spectrometer: In / Zn = 2.96 : 1. Thermogravimetric Analysis (TGA). A Shimadzu TGA-50 thermal analyzer was used to measure the TG curve by heating the sample from room temperature to 800 o C with heating rate of 10 o C /min under nitrogen flow. S2
3 UV-vis Absorption Measurement. Room-temperature solid-state UV-vis diffusion reflectance spectra of crystalline samples were measured on a SHIMADZU UV-3600 UV-Vis-NIR spectrophotometer coupled with an integrating sphere by using BaSO 4 powder as the reflectance reference. The absorption spectra were calculated from reflectance spectra by using the Kubelka-Munk function: F(R)=α/S=(1-R) 2 /2R, where R, α, and S are the reflection, the absorption and the scattering coefficient, respectively. Fourier Transform Infrared Absorption. Fourier transform-infrared spectral analysis was performed on a Thermo Nicolet Avatar 6700 FT-IR spectrometer with cesium iodide optics allowing the instrument to observe from cm -1. Ion-Exchange Experiments. 10 mg of ITF-9 sample was added into 10 ml of CsCl aqueous solution (1 M) in glass vial, which was sealed and subsequently put into oven set at 25 o C, 45 o C and 85 o C, respectively. During the treatment, the CsCl solution was refreshed twice. After 12h, Cs@ITF-9 materials were washed by distilled water and ethanol for several times to remove residual Cs + adsorbed on crystal surface and dried in vacuum. The ion exchange experimental conditions for UCR-1 and UCR-8 materials are similar with that for Cs@ITF-9. Cs@ITF-9, Cs@UCR-1 and Cs@UCR-8 were then characterized by PXRD, EA and EDS. Gas Adsorption. CO 2 adsorption isotherms of Cs@ITF-9, Cs@UCR-1 and Cs@UCR-8 were recorded on Micromeritics ASAP 2020 physisorption analyzer. The Cs@ITF-9, Cs@UCR-1 and Cs@UCR-8 were degassed for 12 h at 60 o C. The CO 2 adsorption isotherms were recorded at 195 K, and the experiment temperature was controlled by a Dewar flask. S3
4 Figure S1. SEM image (left) and energy dispersive spectroscopy (EDS) (right) of the as-synthesized ITF-9 crystals. Figure S2. TGA curve of ITF-9. The initial weight loss of 1 % between o C could be attributed to loss of the moisture adsorbed on the surface or in the pores of solid sample. A sharp weight loss of 17 % between o C is attributed to the carbonization of organic template molecules. Figure S3. The experimental and simulated PXRD patterns of ITF-9. S4


. Figure S6.")
 µ 2 -S 2- in UCR-1, (b) µ")
5 Figure S4. Tauc plots of ITF-9 derived from UV-Vis DRS. Figure S5. Octahedral cage in ITF-9 (expressed by green polyhedron). Figure S6. Different corner linkage mode: (a) µ 2 -S 2- in UCR-1, (b) µ 3 -S 2- in UCR-8 and (c) µ 4 -S 2- in ITF-9. S5
 PXRD patterns of the pristine and")
 PXRD patterns of the pristine")


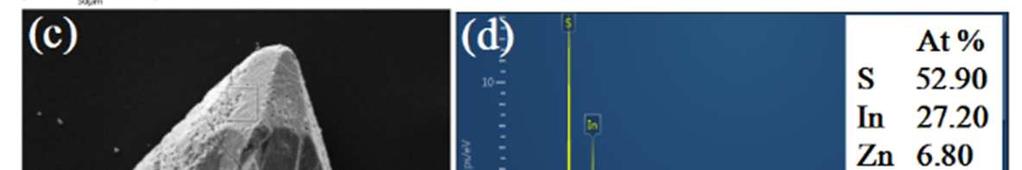
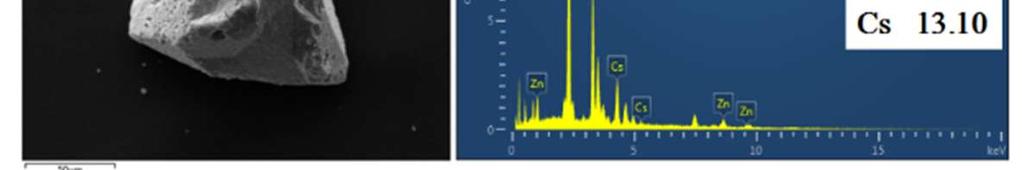
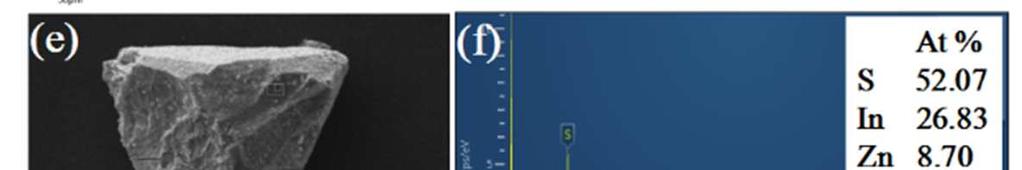
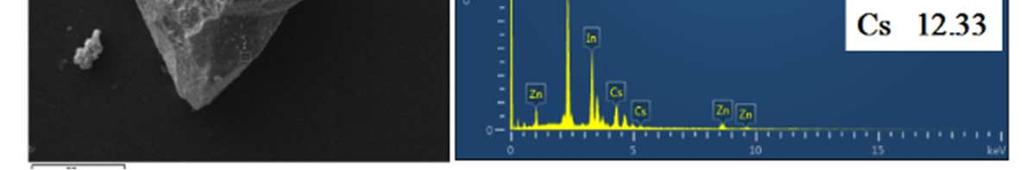
 (d) (f) energy dispersive spectroscopy")
6 Figure S7. (a) PXRD patterns of the pristine and ion-exchanged UCR-1 at 25 o C, 45 o C and 85 o C; (b) PXRD patterns of the pristine and ion-exchanged UCR-8 at 25 o C, 45 o C and 85 o C. Figure S8. (a) (c) (e) SEM images of ITF-9 obtained from ion-exchange at 25 o C, 45 o C, and 85 o C, respectively. (b) (d) (f) energy dispersive spectroscopy (EDS) of ITF-9 obtained from ion-exchange at 25 o C, 45 o C and 85 o C, respectively. S6
 (c) (e) SEM images")


7 Figure S9. (a) (c) (e) SEM images of UCR-1 obtained from ion-exchange at 25 o C, 45 o C, and 85 o C, respectively. (b) (d) (f) energy dispersive spectroscopy (EDS) of UCR-1 obtained from ion-exchange at 25 o C, 45 o C and 85 o C, respectively. Figure S10. (a) (c) (e) SEM images of UCR-8 obtained from ion-exchange at 25 o C, 45 o C, and 85 o C, respectively. (b) (d) (f) energy dispersive spectroscopy (EDS) of UCR-8 obtained from ion-exchange at 25 o C, 45 o C and 85 o C, respectively. S7
8 Figure S11. CO 2 adsorption isotherms (195 K) of the ion-exchanged ITF-9. Figure S12. CO 2 adsorption isotherms (195 K) of the ion-exchanged UCR-1. Figure S13. CO 2 adsorption isotherms (195 K) of the ion-exchanged UCR-8. S8
9 Table S1. Crystal data and structure refinement parameters for ITF-9. ITF-9 Framework Formula [Zn 5 In 15 S 32 ] Formula weight Crystal morphology decahedron Crystal system Cubic Z 2 Space group F-43m T/ K 100 λ/ Å a/ Å (4) b/ Å (4) c/ Å (4) a/ o 90 β/ o 90 γ/ o 90 V (Å -3 ) 10629(6) F(000) 5588 D (g cm -3 ) µ (mm -1 ) Collected reflections 604 Independent reflections 507 (R int =0.0567) GOF on F R 1, wr 2 (I>2σ(I)) , R 1,wR 2 (all data) , S9
10 Table S2. C, H, N elemental analysis of ion-exchanged ITF-9 obtained at different temperature. Samples C (%) N (%) H (%) Exchange degree Pristine ITF Cs@ITF-9-25 o C % Cs@ITF-9-45 o C % Cs@ITF-9-85 o C % Table S3. C, H, N elemental analysis of ion-exchanged UCR-1 obtained at different temperature. Samples C (%) N (%) H (%) Exchange degree Pristine UCR Cs@UCR-1-25 o C % Cs@UCR-1-45 o C % Cs@UCR-1-85 o C % Table S4. C, H, N elemental analysis of ion-exchanged UCR-8 obtained at different temperature. Samples C (%) N (%) H (%) Exchange degree Pristine UCR Cs@UCR-8-25 o C % Cs@UCR-8-45 o C % Cs@UCR-8-85 o C % S10