Rolling contact fatigue performance of HIPed Si 3 N 4 with different surface roughness
|
|
|
- Barry Cannon
- 5 years ago
- Views:
Transcription
1 Rolling contact fatigue performance of HIPed Si 3 N 4 with different surface roughness a J. Kang, a M. Hadfield and b R. T. Cundill a Bournemouth University, School of Design, Engineering & Computing, Tribology Design Research Unit, Studland House, 12 Christchurch Road, Bournemouth, Dorset, BH1 3NA, United Kingdom. b SKF Engineering and Research Centre BV, Nieuwegein, The Netherlands a (Tel. +44 (0) Fax +44 (0) jkang@bournemouth.ac.uk mhadfiel@bournemouth.ac.uk) Abstract: Accelerated rolling contact fatigue four-ball tests were performed on Hot Isostatically Pressed (HIPed) silicon nitride/steel contacts under lubricated condition using a PLINT TE92/HS Microprocessor Controlled Rotary Tribometer at a maximum compressive stress of 6.58GPa and at a speed of 10,000 rpm for 135~200 million stress cycles. Rolling track surfaces were examined by optical microscopy, SEM, 3-D surface analysis, atomic force microscopy and interference profilometry. Experimental results show that with a initial roughness value R a from to µm, the surfaces became smoother during testing and surface pitting (10~20µm) occurred. For the surfaces with a roughness value R a from to µm, the surfaces became rougher and lubricant oil residues were deposited at the edges of rolling track. Some small and shallow surface pitting 2~3µm in size was also observed. Some scratch marks left on the surface by the previous lapping process were further extended during testing. R a and R q are still most important roughness parameters in relation to rolling contact behaviour. The effects of other surface roughness parameters, such as the shape of the valley, R sk and R ku are not obvious in this study. Keywords: C. Fatigue; D. Si 3 N 4 ; B. Surfaces; Roughness
2 1. Introduction Hot isostatically pressed (HIPed) silicon nitride balls are extensively used in precision ball bearings for their optimum combination of properties low density, high elastic modulus, corrosion resistance and temperature resistance, which give significant performance advantages in hybrid bearings and all-ceramic bearings [1]. The only restriction, which hinders the widespread application is the high manufacturing cost of these balls. It is estimated the final finishing process of these balls constitutes up to one half of the total manufacturing cost. Because these balls are subjected to high cyclic contact stresses, currently they are finished to the best possible surface roughness value in order to reduce the risk of rolling contact fatigue failure according to experience with steel balls. The material properties of ceramics are very different from steel, especially with the technological advances of powder manufacture and material densification. This philosophy of obtaining the best possible surface roughness may lead to over-engineering of ceramic balls. The surface roughness parameters which are the most influential in rolling contact fatigue are therefore interests and concerns for both industry and academia. The role of surface roughness and asperities was recognised very early by consideration of the real area of contact and the number, size, and spacing of asperities which will affect the contact resistance or the local temperature caused by frictional heating during sliding. It was assumed that an increase in contact load increases both the number of contacts and the size of the contact area [2]. In the late
3 1960 s R. Van Hasselt [3] showed that for metals the roughness of the surface presents a pattern of irregularities and scratches each being a potential starting point for a fatigue crack. Recently, a data-fitted rolling bearing life prediction model [4] revealed that the rolling bearing life tests showed a consistent downwards trend with increasing composite RMS roughness height. This indicated that the mathematical life prediction model, which does take the surface roughness into account, underestimated the life shortening effect of rougher surfaces. In the late 1970 s, it was reported that on hot pressed silicon nitride, coarser grinding media introduced larger flaws and reduced strength [5], and that finer grit size abrasives gave higher as-ground strengths [6]. Recently, Lakshminarayanan and Chao studied the lubricated rolling contact of steel/silicon nitride using a ball-on-rod rolling-contact-fatigue (RCF) tester. The as-ground silicon nitride rods (R a =0.18µ) exhibited neither wear nor spalling in the RCF tests, while the ground-and-lapped silicon nitride rods (R a =0.08µ) showed no wear but occasional spalling failure [7]. Rolling contact fatigue tests with silicon nitride balls on silicon nitride rods showed bearing-grade balls (R a = 0.005µ) rolling on as-ground (R a =0.18µ) rods produced a high initial wear rate in both elements which decreased exponentially with time or the number of loading cycles. Improving the surface finish on the rods by lapping (R a =0.05µ) produced delayed wear in both elements; i.e., the wear rate was initially zero during an incubation period, then increased and finally decreased [8]. U. Effner and M. Woydt conducted slip-rolling tests on a twin disk tribometer and found spherical samples of Si 3 N 4 and Si 3 N 4 -TiN showed a minimum in the wear coefficient for surface roughness values R VK (reduced valley depth) in the range of 0.5 µm R VK
4 0.9 µm. With cylindrical Si 3 N 4 and Si 3 N 4 -TiN samples, the wear coefficient was proportional to R VK [9-10]. It was observed that for HIP-Si 3 N 4 and Si 3 N 4 -TiN with an initial roughness of R z 0.5µm, running-in could act as cost-free surface finishing process. It was found also that under conditions of slip-rolling in oil for the ceramic couples at room temperature, there was no correlation between friction coefficient and machining process or initial surface roughness [11-12]. Westkaemper et al. [13] carried out similar tests and also found that if R VK was below 0.3 µm then rolling wear increased considerably. The upper limit of R VK was 2 µm; above that the rolling wear rose strongly again. During rolling contact, the initial roughness peaks are cut off very quickly in the running-in period and thus have a very small influence on the rolling wear. The shapes of the valleys in surface topography will have most effect on the rolling contact fatigue life. A wear model for HIP-Si 3 N 4 in rolling contact was established and a new surface characteristic value valley sharpness R S was proposed. Rolling wear test results showed a better correlation with valley sharpness R S than the conventional roughness parameter average roughness height R zdin. It was found that different materials may need different surface characteristic values. For HIP-Si 3 N 4 -TiN and HIP-Y-PSZ-A, unfiltered reduced valley depth P VK showed a good correlation with rolling wear [14]. This paper reports the details of a recent experimental study, which focuses on the correlation between surface roughness and the rolling contact fatigue performance of HIPed silicon nitride.
5 2. Experimental Details 2.1 Test Machine Accelerated rolling contact fatigue tests were performed on a PLINT TE92/HS Microprocessor Controlled Rotary Tribometer. This tribometer is suitable for a variety of tribological tests. In this study, it was configured as a high-speed rolling four-ball machine according to the Institute of Petroleum (UK) IP 300 procedure and Fig 1 is an outline of the modified rolling 4-ball configuration. The contact angle is The upper ball (3) is held in the collet (2) and rotates at the spindle (1) speed. The retainer cup (7) has a race with slightly larger radius than a ½ ball to accommodate three lower balls (4). The cup can be filled with oil before testing and during the testing period more oil can be added through a hole in the cup cover (8) to maintain fully lubricated conditions. The heater pad (5) in conjunction with a thermocouple ensures the temperature is above the specified value, when temperature is lower than this specified value, the heater pad will be on. The four-ball rolling kinematics are described in reference [15]. The current configuration was categorised as a type II machine. The upper ball stress cycle factor L is: Ra + 2Rp L = Z (1) 2( Ra + Rp) Where Z is the number of lower balls, Ra is the upper ball radius and Rp is the lower ball radius. In this case, Ra = Rp = 6.35mm, Z=3, this gives L=2.25. This means that when the spindle rotates one revolution, the upper ball will endure 2.25 stress cycles.
6 In this study, the upper ball is the specimen ball and three lower balls are standard bearing steel balls (specification: 0.5 ball Reference RB12.7/310995A, material: AISI bearing steel). The measured geometric and physical properties of the lower balls are listed in Table 1. The test speed, load and temperature are controlled by editing values, ramps and steps in the menu of a computer interface file. The test will be stopped at a pre-set number of revolutions of the driving-shaft measured by a counter. In the event of a ball failure, a vibration sensor will automatically stop the test at a pre-determined vibration level. All of the present tests were conducted at a shaft speed of 10,000 rev/min. 2.2 Test Samples Four kinds of HIPed silicon nitride balls with diameters 12.7 mm (½ ), commercially finished to grade 5, were procured from different manufacturers and were designated as A, B, C and D. Two different kinds of HIPed silicon nitride ball blanks were lapped and polished to 12.7 mm by the authors using an eccentric lapping machine, and were designated as E, F and G. The same ball blank material was used for balls F and G; F being rough lapped only and G lapped and then polished. E represents balls lapped from another ball blank material. Detailed description about this eccentric lapping machine and the lapping and polishing processes can be found in earlier publications [16-17]. Table 2 summarises the measured geometric and material properties of test samples A to G. Surface hardness was measured using a Buehler Hardness Indenter, at a load 10kg, loading time 10 sec and loading speed of 100µm/sec. Fig. 2 gives surface topography details of samples A through G measured
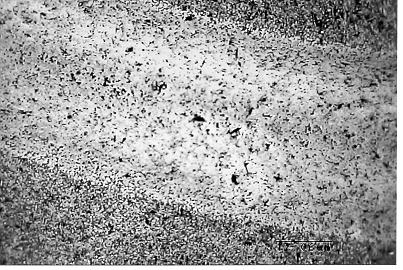
7 by a Zygo New View three dimensional imaging surface structure analyzer. Fig. 3 is the optical microscopy observation on the surfaces of sample A ~ G before the RCF tests. The different surface roughness R a values are well reflected by the microscopy images (Fig. 3), with higher R a values corresponding to more dark phases in the pictures in the sequence of E, F, B, G, A, C then D. The microscopy images of samples A, C and D are close, with D the brightest. But the 3D surface analysis reveals that although its R a and R q (rms) values are the smallest in all of the samples, it has a positive skewness value R sk of 2.64 and a very high kurtosis value R ku of 47.8 which means that the surface of D is spiky. In contrast, both A and C balls have a negative skewness value R sk, which implies that the bulk material is above the mean line (the surface has more valleys than peaks). Many scratches left by the previous lapping process can be observed on surface of sample G and these scratches are also revealed by 3D topography profiles and a negative skewness value R sk of (Fig. 2G). Whether these parameters would affect the rolling contact fatigue life is therefore of interest. Samples A, B, C and D were also measured by a Talysurf 2D surface profiler, in each case with three measurements on three balls. The statistical analysis values for different roughness parameters (R a, R q, R z, etc.) are very close to the values measured by the 3D surface structure analyzer. 2.3 Testing Programme Before each test, the sample ball was cleaned by acetone in an ultrasonic bath. Surface roughness and surface hardness of each test ball were measured and the
8 surfaces were examined by optical microscopy. The lubricant oil for all tests was Shell Talpa 20 with a kinematic viscosity of 94.6 cst at 40 C and 8.8 at 100 C. The oil was added every 24 hours during the test to maintain the silicon nitride/steel rolling contact under fully lubricated condition. During the test, the load, speed and temperature etc. were recorded in a computer file at pre-set sampling rate. In all tests, temperature was set to 50 C. A typical temperature change during the test period is shown in Fig. 4, in this case the oil was added at time 4 hours, 26 hours and 49 hours. Since the measurement of the temperature at the upper/lower ball contact region was not possible, the actual temperature measured was that of the bulk lubricant oil inside the retainer cup which to some extent to reflect the contact region temperature. Normally, tests were stopped before reaching the set time due to the failure of one of the lower steel balls. In this case the retainer cup assembly was taken out and cleaned and then the test was continued with three new steel balls and fresh oil. The failure of the lower steel ball was normally a fatigue spall on the rolling track as shown in Fig. 5. By changing the lower steel balls, the upper silicon nitride ball could exceed 135million contact stress cycles. After each test, the upper silicon nitride ball was cleaned in an ultrasonic bath by acetone and examined by optical microscopy, SEM, interference profilometry, 3D surface analysis and atomic force microscopy.
9 3. Results and Discussion A summary of the rolling contact fatigue test records is given in Table 3. The calculated Hertz contact stresses [18] is shown in Table 4. In all of the tests, no typical fatigue spall of comparable dimensions to the rolling track was found on any of the silicon nitride balls. Fig. 6 and Fig. 7 show the microscopy observations and the profilometry images respectively, of the rolling tracks of sample A to G after testing. An analytical balance was used to measure the mass of the sample balls before and after RCF test. The mass loss of each of the sample balls after testing were in the range of 0.1 mg ~ 1mg. If this is converted to volume loss, it would be in the range of 0.3 ~ m 3. Although the readability of this balance is 0.1/0.01mg, the repeatability of the measurement result is within a few tenths of 1 mg. In addition, oil residues can be deposited on to the rolling track in some cases to influence the accuracy of mass loss. So in this study the mass loss or volume loss was not used to quantify the rolling contact performance of the sample balls. Instead the change of the surface topography on the rolling track was the major factor used in this study. 3.1 Surface Examination Results for Each Sample Sample A is a commercially finished ball with a R a value µm and a negative skewness value After hours RCF test (181 million stress cycles), no difference can be observed on the rolling track under optical microscopy (Fig. 6A) except for the oil stain deposited on the outer edge of the rolling track which could
10 not be removed by ultrasonic cleaning. Fig. 8 shows the oil stain on the outer edge of the rolling track under higher magnification. Fig. 9 is the analysis of the rolling track by the 3D surface analyzer. From the oblique plot of Fig. 9, slight wear on the rolling track can be seen. This wear on the rolling track is not evenly distributed, featuring less wear in the middle of rolling track. This is a common characteristic, and will be discussed in detail later on. From the Surface Profile of Fig. 9, it can be seen that the wear on the rolling track is very small in the range of 0.05~0.1µm; the height of the oil stain is in the region of 0.15µm. The values of surface roughness parameters are increased nearly 10 times compared to the values in Fig. 2A before testing, with R a increased from 0.005µm to 0.67µm, R q (rms) from to and R z from nm to nm. Although these roughness values in Fig. 9 are the average values from the measured area which includes the oil stain at the edge of rolling track and some area outside the rolling track, most of the measured area is the rolling track. In addition, the roughness parameter R a is an arithmetic average so that occasional higher values, such as those caused by oil deposits, will have less effect than vast majority values inside the rolling track. These results reflect the tendency of the surface in the rolling track to become rougher due to wear. The skewness value changed from 1.38 before the RCF test to 0.465, which means the bulk material is still above mean line but there may be more peaks than before. The surface topographic change and wear on the rolling track cannot be observed in the interference profilometry image in Fig. 7A; only the oil stain on the outer edge of the track can be seen.
11 Sample B is also a commercially finished ball but with a R a value µm and a small positive skewness value of before testing. After hours RCF test (135 million stress cycles), under optical microscopy observation (Fig. 6B) the surface pitting appears on the rolling track and the sides of the rolling track have become smoother. To verify this, a Scanning Electron Microscopy investigation was carried out. Fig. 10 shows the SEM micrographs of sample B, (a) and (b) outside the rolling track, (c) and (d) inside the rolling track. The SEM investigation leads to an assumption that during the rolling contact test, the vast majority of the small and shallow pits disappeared due to the running in wear process and the surface became smoother. However, some of the larger and deeper pits developed into surface pitting due to microcracking. To further confirm the smoothing of the rolling track, an area at one edge of the rolling track without surface pitting was examined using an atomic force microscopy. The result of the AFM examination (Fig. 11) did show the decrease of the roughness parameter values. Compared with Fig. 3B, PV (Roughness peak to valley) is decreased from 0.529µm to 0.248µm, R q from 0.021µm to 0.018µm, R a from to µm and R z from 403nm to248 nm. The interference profilometry image in Fig. 7B shows two surface pits near the middle of the rolling track. Sample C is a commercially finished ball with a R a value µm and a negative skewness value of before RCF test. After hours RCF test (149 million stress cycles), the surface of the rolling track became rougher under optical microscopy observation (Fig. 6C). Fig. 12 shows the result of the rolling track of sample C examined by the 3D surface analyzer. Compared with the 3D roughness
12 parameters measured before the test in Fig. 2C, the values of PV, R q, R a and R z have increased 30 times. Taking the factors influencing the 3D measurement result into account as described with sample A, the surface of the rolling track definitely becomes rougher. The amount of wear and the height of the oil deposits are similar to sample A. The oil stains at the two edges of the rolling track showed in the Oblique Plot of Fig. 12 are similar to those as observed in the interference profilometry image in Fig. 7C. Sample D is a commercially finished ball with a R a value 0.002µm and a R q value 0.003µm which are the smallest values of all of the 7 samples, but PV and R z values are higher than those of Sample C, and with a high positive skewness value R sk of 2.64 and a very high kurtosis value R ku of 47.8 before the RCF test. After hours (177 million stress cycles), no difference can be observed on the rolling track except for oil stains at the track edges under optical microscopy (Fig. 6D). The high skewness and kurtosis values did not make any difference. The interference profilometry image in Fig. 7D shows the oil stain at the outer edge of the track. Small and shallow pitting around 2µm in size was observed with the SEM. Fig. 13 shows the SEM micrograph of small pits on the rolling track of sample D. Sample E is a ball with a R a value 0.094µm, rough lapped by the authors from ball blanks. After hours RCF test (197 million stress cycles), the surface of the rolling track has the same features as Sample B; the rolling track becoming smoother and surface pitting (Fig. 6E). SEM micrographs of sample E are shown in Fig. 14, (a) and (b) outside the rolling track, (c) and (d) inside the rolling track. As with Sample
13 B, the size of the surface pitting was 10~20µm. The interference profilometry image shows the smoother nature of the rolling track (Fig. 7E). Sample F is also a ball rough lapped by authors, but with a R a value 0.080µm. After running for hours (184 million stress cycles), the surface of the rolling track appears smoother under optical microscopy (Fig. 6F) and interference profilometry (Fig. 7F) examination. Occasional surface pitting was found on the rolling track (Fig. 6F). The characteristic of this sample was many small arc cracks parallel to the rolling direction at the two edges of the rolling track as illustrated Fig. 15. Sample G is a ball firstly lapped then polished by authors to an R a value 0.008µm and featured surface scratches left over from the rough lapping process, forming some large valleys on the surface (Fig. 2G). After hours RCF test (186 million stress cycles), some scratches were further developed becoming larger, but did not lead to surface failure (Fig.16). Some small arc cracks parallel to the rolling direction can also be seen (Fig. 16). These small arc cracks are common features for samples G and F and will be discussed later. The extraordinary feature of this sample is a continuous groove formed on the outer edge of the rolling track. This can be clearly seen by interference profilometry image (Fig. 7G) and by the AFM image (Fig.17). The depth of this groove is about 1~1.5µm from the section view of the AFM image (lower right in Fig. 17). The cause of this groove is unclear, it maybe related to the Hertzian maximum tensile stress which is near to the edge of contact zone.
14 3.2 Discussions on Common Characteristics There are some common characteristics in the tests. In all of the three rougher surfaces sample B, E and F with roughness values R a ranging from to 0.094, surface pitting occurred and the size of a typical pit was 10~20µm. Also there was the tendency for those surfaces to become smoother due to running in polishing wear. In all of the four smoother surfaces samples A, C, D, and G with roughness values R a from 0.002~0.008, there was a tendency for these surfaces to become rougher during the RCF tests, with oil residues deposited on the edges of rolling tracks. The film thickness between the contact surfaces and the lubrication regime are calculated using the classical Elastohydrodynamic (EHD) equations [19] and are listed in Table 5. Calculated minimum film thickness is 0.12µm, and the lambda ratios for A, C, D, G are 3.26, 3.29, 3.3 and 3.2 respectively. This means that with samples A, C, D and G, (smoother surfaces), a full fluid film will separate the ceramic/steel contact surfaces initially. This may be also related to the common characteristics of the oil residues deposited on the edges of rolling tracks and the less of surface pitting. As the rolling contact process continuing, the ceramic/steel contact surfaces will become rougher as a result of rolling wear and the lambda ratios will probably fall down. The lambda ratios for B, E, F (rougher surfaces) are 2.89, 0.91 and 1.0 respectively, and this may be related the common characteristics of larger surface pitting. For sample B, the lubrication regime will be partial or mixed EHD throughout testing based on the R q of 0.019µm (Fig 11) on the rolling track after testing giving a lambda ratio of For samples E and F, the lubrication regime will
15 be initially in between mixed EHD and boundary lubrication, then as a result of polishing wear the ceramic surfaces become smoother and the lubrication regime will be within the mixed EHD region. The phenomena of wear or contact marks at the two edges of rolling track being different from the middle of the rolling track, which can be seen in Figs. 6B, 6C, 6E and 6F, could be related to the distribution of Hertz contact shear stress. It is well known that the contact shear stresses are concentrated on the two sides of the contact zone although the maximum shear stresses are located a few tens of µm underneath the surface. It is believed that shear loading drives plastic deformation and this mode of deformation is prompted by the presence of normal compressive stresses during wear [21]. It seems that R a or R q (rms) are still most important roughness parameters. The R a and R q values for samples A, C and D are of the same order and after testing the appearances of the rolling tracks are similar. Although sample D initially had a high positive skewness value R sk of 2.64 and a very high kurtosis value R ku of 47.8, this did not make any differences to the rolling track. The surface of sample G initially contained many large valleys left by the previous rough lapping process (Fig. 2G) and only occasional valleys were developed further. In this case most of the roughness valleys produced by previous lapping process are bigger and deeper than normally would found else where, and most of them did not further develop, nor fail during RCF test. This implies that some deeper lapping marks on the surface can be further developed during RCF, but in general the shape of the valley does not have a
16 significant effect on RCF life. Therefore, the wear model based on surface valleys established by Westkamper [13-14] could not be proved by this study. Small ring cracks were found on samples F and G. The shape and the orientation of these cracks along the rolling track are the same for both samples. As samples G and F were from the same batch of ball blanks and had both been rough lapped using the eccentric lapping method, it is possible that the arc cracks were small Hertzian cracks formed by asperity contacts. These asperities maybe formed during rough lapping process. Further polishing removed some of these asperities, and some asperities still left with their peaks removed. There are many asperities lying within the contact zone, the true contact only occurred at the tips of these asperities, which are compressed as elastic solids in normal contact and their deformations are given by the classic Hertz theory [20]. It maybe also related to the material properties. On the rougher surface (sample F), more small cracks were found on the edges of rolling track. On the smoother surface (sample G), a groove was observed on the outer edge of the rolling track. Whether this groove is a result from the further development of these small cracks at the edge of rolling track is not clear. If it does, then a rougher surface has some advantages over smoother surface. Further studies are needed on this issue.
17 4. Conclusion Seven HIPed silicon nitride ball samples with different surface roughness values were tested in rolling contact against steel balls under lubricated condition at a maximum compressive stress of 6.58GPa and at a speed of 10,000 rpm for 135~200 million stress cycles. No typical fatigue spalls occurred on any of silicon nitride samples and the wear was also very small, in the range of 0.3~ m 3. Based on the test results, the following conclusions were made: (1) For HIPed silicon nitride balls with a rough surface (0.016 to µm R a ) it is more likely for the surface to become smoother due to polishing wear and surface pits in the sizes of 10~20µm may occur. (2) For HIPed silicon nitride balls with a smooth or highly polished surface (0.002 to µm R a ) it is more likely for the surface to become rougher and for oil residues to be deposited at the edges of rolling track. Small, shallow surface pitting about 2µm in extent may also occur. (3) Scratch marks left on HIPed silicon nitride ball surfaces by previous lapping processes can be further extended during RCF, although no failure from these has been observed. (4) It appears that R a and R q remain the most important surface parameters in relation to RCF life. The effects of other surface roughness parameters such as the shape of the valley, R sk and R ku were not obvious in this study.
18 Acknowledgements The authors wish to thank Dr Rahan Ahmed in Heroit-Watt University (UK), Department of Mechanical and Chemical Engineering, for helping measuring the 3D topography of the balls; Professor Shogo Tobe, Professor Fumio Inaba, Dr Yasutaka Ando of Ashikaga Institute of Technology, Japan for helping in atomic force microscopy measurements. References [1] R. T. Cundill, High-precision silicon nitride balls for bearings, Commercial Applications of Precision Manufacturing at Sub-Micro Level, SPIE Vol (1992) [2] J. F. Archard, Contact and Rubbing of Flat Surfaces, Journal of Applied Physics, 24, (1953) [3] R. V. Hasselt, The Functional Behaviour of Surfaces: Some Mechanical Functions, Annals of the CIRP, XVII, (1969), [4] T. E. Tallian, A data-fitted rolling bearing life prediction model-part II: Model fit to the historical experimental database, Tribology Transactions, 39, (1996), [5] C. A. Andersson and R. J. Bratton, Effect of surface finish on the strength of hot pressed silicon nitride, The science of ceramic machining and surface finishing II, National Bureau of Standards Special Publication 562, (1979), [6] C. C. Wu and K. R. McKinney, The effect of surface finishing on the strength of commercial hot pressed Si3N4, The science of ceramic machining and surface finishing II, National Bureau of Standards Special Publication 562, (1979),
19 [7] R. Lakshminarayanan, L. Y. Chao, N. Iyer, and D. K. Shetty, Wear of steel in rolling contact with silicon nitride, Wear, 210, (1997) [8] L. Y. Chao, R. Lakshminarayanan, N. Iyer, G. Y. Lin, and D. K. Shetty, Transient wear of silicon nitride in lubricated rolling contact, Wear, 223, (1998) [9] U. Effner and M. Woydt, Importance of machining on tribology of lubricated sliprolling contacts of Si3N4, SiC, Si3N4-TiN and ZrO2, Wear, 216, (1998), [10] U. Effner and M. Woydt, Economical Machining and Tribological Rolling Wear of Ceramics, Proc. Int. Tribology Conference, I, (1995), , [11] M. Woydt and U. Effner, Influence of machining on friction and wear of lubricated ceramics in slip-rolling contacts, Machining Science and Technology, 1, (1997), [12] M. Woydt and U. Effner, Zirkondioxid Ein neuer Wälzlagerwerkstof? (Zirconia: A new Rolling Bearing Material?), Keramiseche Zeitschrift, 48, (1996), [13] E. Westkaemper and H. W. Hoffmeister, Function-oriented lapping and polishing of ceramic rolling elements through characterization of the workpiece surface, CIRP Annals - Manufacturing Technology, 45, (1996), [14] E. Westkaemper and H. W. Hoffmeister, Function-oriented surface characterization of lapped and polished ceramic rolling elements,7th Int. Conf. on Metrology and Properties of Engineering Surfaces, (1997), [15] R. Tourret and E. P. Wright, Rolling contact fatigue: Performance testing of lubricants, London: Heyden & Son LTD, (1977). [16] J. Kang and M. Hadfield, Parameter optimization by Taguchi Methods for
20 finishing advanced ceramic balls using a novel eccentric lapping machine, Journal of Engineering Manufacture, Proceedings of Institution of Mechanical Engineer, Part B, in the press, (2001). [17 ] J. Kang and M. Hadfield, A study on the lapping of ceramic balls, Surface treatment IV -- computer methods and experimental measurements, Computational Mechanics Publications, Southampton, (1999) [18] K. L. Johnson, Contact Mechanics, Cambridge University Press, 1985 [19] D. Dowson, C. M. Taylor and H. Xu, Elastohydrodanamic Lubrication of Ellipical Contacts with Spin and Rolling, Journal of Mechanical Engineering Science, Proceedings of Institution of Mechanical Engineer, Part C, Vol. 205 (1991), [20] T. A. Stolarski, Fracture Mechanics and the Contact between a Pair of Surface Asperities during Rolling, International Journal of Engineering Science, 27, (1989), [21] J. F. Braza, H. S. Cheng, M. E. Fine, A. K. Gangopadhyay, L. M. Keer, and R. E. Worden, Mechanical failure mechanisms in ceramic sliding and rolling contacts, Triboliogy Transactions, 32, (1989), 1-8.
21 List of Tables and Figures Table 1 The measured geometric and material properties of lower steel balls Table 2 The measured geometric and material properties of samples A to G Table 3 Rolling contact fatigue test records Table 4 The calculated Hertz contact stresses Table 5 The calculated minimum film thickness and lambda ratio Fig. 1 Schematic of the modified four-ball rolling configuration Fig. 2 3D surface topography details of samples A to G before testing. Fig. 3 Photomicrographs of the surfaces of samples A to G before testing. Fig. 4 A typical temperature plot during the test period Fig. 5 A typical fatigue spall on a lower steel ball Fig. 6 Photomicrographs of the rolling tracks of samples A to G after testing. Fig. 7 The interference profilometry images of the rolling tracks of samples A to G after testing. Fig. 8 The outer edge of the rolling track of sample A Fig. 9 Rolling wear track of sample A observed by 3D surface structure analysis Fig. 10 SEM micrographs of sample B, (a) and (b) outside the rolling track, (c) and (d) inside the rolling track. Fig. 11 AFM image of the rolling track of sample B after testing. Fig. 12 Rolling track of sample C observed by 3D surface analysis Fig. 13 Small pitting on the rolling track of sample D. Fig. 14 SEM micrographs of sample E, (a) and (b) outside the rolling track, (c) and (d) inside the rolling track. Fig. 15 The small arc cracks at the edge of the rolling track, and surface pitting of sample F Fig. 16 A further developed scratch and arc cracks on the rolling track of sample G Fig. 17 AFM image of sample G after running146 hours.
22 Table 1 The measured geometric and material properties of lower steel balls Diameter mm Density 7789 (kg/m 3 ) Surface roughness R a µm Surface roughness R q µm Surface Hardness 907 (HV10) Surface Hardness 65.2 HRC-150kg Table 2 The measured geometric and material properties of samples A to G Samples Diameter Surface roughness Density Surface Hardness mm R a µm (3D) (kg/m 3 ) (HV10 ) A B C D E F G
23 Table 3 Rolling contact fatigue test records Sample Total RCF test duration (hours) Total contact stress cycles (million) Lower balls changed after (hours) Final temperature ( C ) Test termination and observations A , , Oil residues on upper ball B , 10.2, One lower ball small spall, small amount of dark debris in oil C , Oil residues on upper ball D , 8.91, Oil residues on upper ball, Some rust-like debris in the oil at the bottom of the retainer cup E , 1.74, Terminated (without incident) F , 67.02, Terminated (without incident) G , 62.37, Terminated (without incident) small amount of dark debris in oil
24 Table 4 The calculated Hertz contact stresses PLINT Machine Load (KN) 1.96 Contact Load (N) 800 Max. Compressive Stress (GPa) 6.58 Radius of Contact Circle (mm) 0.24 Max. Shear Stress (GPa) 2.04 Max. Tensile Stress (GPa) 1.01 Table 5 The calculated minimum film thickness and lambda ratio Samples R q1 (µm) R q2 (µm) ceramic steel h min (µm) A B C D E F G λ
25
26
27 35.3 Fig 1 Schematic of the modified four-ball rolling configuration 1 spindle 2 collet 3 upper-ball 4 lower-balls 5 heater pad 6 cup holder 7 retainer cup 8 cup cover

28 A B C D E F G Fig. 2 3D surface topography details of samples A to G before testing


29 A B C D E F G Fig. 3 Photomicrographs of the surfaces of samples A ~ G before testing.


30 A B C D E F G Fig. 6 Photomicrographs of the rolling tracks of samples A to G after testing.


31 A B C D E F G Fig. 7 The interference profilometry images of the rolling tracks of samples A to G after testing.
 Fig. 4 A typical temperature plot during the test period Fig.")
32 Temperature Change During test Temperature ( C) Testing Time (hours) Fig. 4 A typical temperature plot during the test period Fig. 5 A typical fatigue spall on a lower steel ball

33 Fig. 8 The outer edge of the rolling track of sample A


34 Fig. 9 Rolling wear track of sample A observed by 3D surface analysis

")

 inside")
35 (a) (c) (b) (d) Fig. 10 SEM micrographs of sample B, (a) and (b) outside the rolling track, (c) and (d) inside the rolling track.

36 Fig. 11 AFM image of the rolling track of sample B after testing.

37 Fig. 12 Rolling track of sample C observed by 3D surface analysis

38 Fig. 13. Small pitting on the rolling track of sample D.

")

 inside")
39 (a) (b) (c) (d) Fig. 14 SEM micrographs of sample E, (a) and (b) outside the rolling track, (c) and (d) inside the rolling track.


40 Fig. 15 The small arc cracks at the edge of the rolling track, and surface pitting of sample F Fig. 16 A further developed scratch and small arc cracks on the rolling track of sample G 40

41 41

42 Fig. 17 AFM image of sample G after running for 146 hours. 42